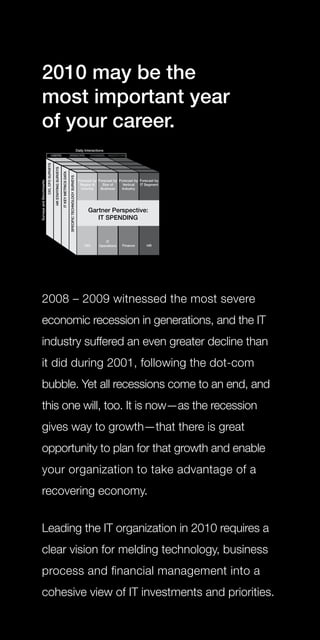
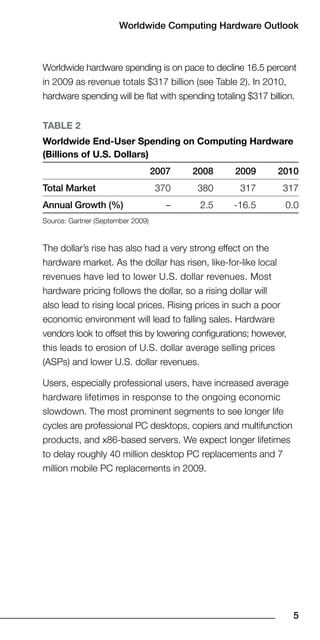
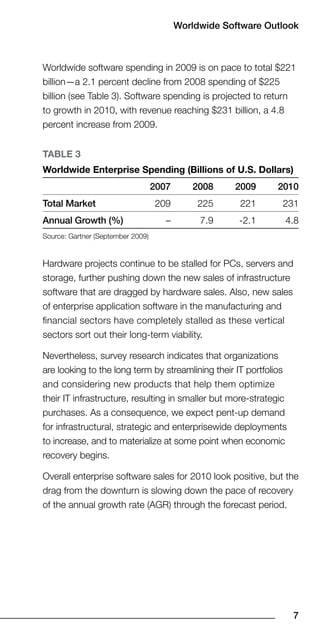
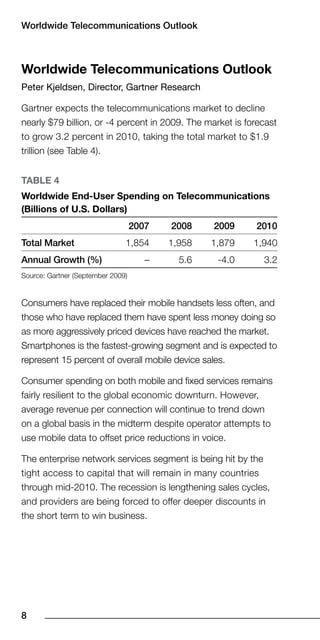
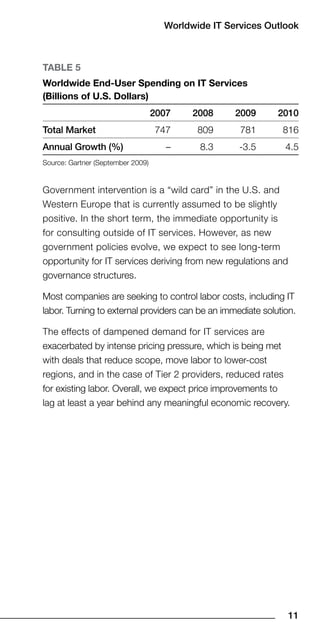
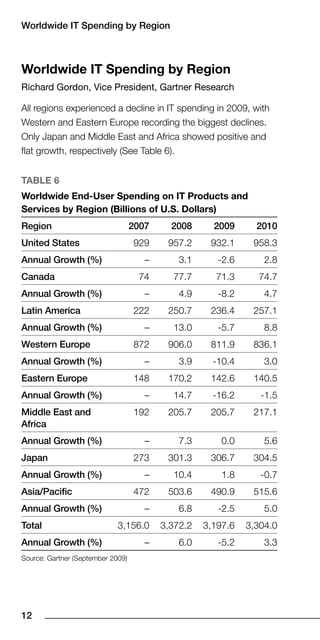
The “Gartner Perspective: IT Spending” booklet provides an
overview of Gartner research on IT spending and functions as
a reference guide to top-level statistics and IT spending analysis.
It provides a glimpse into the
powerful insight Gartner can
provide as you navigate through
what may be the most important
year of your career.
Tales from the Optimization Trenches - Unite Copenhagen 2019Unity Technologies
In this talk, you'll learn about the tools and techniques that Unity's Consulting and Development team uses to identify and fix performance issues. The team travels the world visiting customers and conducting Project Reviews, in-depth engagements to locate and resolve performance bottlenecks. This session is designed to help you apply their knowledge to your Unity projects, so you'll see examples of real-life performance problems, their solutions, and receive up-to-date best practice advice.
Speaker: Ignacio Liverotti – Unity
Watch the session on YouTube: https://youtu.be/GuODu4-cXXQ
Pragmatic Optimization in Modern Programming - Mastering Compiler OptimizationsMarina Kolpakova
Explains compilers optimizations, gives taxanomy and examples. The examples are mostly compiler for ARM armv7-a and armv8-a targets, but most of optimizations are machine independent.
SLIDES WITH NOTES: http://bitly.com/rej-practical-ai
This talk is an introductory material for students and programmers aspiring for developing AI for games.
Talk is split into 2 parts - first part provides an overview on popular AI approaches in games and second part gives an outlook on technology that might be relevant for games AI in the future.
I gave this talk at Vilnius University as a guest speaker in the late October 2016.
Description:
With the Summer '15 release, you will be able to automatically create, update, and delete user accounts on services such as Google and Box, based on changes to user accounts in your Salesforce organization or Active Directory service. This feature also provides a centralized view of all user accounts across your applications and services. Learn how you can automate user account management across third-party applications and services!
What you will learn:
How user events, such as creating a user or assigning a permission set, can trigger corresponding updates in third-party services
How automatic de-provisioning of third-party user accounts can improve security while saving you time and money
How Salesforce Identity Connect can capture events in Active Directory and apply user provisioning updates to Salesforce that in turn can trigger updates to an external application
How approval processes, auditing, and reporting help you manage user accounts effectively
Intended audience
Existing or prospective Salesforce Platform admins and developers
ISV partners who want to package this feature to automate user creation and deletion in their applications running outside the Salesforce platform.
Maybe you have hosted multiple webinars, or are leading up to your first event! Either way, learn the proper webinar etiquette for being the presenter, co-presenter and an attendee.
Email is the cornerstone of any successful marketing campaign. In fact, 68% of marketers say that email is a core component of their business strategy. So, maximizing the impact of your customer emails is more important today than ever before.
Nearly 83 promotional emails are sent to your customers each day, heightening the scrutiny of inbox management. By leveraging the power of Predictive Intelligence in your email marketing strategy, you help your customers make the ‘keep or delete’ decision effortless with meaningful, personalized content in each email that subscribers won’t ignore.
Please join Eric Tobias, Vice President of Web and Predictive Intelligence Products, Salesforce ExactTarget Marketing Cloud, for an insightful webinar that will focus on nurturing your 1:1 customer relationships and maximizing inbox relevancy with seven strategies to enrich your email marketing.
Mission Critical Applications Workloads on Amazon Web ServicesAmazon Web Services
In this session we will walk through practical examples of how Amazon Web Services customers operate heavily regulated workloads and mission critical applications in the cloud. Through real world customer examples we will apply security and governance controls which will provide you with increased visibility and control of your application and infrastructure for these workloads. You will learn how Enterprise secure and enable audit controls on their heavily regulated workloads in an Amazon Web Services Account. At the same time, extend your datacenter and control mechanisms to Amazon Web Services.
Shaun Ray, Head of Solutions Architect, Amazon Web Services, ASEAN
How to Identify and Prevent ESD Failures using PathFinderAnsys
This presentation provides an introduction to common ESD failure mechanism in today's ICs and the challenges in addressing them. It will highlight PathFinder, a layout based ESD integrity analysis platform with an integrated modeling, extraction and simulation environment that enables IC designers perform exhaustive verification of all ESD discharge pathways at the IP and full-chip level. It will also share case study of some real life ESD failure scenarios and how PathFinder was used to root-cause them. It reviews the list of ESD checks that can be performed from early floor planning to final sign-off for ESD robustness and ESD failure prevention. Learn more on our website: https://bit.ly/1vRDycB
Intrusion Detection in the Cloud (SEC402) | AWS re:Invent 2013Amazon Web Services
For businesses running entirely on AWS, your AWS account is one of your most critical assets. Just as you might run an intrusion detection system in your on-premises network, you should monitor activity in your account to detect abnormal behavior. This session walks you through leveraging unique capabilities provided within AWS that enable you to detect and respond to changes in your environment.
How to Articulate the Value of Enterprise Architecturecccamericas
Ever struggled with the question, What is the Value of Enterprise Architecture? In this facilitated conversation, Michael Fulton will share his perspective on Enterprise Architecture and the value it provides to the CIO, to IT, and to the business.
Come ready to engage, because in the conversation we will discuss:
•The EA 7-year itch
•Several External Perspectives on EA Value
•The CC&C perspective on a simplified approach to EA Value
•Ensuring your perspective on EA Value is relevant for your stakeholders
At the end of this conversation, you should walk away with:
•A new perspective on the value of EA
•Tips and tricks on how to articulate and quantify EA Value for your key stakeholders.
WEEK 3 ASSIGNMENT RESEARCH ANALYSIS FOR BUSINESS1WEEK 3 ASSIGN.docxjessiehampson
WEEK 3 ASSIGNMENT: RESEARCH ANALYSIS FOR BUSINESS 1
Analysis of Intel’s Economic Data and Business Data
Omitted
ECO561
Omitted
Omitted
Analysis of Intel’s Economic Data and Business Data
1.) Intel is the American global technology company that has the most dominant and pervasive technology. It is the largest producer of semiconductor chips and has invented a series of microprocessors. Intel primarily operates in a monopoly as it has various competitive advantages that are hard to replicate by most companies around the world. Intel has a market share of about 93% (Rexaline, 2019). It operates in a monopoly with a competitive fringe. (Bolded Section above is what the instructors feedback pertained to)
2.) One of its biggest competitors is Microsoft and Advanced Micro Devices (AMD). Barriers to entry are patents obtained by companies to prevent other companies from replicating their technology. Vertical integration is another barrier that is a strategy employed by companies whereby they control their highly specialized supply chain. Contract with PC manufacturers can also be a hindrance to entering the microprocessor market. Intel leveraged on a 10-period unprecedented growth and became a primary supplier of the microprocessor to the PC industry, deriving enormous revenues to expand.
3.) The U.S. economy is in the expansion phase since 2009. As of January 2019, under the current administration, the economy is growing healthy from 2% to 3%. Expansion reached its peak as there are no significant changes in inflation. The real gross domestic product (GDP) has an average growth rate of 2.3%. The Trump Tax Act, which reduced the corporate tax rates, increased investment. The real GDP of the United States in 2019 amounted to $19,073 trillion. (Refer to Graph 1 in the Appendix)
The annual inflation rate for the U.S. is 1.5% for the year ended March 2020 as compared to 2.3% in the preceding year. Annual rates of inflation were calculated using 12-month selections of the Consumer Price Index, which is published monthly by the Labor Department's Bureau of Labor Statistics (BLS) (Macro trends, 2020). (Refer to Graph B)
The rate of unemployment in the United States for 2020, pre-COVID-19, was 4.4% which is the same as it was in 2017. It has a reasonably flat curve, which means there is no significant change in the rate of unemployment in the past three years. (Amaded, 2020). The federal fund rate of the United States is 0.05%, which is relatively low as compared to 2.43% in the preceding year. (Refer to Graph C)
Keeping the federal fund rate low is an expansion strategy in order to strengthen the economy as savings are passed on to consumers in the form of low-priced loans. (Refer to Graph D)
The rate for borrowing funds, also known as the prime rate, of The United States, is 3.25% compared with 5.5% in the preceding year. It is the underlying index for lines of credit and vari ...
Standard & Poor's Industry Surveys: Computers, Hardware - October 28, 2010Steven Duque
Computer hardware markets grew at a fast pace in the first half of 2010, then shifted to a slower speed
entering the second half due to several factors, in our opinion. The outlook for growth in gross domestic
product (GDP) dampened, hardware inventory levels caught up with end-demand levels, and consumer
demand for low-priced netbook PCs ebbed, thereby reducing the outlook for personal computer (PC) unit
shipment growth. The computer industry’s progress toward what we believe will be a multi-year expansion
began after a deep downturn in late 2008 and early 2009, and a period of demand stabilization near cycletrough
levels in mid-2009. Demand drivers in the present expansion include improving price and
performance characteristics for PCs and servers, and the need to satisfy pent-up demand for updated
technology in homes and offices.
The computer hardware industry’s burst of growth in the first half of 2010 was most evident in the PC
industry. The growth rate for PC unit shipments in the first quarter of 2010 (versus Q1-2009) was very
brisk at 27.1%, and remained brisk in the second quarter at 22.9% (compared with Q2-2009), according to
data from market research firm IDC. In our view, any year with PC unit growth near 15% is a solid year
for the industry. The last year in which the industry achieved 15% PC unit shipment growth was 2007, the
last full year before the economic downturn set in. Therefore, a unit growth rate above 20% appears
unusually perky to us, and is probably unsustainable.
10 Key Action to Reduce IT Infrastructure and Operation Cost StuctureIcomm Technologies
With NetApp, we have realized major cost savings in terms of our storage and server infrastructure. This has allowed us to catch up with other colleges and universities that compete with us by freeing up budget to invest
in classroom technologies.”
it & Economic Performance a Critical Review of the Empirical DataWaqas Tariq
The present study undertakes a critical review of the research around the multi-significant issue of the correlation between the IT investments and the economic performance to both micro and macroeconomic level. The aim of this study is to shed light on the interaction of IT with the economy, at corporate, industry and national level and document it¢ s contribution to productivity and therefore to economic growth. My conclusion is that there is a positive effect of IT investments to both the above economic indicators in all aspects, but is something that needs further research so as to find a more clear and risk adjusted relation.
Market share analysis india-based providers' performance show mixed results ...Semalytix
Summary:
Collectively and individually, the impact of the six leading India-based IT services providers continued in 2009, with HCL, Cognizant, Wipro, TCS, and Infosys (in order of growth rates) all achieving growth that outpaced the rest of the market,
Key Findings
• In 2009, the top six India-based providers' collective share of the global IT services market was 2.7%, up slightly from their 2.5% share in 2008.
• The largest of the India-based providers, TCS, with $5.7 billion in worldwide revenue in 2009, is ranked No. 25 in overall IT services market share
• The top India-based performers in total IT services revenue growth were HCL (27.6% annual growth on $2.2 billion in revenue) and Cognizant (16.4% growth on $3.1 billion in revenue). In rank order, HCL moved up from 75th position in 2008 to 60th in 2009 and Cognizant moved up from 48th to 42nd in the same time period.
• The top six India-based providers are also clearly diversifying their geographic presence, as well as expanding their service lines
HCL:
HCL recorded the highest growth in 2009, benefiting from the acquisition of SAP consultancy Axon, as well as winning some large total outsourcing deals signed in 2008, revenue of which flowed into the subsequent quarters of 2009. These total outsourcing deals also included rebadging of client employees quite unlike other Indian providers. High growth was also the result of aggressive and focused sales efforts to retain clients. Moreover, HCL experienced relatively little impact in the vendor consolidation activity during the downturn, which signifies high customer satisfaction among HCL's clients; contributing factors of quality process focus, as well as the company's "employee first, customer second" principle. HCL's acquisition of Axon also yielded business growth, as it continued to upsell/cross-sell services to this newly acquired client base.
IT Infrastructure on the Verge of Technological SingularityMiraworks.io
Miraworks, the world's first multi-vender platform for IT infrastructure design, presents its vision of the industry up until 2030. The White Paper, entitled "IT Infrastructure on the Verge of Technological Singularity", covers the development trends of the global IT infrastructure, including a transition to open multivendor solutions in IT infrastructure design, looming professional IT standards, and integrated tools for designing traditional and cloud IT infrastructures.
This document brings together a set
of latest data points and publicly
available information relevant for
Technology Industry. We are very
excited to share this content and
believe that readers will benefit from
this periodic publication immensely.
RMD24 | Retail media: hoe zet je dit in als je geen AH of Unilever bent? Heid...BBPMedia1
Grote partijen zijn al een tijdje onderweg met retail media. Ondertussen worden in dit domein ook de kansen zichtbaar voor andere spelers in de markt. Maar met die kansen ontstaan ook vragen: Zelf retail media worden of erop adverteren? In welke fase van de funnel past het en hoe integreer je het in een mediaplan? Wat is nu precies het verschil met marketplaces en Programmatic ads? In dit half uur beslechten we de dilemma's en krijg je antwoorden op wanneer het voor jou tijd is om de volgende stap te zetten.
India Orthopedic Devices Market: Unlocking Growth Secrets, Trends and Develop...Kumar Satyam
According to TechSci Research report, “India Orthopedic Devices Market -Industry Size, Share, Trends, Competition Forecast & Opportunities, 2030”, the India Orthopedic Devices Market stood at USD 1,280.54 Million in 2024 and is anticipated to grow with a CAGR of 7.84% in the forecast period, 2026-2030F. The India Orthopedic Devices Market is being driven by several factors. The most prominent ones include an increase in the elderly population, who are more prone to orthopedic conditions such as osteoporosis and arthritis. Moreover, the rise in sports injuries and road accidents are also contributing to the demand for orthopedic devices. Advances in technology and the introduction of innovative implants and prosthetics have further propelled the market growth. Additionally, government initiatives aimed at improving healthcare infrastructure and the increasing prevalence of lifestyle diseases have led to an upward trend in orthopedic surgeries, thereby fueling the market demand for these devices.
Buy Verified PayPal Account | Buy Google 5 Star Reviewsusawebmarket
Buy Verified PayPal Account
Looking to buy verified PayPal accounts? Discover 7 expert tips for safely purchasing a verified PayPal account in 2024. Ensure security and reliability for your transactions.
PayPal Services Features-
🟢 Email Access
🟢 Bank Added
🟢 Card Verified
🟢 Full SSN Provided
🟢 Phone Number Access
🟢 Driving License Copy
🟢 Fasted Delivery
Client Satisfaction is Our First priority. Our services is very appropriate to buy. We assume that the first-rate way to purchase our offerings is to order on the website. If you have any worry in our cooperation usually You can order us on Skype or Telegram.
24/7 Hours Reply/Please Contact
usawebmarketEmail: support@usawebmarket.com
Skype: usawebmarket
Telegram: @usawebmarket
WhatsApp: +1(218) 203-5951
USA WEB MARKET is the Best Verified PayPal, Payoneer, Cash App, Skrill, Neteller, Stripe Account and SEO, SMM Service provider.100%Satisfection granted.100% replacement Granted.
Explore our most comprehensive guide on lookback analysis at SafePaaS, covering access governance and how it can transform modern ERP audits. Browse now!
Enterprise Excellence is Inclusive Excellence.pdfKaiNexus
Enterprise excellence and inclusive excellence are closely linked, and real-world challenges have shown that both are essential to the success of any organization. To achieve enterprise excellence, organizations must focus on improving their operations and processes while creating an inclusive environment that engages everyone. In this interactive session, the facilitator will highlight commonly established business practices and how they limit our ability to engage everyone every day. More importantly, though, participants will likely gain increased awareness of what we can do differently to maximize enterprise excellence through deliberate inclusion.
What is Enterprise Excellence?
Enterprise Excellence is a holistic approach that's aimed at achieving world-class performance across all aspects of the organization.
What might I learn?
A way to engage all in creating Inclusive Excellence. Lessons from the US military and their parallels to the story of Harry Potter. How belt systems and CI teams can destroy inclusive practices. How leadership language invites people to the party. There are three things leaders can do to engage everyone every day: maximizing psychological safety to create environments where folks learn, contribute, and challenge the status quo.
Who might benefit? Anyone and everyone leading folks from the shop floor to top floor.
Dr. William Harvey is a seasoned Operations Leader with extensive experience in chemical processing, manufacturing, and operations management. At Michelman, he currently oversees multiple sites, leading teams in strategic planning and coaching/practicing continuous improvement. William is set to start his eighth year of teaching at the University of Cincinnati where he teaches marketing, finance, and management. William holds various certifications in change management, quality, leadership, operational excellence, team building, and DiSC, among others.
Taurus Zodiac Sign_ Personality Traits and Sign Dates.pptxmy Pandit
Explore the world of the Taurus zodiac sign. Learn about their stability, determination, and appreciation for beauty. Discover how Taureans' grounded nature and hardworking mindset define their unique personality.
Premium MEAN Stack Development Solutions for Modern BusinessesSynapseIndia
Stay ahead of the curve with our premium MEAN Stack Development Solutions. Our expert developers utilize MongoDB, Express.js, AngularJS, and Node.js to create modern and responsive web applications. Trust us for cutting-edge solutions that drive your business growth and success.
Know more: https://www.synapseindia.com/technology/mean-stack-development-company.html
[Note: This is a partial preview. To download this presentation, visit:
https://www.oeconsulting.com.sg/training-presentations]
Sustainability has become an increasingly critical topic as the world recognizes the need to protect our planet and its resources for future generations. Sustainability means meeting our current needs without compromising the ability of future generations to meet theirs. It involves long-term planning and consideration of the consequences of our actions. The goal is to create strategies that ensure the long-term viability of People, Planet, and Profit.
Leading companies such as Nike, Toyota, and Siemens are prioritizing sustainable innovation in their business models, setting an example for others to follow. In this Sustainability training presentation, you will learn key concepts, principles, and practices of sustainability applicable across industries. This training aims to create awareness and educate employees, senior executives, consultants, and other key stakeholders, including investors, policymakers, and supply chain partners, on the importance and implementation of sustainability.
LEARNING OBJECTIVES
1. Develop a comprehensive understanding of the fundamental principles and concepts that form the foundation of sustainability within corporate environments.
2. Explore the sustainability implementation model, focusing on effective measures and reporting strategies to track and communicate sustainability efforts.
3. Identify and define best practices and critical success factors essential for achieving sustainability goals within organizations.
CONTENTS
1. Introduction and Key Concepts of Sustainability
2. Principles and Practices of Sustainability
3. Measures and Reporting in Sustainability
4. Sustainability Implementation & Best Practices
To download the complete presentation, visit: https://www.oeconsulting.com.sg/training-presentations
"𝑩𝑬𝑮𝑼𝑵 𝑾𝑰𝑻𝑯 𝑻𝑱 𝑰𝑺 𝑯𝑨𝑳𝑭 𝑫𝑶𝑵𝑬"
𝐓𝐉 𝐂𝐨𝐦𝐬 (𝐓𝐉 𝐂𝐨𝐦𝐦𝐮𝐧𝐢𝐜𝐚𝐭𝐢𝐨𝐧𝐬) is a professional event agency that includes experts in the event-organizing market in Vietnam, Korea, and ASEAN countries. We provide unlimited types of events from Music concerts, Fan meetings, and Culture festivals to Corporate events, Internal company events, Golf tournaments, MICE events, and Exhibitions.
𝐓𝐉 𝐂𝐨𝐦𝐬 provides unlimited package services including such as Event organizing, Event planning, Event production, Manpower, PR marketing, Design 2D/3D, VIP protocols, Interpreter agency, etc.
Sports events - Golf competitions/billiards competitions/company sports events: dynamic and challenging
⭐ 𝐅𝐞𝐚𝐭𝐮𝐫𝐞𝐝 𝐩𝐫𝐨𝐣𝐞𝐜𝐭𝐬:
➢ 2024 BAEKHYUN [Lonsdaleite] IN HO CHI MINH
➢ SUPER JUNIOR-L.S.S. THE SHOW : Th3ee Guys in HO CHI MINH
➢FreenBecky 1st Fan Meeting in Vietnam
➢CHILDREN ART EXHIBITION 2024: BEYOND BARRIERS
➢ WOW K-Music Festival 2023
➢ Winner [CROSS] Tour in HCM
➢ Super Show 9 in HCM with Super Junior
➢ HCMC - Gyeongsangbuk-do Culture and Tourism Festival
➢ Korean Vietnam Partnership - Fair with LG
➢ Korean President visits Samsung Electronics R&D Center
➢ Vietnam Food Expo with Lotte Wellfood
"𝐄𝐯𝐞𝐫𝐲 𝐞𝐯𝐞𝐧𝐭 𝐢𝐬 𝐚 𝐬𝐭𝐨𝐫𝐲, 𝐚 𝐬𝐩𝐞𝐜𝐢𝐚𝐥 𝐣𝐨𝐮𝐫𝐧𝐞𝐲. 𝐖𝐞 𝐚𝐥𝐰𝐚𝐲𝐬 𝐛𝐞𝐥𝐢𝐞𝐯𝐞 𝐭𝐡𝐚𝐭 𝐬𝐡𝐨𝐫𝐭𝐥𝐲 𝐲𝐨𝐮 𝐰𝐢𝐥𝐥 𝐛𝐞 𝐚 𝐩𝐚𝐫𝐭 𝐨𝐟 𝐨𝐮𝐫 𝐬𝐭𝐨𝐫𝐢𝐞𝐬."
Cracking the Workplace Discipline Code Main.pptxWorkforce Group
Cultivating and maintaining discipline within teams is a critical differentiator for successful organisations.
Forward-thinking leaders and business managers understand the impact that discipline has on organisational success. A disciplined workforce operates with clarity, focus, and a shared understanding of expectations, ultimately driving better results, optimising productivity, and facilitating seamless collaboration.
Although discipline is not a one-size-fits-all approach, it can help create a work environment that encourages personal growth and accountability rather than solely relying on punitive measures.
In this deck, you will learn the significance of workplace discipline for organisational success. You’ll also learn
• Four (4) workplace discipline methods you should consider
• The best and most practical approach to implementing workplace discipline.
• Three (3) key tips to maintain a disciplined workplace.
Attending a job Interview for B1 and B2 Englsih learnersErika906060
It is a sample of an interview for a business english class for pre-intermediate and intermediate english students with emphasis on the speking ability.
As a business owner in Delaware, staying on top of your tax obligations is paramount, especially with the annual deadline for Delaware Franchise Tax looming on March 1. One such obligation is the annual Delaware Franchise Tax, which serves as a crucial requirement for maintaining your company’s legal standing within the state. While the prospect of handling tax matters may seem daunting, rest assured that the process can be straightforward with the right guidance. In this comprehensive guide, we’ll walk you through the steps of filing your Delaware Franchise Tax and provide insights to help you navigate the process effectively.
2. 2010 may be the
most important year
of your career.
2008 – 2009 witnessed the most severe
economic recession in generations, and the IT
industry suffered an even greater decline than
it did during 2001, following the dot-com
bubble. Yet all recessions come to an end, and
this one will, too. It is now—as the recession
gives way to growth—that there is great
opportunity to plan for that growth and enable
your organization to take advantage of a
recovering economy.
Leading the IT organization in 2010 requires a
clear vision for melding technology, business
process and financial management into a
cohesive view of IT investments and priorities.
3. IT Spending Overview
The basis for such vision is insight into which industries,
countries and IT priorities will grow fastest, first, giving you the
ability to anticipate and innovate rather than react and follow.
Gartner delivers that insight through unique perspectives on
IT spending, including peer benchmarks, spending forecasts
and budgeting constructs. Gartner has the most extensive IT
benchmarking database available, enabling clients to assess
their IT spending relative to their peer organizations based
on size, industry and geography. Gartner also surveys HR
and finance professionals to gain their unique perspective
on IT. In addition, daily interactions with technology and
service providers and investors provide another dimension
to our analysis of IT spending. The 3,700 CIOs and senior IT
executive who are members of Gartner Executive Programs
also provide invaluable insight into the leading practitioners
of information technology, further rounding out the nuanced
viewpoint only Gartner offers.
Gartner analysts are world-renowned experts in their fields,
leveraging all of these perspectives to create holistic forecasts
of the IT industry. It is this uniquely broad set of inputs, combined
with analyst expertise and daily interactions with clients, that
enables Gartner to decisively forecast the IT industry across
industries, geographies and enterprise size. Simply stated,
Gartner delivers the world’s most comprehensive, accurate
perspective on IT spending.
The “Gartner Perspective: IT Spending” booklet provides an
overview of Gartner research on IT spending and functions as
a reference guide to top-level statistics and IT spending analysis.
It provides a glimpse into the
powerful insight Gartner can
provide as you navigate through
what may be the most important
year of your career.
Barbara Gomolski
Managing Vice President
Gartner Research
4. Table of Contents
3 Worldwide IT Spending Forecast
4 Worldwide Computing Hardware Outlook
6 Worldwide Software Outlook
8 Worldwide Telecommunications Outlook
10 Worldwide IT Services Outlook
12 Worldwide IT Spending by Region
13 IT Spending Trends by Vertical Industry
16 IT Metrics: IT Staffing Levels for 2010
18 CIO Agenda 2010
5. Worldwide IT Spending Forecast
Worldwide IT Spending Forecast
Richard Gordon, Vice President, Gartner Research
The global economic downturn has continued to weigh on
the ability and desire of businesses and consumers to make
IT purchases. However, we assume the economy will recover,
beginning towards the end of 2009 and tentatively at first.
While initial growth in IT spending in 2010 and 2011 may come
as the result, directly or indirectly, of the various government
stimulus packages announced around the world in recent
months, there will be a return to more sustained growth in IT
spending in 2012 and 2013 as the economic recovery unfolds.
IT budget cuts may have slowed market growth in the short
term but, even in the toughest of business environments,
enterprises must preserve short-term spending on critical
business operations and long-term technology investments.
IT vendors should be sensitive to the challenges faced by their
customers and plan pricing strategies accordingly.
The global economic downturn may be easing, but IT budgets
are still being cut and consumers will need more persuading
before they feel confident enough to spend more. Worldwide
IT spending is forecast to total $3.2 trillion in 2009, a 5.2 percent
decrease from 2008 spending of $3.4 trillion (see Table 1).
Worldwide IT spending is expected to return to growth in 2010
as revenue is projected to reach $3.3 billion, a 3.3 percent
increase from 2009.
TaBle 1
Worldwide end-User Spending on IT
(Billions of U.S. Dollars)
007 008 009 010
Total Market 3,181 3,372 3,198 3,304
Annual Growth (%) – 6.0 -5.2 3.3
Source: Gartner (September 2009)
6. Worldwide IT Spending Forecast
In addition, during the next two years IT vendors should:
– Reassess rapidly changing customer needs and
opportunities. For example, social networks are impacting
the way in which vendors should communicate with
customers. Marketing messages must be managed and
controlled more closely.
– Rebalance priorities between customer acquisition and
retention. As the sales environment has become more
challenging, business will have focused much harder on
retaining existing customers.
– Provide realistic business return on investment statistics,
benchmarks and proofs of concept. For example,
ensure that products and services deliver tangible and
demonstrable business benefits.
– Revaluate and refine partnership programs, relationships
and strategies. For example, quantify and justify assumptions
of the opportunity available to partners, and prepare for new
market entry with partners that can provide regional, vertical
market and application integration skills.
Worldwide Computing Hardware Outlook
Jon Hardcastle, Director, Gartner Research
Hardware is the easiest segment of IT spend to cut from
budgets as there is no ongoing spend to support. Hardware
spend is also heavily impacted by the poor access to credit,
both for individuals and companies. Hardware will therefore see
the steepest decline of all segments during 2009. The weakest
segments are PCs and servers. These segments are impacted
by delayed replacement activity and very little new investment.
7. Worldwide Computing Hardware Outlook
Worldwide hardware spending is on pace to decline 16.5 percent
in 2009 as revenue totals $317 billion (see Table 2). In 2010,
hardware spending will be flat with spending totaling $317 billion.
TaBle 2
Worldwide end-User Spending on Computing Hardware
(Billions of U.S. Dollars)
007 008 009 010
Total Market 370 380 317 317
Annual Growth (%) – 2.5 -16.5 0.0
Source: Gartner (September 2009)
The dollar’s rise has also had a very strong effect on the
hardware market. As the dollar has risen, like-for-like local
revenues have led to lower U.S. dollar revenues. Most
hardware pricing follows the dollar, so a rising dollar will
also lead to rising local prices. Rising prices in such a poor
economic environment will lead to falling sales. Hardware
vendors look to offset this by lowering configurations; however,
this leads to erosion of U.S. dollar average selling prices
(ASPs) and lower U.S. dollar revenues.
Users, especially professional users, have increased average
hardware lifetimes in response to the ongoing economic
slowdown. The most prominent segments to see longer life
cycles are professional PC desktops, copiers and multifunction
products, and x86-based servers. We expect longer lifetimes
to delay roughly 40 million desktop PC replacements and 7
million mobile PC replacements in 2009.
8. Worldwide Hardware and Systems Outlook
Companies are reviewing their deployment strategies and
making decisions such as permanently lengthening life cycles,
deploying virtualization, consolidating devices, migrating
from higher-cost platforms or cutting non-core infrastructure.
Meanwhile, while new strategies are developed, there will be
further buyer inertia and sales cycles will lengthen.
We expect 2010 spending to be at a similar level to 2009.
Although we will see an increase in replacement activity,
this will take place in a highly cost-constrained environment.
Lower configured systems, lower ASPs, virtualization and
consolidation will mean that the increase in replacement demand
will not necessarily be reflected in increased levels of spend.
Worldwide Software Outlook
Joanne Correia, Managing Vice President, Gartner Research
Cost optimization will benefit alternative software acquisition
models as organizations will look for ways to shift spending
from capital expenditures to operating expenditures. Because
of this, vendors offering software as a service (SaaS), IT asset
management, virtualization capabilities and a good open-
source strategy will benefit. However, the still-small portion
of spending coming from these technology areas does not
have the ability to improve the gloomy outlook for the overall
software market.
9. Worldwide Software Outlook
Worldwide software spending in 2009 is on pace to total $221
billion—a 2.1 percent decline from 2008 spending of $225
billion (see Table 3). Software spending is projected to return
to growth in 2010, with revenue reaching $231 billion, a 4.8
percent increase from 2009.
TaBle 3
Worldwide enterprise Spending (Billions of U.S. Dollars)
007 008 009 010
Total Market 209 225 221 231
Annual Growth (%) – 7.9 -2.1 4.8
Source: Gartner (September 2009)
Hardware projects continue to be stalled for PCs, servers and
storage, further pushing down the new sales of infrastructure
software that are dragged by hardware sales. Also, new sales
of enterprise application software in the manufacturing and
financial sectors have completely stalled as these vertical
sectors sort out their long-term viability.
Nevertheless, survey research indicates that organizations
are looking to the long term by streamlining their IT portfolios
and considering new products that help them optimize
their IT infrastructure, resulting in smaller but more-strategic
purchases. As a consequence, we expect pent-up demand
for infrastructural, strategic and enterprisewide deployments
to increase, and to materialize at some point when economic
recovery begins.
Overall enterprise software sales for 2010 look positive, but the
drag from the downturn is slowing down the pace of recovery
of the annual growth rate (AGR) through the forecast period.
7
10. Worldwide Telecommunications Outlook
Worldwide Telecommunications Outlook
Peter Kjeldsen, Director, Gartner Research
Gartner expects the telecommunications market to decline
nearly $79 billion, or -4 percent in 2009. The market is forecast
to grow 3.2 percent in 2010, taking the total market to $1.9
trillion (see Table 4).
TaBle 4
Worldwide end-User Spending on Telecommunications
(Billions of U.S. Dollars)
007 008 009 010
Total Market 1,854 1,958 1,879 1,940
Annual Growth (%) – 5.6 -4.0 3.2
Source: Gartner (September 2009)
Consumers have replaced their mobile handsets less often, and
those who have replaced them have spent less money doing so
as more aggressively priced devices have reached the market.
Smartphones is the fastest-growing segment and is expected to
represent 15 percent of overall mobile device sales.
Consumer spending on both mobile and fixed services remains
fairly resilient to the global economic downturn. However,
average revenue per connection will continue to trend down
on a global basis in the midterm despite operator attempts to
use mobile data to offset price reductions in voice.
The enterprise network services segment is being hit by the
tight access to capital that will remain in many countries
through mid-2010. The recession is lengthening sales cycles,
and providers are being forced to offer deeper discounts in
the short term to win business.
8
11. Worldwide Telecommunications Outlook
Overall spending in the enterprise network equipment market
will be driven by changes in gross domestic product (GDP)
and employment through 2011, particularly in mature markets.
Spending on areas that promise cost savings, such as WAN
optimization and Secure Sockets Layer (SSL) virtual private
networks (VPNs), will be less influenced by changes in GDP
and employment levels.
Within the enterprise communications applications segment,
telephony is a mature market that typically grows in line
with overall economic growth. Revenue from contact center
infrastructure will recover somewhat but will lag overall
economic growth until organizations re-staff call centers up
to the capacity of their technology deployments. There will
be a shift from hardware-based desk phones to shipments
of licenses for software clients for PCs, laptops and
smartphones.
The carrier network infrastructure market is suffering a late
cyclical impact from the financial crisis, with negative growth
in 2009 and 2010. However, the long-term fundamentals
are intact and will drive a moderate rebound of the market
from 2011 to 2013. Emerging markets will continue to gain
importance throughout the forecast period.
New investments in telecom operations and management
systems (TOMS) will be primarily driven by business goals of
cost savings, revenue generation, as well as improvements in
customer experience and churn reduction. In the developed
markets, complex TOMS transformation, modernization
programs and adoption of new technologies and services will
drive growth. In emerging markets, rapid subscriber growth,
outsourcing projects and new communications service providers
(CSPs) will drive growth for basic end-to-end solutions.
9
12. Worldwide IT Services Outlook
Worldwide IT Services Outlook
Kathryn Hale, Vice President, Gartner Research
All companies must harness information to create competitive
advantage. It is no longer possible to leverage information
without technology, and both the information to be managed
and the supporting technologies are continuously becoming
more complex. Leading-edge IT implementations generally
require special expertise from external service providers.
Although many businesses are focused on improving internal
processes and reducing costs, investing in innovation does
continue. Some businesses still have the resources to invest
in IT to retain customers and gain competitive advantage;
wherever those resources exist, business management
recognizes that a downturn can be a perfect time to undertake
projects that impact future growth.
Worldwide IT services spending is on pace to total $781 billion
in 2009, a 3.5 percent decline from 2008. In 2010, worldwide
IT services spending is forecast to reach $816 billion, a 4.5
percent increase from 2009 (see Table 5).
Many contracts for more-standardized services, such as
software support, are multiyear and cannot be readily
canceled, which protects revenue in tough times. Global delivery
models allow buyers to use less-expensive labor, which
simultaneously increases demand for previously unaffordable
services while reducing spending growth rates for
standardized services that cost less than before.
10
13. Worldwide IT Services Outlook
TaBle 5
Worldwide end-User Spending on IT Services
(Billions of U.S. Dollars)
007 008 009 010
Total Market 747 809 781 816
Annual Growth (%) – 8.3 -3.5 4.5
Source: Gartner (September 2009)
Government intervention is a “wild card” in the U.S. and
Western Europe that is currently assumed to be slightly
positive. In the short term, the immediate opportunity is
for consulting outside of IT services. However, as new
government policies evolve, we expect to see long-term
opportunity for IT services deriving from new regulations and
governance structures.
Most companies are seeking to control labor costs, including IT
labor. Turning to external providers can be an immediate solution.
The effects of dampened demand for IT services are
exacerbated by intense pricing pressure, which is being met
with deals that reduce scope, move labor to lower-cost
regions, and in the case of Tier 2 providers, reduced rates
for existing labor. Overall, we expect price improvements to
lag at least a year behind any meaningful economic recovery.
11
14. Worldwide IT Spending by Region
Worldwide IT Spending by Region
Richard Gordon, Vice President, Gartner Research
All regions experienced a decline in IT spending in 2009, with
Western and Eastern Europe recording the biggest declines.
Only Japan and Middle East and Africa showed positive and
flat growth, respectively (See Table 6).
TaBle 6
Worldwide end-User Spending on IT Products and
Services by Region (Billions of U.S. Dollars)
Region 007 008 009 010
United States 929 957.2 932.1 958.3
Annual Growth (%) – 3.1 -2.6 2.8
Canada 74 77.7 71.3 74.7
Annual Growth (%) – 4.9 -8.2 4.7
Latin America 222 250.7 236.4 257.1
Annual Growth (%) – 13.0 -5.7 8.8
Western Europe 872 906.0 811.9 836.1
Annual Growth (%) – 3.9 -10.4 3.0
Eastern Europe 148 170.2 142.6 140.5
Annual Growth (%) – 14.7 -16.2 -1.5
Middle East and 192 205.7 205.7 217.1
Africa
Annual Growth (%) – 7.3 0.0 5.6
Japan 273 301.3 306.7 304.5
Annual Growth (%) – 10.4 1.8 -0.7
Asia/Pacific 472 503.6 490.9 515.6
Annual Growth (%) – 6.8 -2.5 5.0
Total 3,156.0 3,372.2 3,197.6 3,304.0
Annual Growth (%) – 6.0 -5.2 3.3
Source: Gartner (September 2009)
1
15. IT Spending Trends by Vertical Industry
The global economy is expected to begin a gradual recovery
before the end of the year. However, the timing and strength of
the recovery will still vary across regions, with Asia leading the
way, the U.S. following and Europe lagging behind. It will also
vary across industries, with consumer markets reviving first,
followed by the housing and business equipment sectors.
IT Spending Trends by Vertical Industry
John-David Lovelock, Vice President, Gartner Research
The outlook for IT spending by industry vertical markets
remains on par with overall IT spending. All segments are
on pace to decline in 2009 with agriculture, mining and
construction, financial services and transportation expected
to record the lowest growth rates (see Table 7).
Over the course of 2009, a number of factors are shaping
operational and technology priorities across the major
vertical markets. At the forefront, the continuing impact of the
economic slowdown has forced companies and governments
to reprioritize spending and shorten goals in this period of
uncertainty. Similarly, vertical market organizations needed
time to assess the impact of the American Recovery and
Reinvestment Act (ARRA) stimulus legislation and other
major government funding programs. The prospect of greater
economic stability, and possible recovery, will likely drive an
uneven pace of advancement by vertical market and usher in
new technology modernization priorities within those industries.
1
16. IT Spending Trends by Vertical Industry
TaBle 7
IT Spending by Industry Vertical Markets Worldwide
(Millions of U.S. Dollars)
Vertical 007 008 009 010
Financial 524,120 548,025 502,616 515,927
Services
Public Sector 438,829 464,288 443,368 459,969
Manufacturing 448,461 470,606 433,244 436,024
Communications 202,325 215,060 201,882 206,386
Retail 216,822 226,815 210,816 214,161
Services 171,459 182,374 172,061 175,046
Utilities 115,562 122,169 114,306 118,218
Transportation 103,522 108,565 99,842 101,711
Healthcare 79,592 85,058 79,798 82,207
Agriculture, 27,509 27,962 25,391 25,805
Mining, and
Construction
Grand Total 2,328,200 2,450,920 2,283,325 2,335,453
Source: Gartner (October 2009)
In the midst of many postponed, canceled or restructured IT
projects in financial services, new sets of priorities and strategies
will become more coherent toward the end of 2009. Movement
toward SaaS and cloud computing, shared services, and more
selective outsourcing will take firmer shape as near-term
priorities to address constrained IT budgets.
1
17. IT Spending Trends by Vertical Industry
Although federal government IT spending continues to rise,
Q409 represents the first quarter of government fiscal 2010.
Historically, this represents the second-most-active quarter
of government spending, and this will likely continue this
year. Major focus on civil side requirements and emerging
cybersecurity requirements will drive spending.
In the communications sector, next generation networks
and mobile broadband initiatives in Long Term Evolution and
WiMAX investment will continue as telecom carriers continue
to ramp up fourth-generation, high-speed wireless data access
services, albeit at a subdued pace. Other areas of spending
include BPM, data management, and efforts to increase and
deliver enterprise managed services on IP networks.
The ARRA stimulus dollars focused on the healthcare market
have had an undesired effect on the market as a whole. Many
care delivery organizations (CDOs) have put new projects on
hold, partly due to cash-flow concerns and partly to ensure
that new initiatives will meet meaningful use guidelines yet to
be published. Selective thawing in frozen IT budgets will occur
by Q409. However, executive pressure on operational budgets
and a concentrated focus on cash-flow optimization strategies
will remain the norm through the remainder of 2009, with some
growth returning to healthcare IT spending in 2010.
1
18. IT Metrics: IT Staffing Levels for 010
IT Metrics: IT Staffing levels for 2010
Kurt Potter, Director, Gartner Research
Because of the worldwide economic recession, many
organizations have already cycled through various IT staffing
changes that were defensive in nature, often short-sighted
and aligned with an IT strategic plan that was misaligned to the
realities of recession. Often, IT staffing changes were off plan
and related to overreaction to the panic that occurred during
the depths of this recession.
Since many enterprises choose January 1 as the beginning of
their financial fiscal year, July 1 often heralds the official start
of the six-month IT budget cycle in preparation for 2010 IT
strategic plans. During this annual planning process, many
IT leaders will have to live with the shortcomings of previous IT
staffing decisions and take corrective action to prepare for the
return to growth.
Although IT staffing-level planning for 2010 should be far
different from the IT staff actions that organizations have taken
so far in this recession, it is necessary to put into perspective
the typical levels of cuts and increases that enterprises have
experienced in 2008 and 2009.
We polled 185 decision makers about changes in IT staff
due to this economic recession. As shown in Table 8, when
we asked, “What is the current impact on your IT workforce
(internal FTEs and contract labor) due to this economic
recession?” we discovered that the survey showed only 8.1
percent of organizations increased their head count during this
recession, with only 0.5 percent stating that they increased
head count more than 15 percent. Conversely, 91.9 percent
either claimed declining or flat IT staffing levels, with 62.7
percent stating they showed reduced IT staffing levels. The
largest response category was 50.3 percent stating they cut
IT head count by between 1 percent and 15 percent over
previous levels (see Table 8).
1
19. IT Metrics: IT Staffing Levels for 010
TaBle 8
Impact on IT Workforce Due to This economic
Recession
IT Staff Change Opinions Percent of
Respondents
Cutting IT head count by 1% to 1% 50.3
Cutting IT head count by more than 1% 12.4
Increasing IT head count by 1% to 1% 7.6
Increasing IT head count by more than 1% 0.5
No head count increase or decrease 29.2
Source: Gartner (June and July 2009)
The severity of this recession may cause a long-term and
organic increase in the size of the contract labor workforce
in many organizations and result in a permanent decrease in
the percentage of their workforce that are internal full-time
equivalents (FTEs), which now stands at 77 percent. This is
due mostly to continuation of caps on new headcount hiring
that is compensated for with use of contract labor.
At an average of 36 percent, IT personnel salaries and benefits
tend to be the largest line item for IT spending. Due to the
recession, those organizations that have policies of preserving
staff will show levels as high as 75 percent when combined
with rapid declines in other IT budget categories. In knowledge
worker-intense industries like professional services, the
percentage devoted to IT personnel salaries and benefits will
tend to be higher than the norm, even in a recession.
CIOs and other IT leaders must consider many other market
trends and assumptions during the next six months during
the IT planning cycle for 2010. Since each industry has its
own dynamics, and comparison of metrics is often more art
and politics than a true science, IT leaders should be prudent
in how they apply these trends to their planning, and even
disregard those trends that do not apply to them.
17
20. CIO Agenda 010
CIO agenda 2010
Mark McDonald, Group Vice President and Head of
Research, Gartner Executive Programs
Leading in 2009 was relatively simple as economic conditions
headed in one direction. Now CIOs face an array of business,
operational, technical and strategic challenges in 2010 as
conditions may or may not improve. 88% of enterprises
reported reducing the IT budget during 2009. Even with strong
increased revenue in 2010, CIOs will face the future with
essentially the same resource levels they had in 2006 or 2007.
CIOs report that unlike past recessions, they are being pulled
in two directions at once. The business needs cost savings
to protect financial results—yet it also needs new solutions to
retain current and attract new customers.
Cost reduction challenges reflect the enterprise’s overall need
to better match resources to revenues. Declining revenues,
in some cases by more than 30%, require adjusting every
resource in the company—including IT.
Value creation, particularly of the type created by IT, is actually
increasing in this environment for several reasons. First, the
business will often turn to IT solutions to help reduce its own
cost structure. Second, revenue pressures place a premium
on delivering new features to retain current customers and
grow market share. Finally, information technologies such as
Web 2.0 and analytics continue to make their way into the
business, requiring new IT capabilities.
The need to improve business performance is changing the
shape of business demand for IT to demonstrate its value.
Traditional IT measures and metrics related to IT operational
performance and cost are increasingly less effective.
Executives want to see business impact measures in one or
more of these areas.
18
21. CIO Agenda 010
CIOs should reassess their metrics and scorecards and look to
connect their IT operations and solutions to positive changes
in these areas.
The 2009 CIO Agenda, based on a worldwide survey of 1,527
CIOs, was conducted by Gartner Executive Programs in
late 2008 and represents CIO budget plans reported at that
time. Flat IT budgets were found across enterprises in North
America and Europe, with slight increases in Latin America
and a slight decrease in Asia/Pacific. The CIOs surveyed
represent more than $138 billion in corporate and public
sector IT spending, encompassing 1,527 enterprises across
48 countries and 30 industries.
The survey showed that senior enterprise executives recognize
that IT’s contribution to economic performance extends
beyond managing expenditures. They expect IT to play a role
in reducing enterprise costs, not merely with cost cutting but
by changing business processes, workforce practices and
information use. The business priorities in Table 9 reflect
these expectations.
TaBle 9
Top 10 Business and Technology Priorities in 2009
Top 10 Business Priorities Ranking
Business process improvement 1
Reducing enterprise costs 2
Improving enterprise workforce effectiveness 3
Attracting and retaining new customers 4
Increasing the use of information/analytics 5
Creating new products or services (innovation) 6
Targeting customers and markets more effectively 7
Managing change initiatives 8
Expanding current customer relationships 9
Expanding into new markets and geographies 10
19
22. CIO Agenda 010
TaBle 9 (contined)
Top 10 Business and Technology Priorities in 2009
Top 10 Technology Priorities Ranking
Business intelligence 1
Enterprise applications (ERP, CRM and others) 2
Servers and storage technologies (virtualization) 3
Legacy application modernization 4
Collaboration technologies 5
Networking, voice and data communications 6
Technical infrastructure 7
Security technologies 8
Service-oriented applications and architecture 9
Document management 10
Source: Gartner Executive Programs (January 2009)
Note: 2010 CIO Agenda survey results to be published in January 2010
Meeting the challenges of 2010 will require CIOs to make
harder decisions that impact more than just the IT organization.
They will need to lead these resources to create results that
go beyond their own productive capacity.
The combination of an efficient and responsive IT resource base
gives the CIO the ability and capacity to focus on the enterprise,
its customers and offerings. This comes in the form of driving
sustained financial and operational improvements as well as
focused market-based innovation.
0
23. How Will the Recovery
Impact Your IT Spend
in 2010?
Get the integrated perspective only Gartner
can provide!
Find out how you can gain access to our
in-depth data reports as well as objective,
actionable insight to help drive the success of
your key initiatives. Visit gartner.com/economy
or e-mail thoughtleadership@gartner.com.
Please note: the market is volatile and Gartner is constantly
evaluating the latest market conditions. Many of these statistics
are updated quarterly, so we encourage you to check back with
Gartner each quarter for the latest research and analysis.