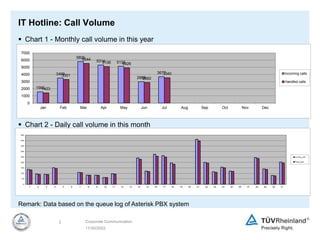
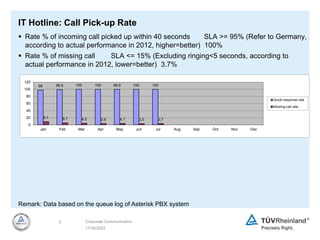
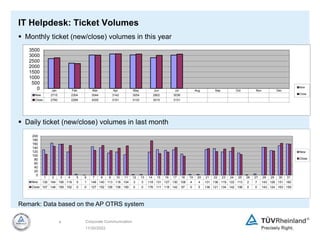
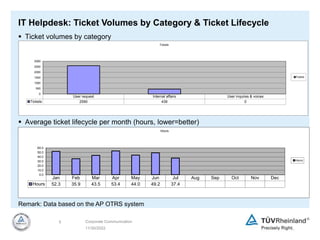
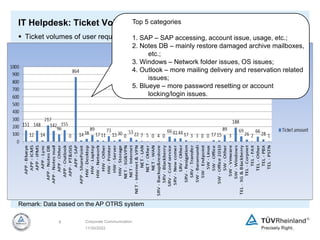
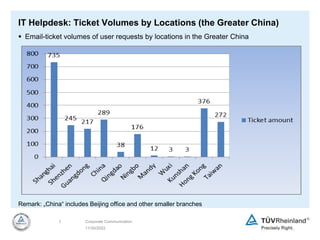
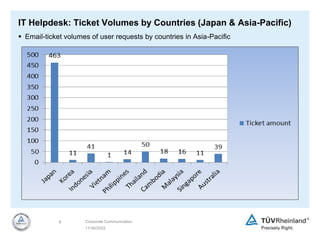
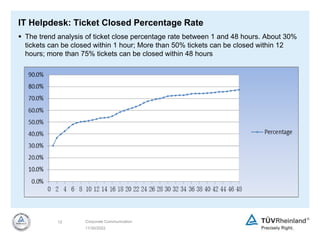
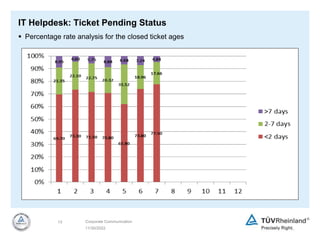
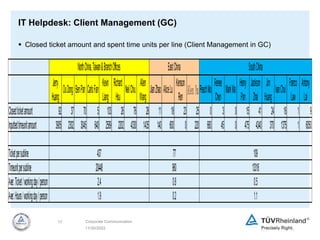
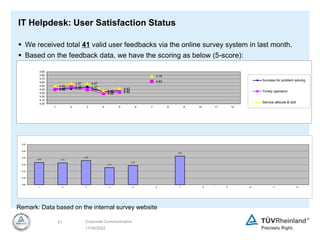
IT Helpdesk / Hotline Report
Asia Pacific
2014.07
Created by
11/30/2022
2 Corporate Communication
IT Hotline: Call Volume
 Chart 1 - Monthly call volume in this year
 Chart 2 - Daily call volume in this month
1565
3499
5805
5314 5139
2988
3677
1423
3301
5544
5106 4926
2882
3540
0
1000
2000
3000
4000
5000
6000
7000
Jan Feb Mar Apr May Jun Jul Aug Sep Oct Nov Dec
Incoming calls
Handled calls
Remark: Data based on the queue log of Asterisk PBX system
0
50
100
150
200
250
300
350
400
450
1 2 3 4 5 6 7 8 9 10 11 12 13 14 15 16 17 18 19 20 21 22 23 24 25 26 27 28 29 30 31
Incoming_calls
Pickup_calls
11/30/2022
3 Corporate Communication
IT Hotline: Call Pick-up Rate
 Rate % of incoming call picked up within 40 seconds SLA >= 95% (Refer to Germany,
according to actual performance in 2012, higher=better) 100%
 Rate % of missing call SLA <= 15% (Excluding ringing<5 seconds, according to
actual performance in 2012, lower=better) 3.7%
Remark: Data based on the queue log of Asterisk PBX system
98 99.5 100 100 99.9 100 100
9.1 5.7 4.5 3.9 4.1 3.5 3.7
0
20
40
60
80
100
120
Jan Feb Mar Apr May Jun Jul Aug Sep Oct Nov Dec
Quick-response rate
Missing-call rate
11/30/2022
4 Corporate Communication
IT Helpdesk: Ticket Volumes
 Monthly ticket (new/close) volumes in this year
 Daily ticket (new/close) volumes in last month
1 2 3 4 5 6 7 8 9 10 11 12 13 14 15 16 17 18 19 20 21 22 23 24 25 26 27 28 29 30 31
New 130 164 158 119 5 1 146 140 113 118 104 3 3 118 131 127 130 108 4 4 131 136 119 122 113 2 7 143 126 151 160
Close 107 148 159 152 0 0 127 152 126 138 150 0 0 176 111 118 142 97 0 0 136 121 134 142 106 0 0 143 124 163 159
0
20
40
60
80
100
120
140
160
180
200
New
Close
Remark: Data based on the AP OTRS system
Jan Feb Mar Apr May Jun Jul Aug Sep Oct Nov Dec
New 2715 2304 3044 3142 3054 2802 3036
Close 2792 2269 3035 3151 3133 3015 3131
0
500
1000
1500
2000
2500
3000
3500
New
Close
11/30/2022
5 Corporate Communication
IT Helpdesk: Ticket Volumes by Category & Ticket Lifecycle
 Ticket volumes by category
 Average ticket lifecycle per month (hours, lower=better)
User request Internal affairs User inquires & voices
Tickets 2590 439 0
0
500
1000
1500
2000
2500
3000
Tickets
Tickets
Jan Feb Mar Apr May Jun Jul Aug Sep Oct Nov Dec
Hours 52.3 35.9 43.5 53.4 44.0 49.2 37.4
0.0
10.0
20.0
30.0
40.0
50.0
60.0
Hours
Hours
Remark: Data based on the AP OTRS system
11/30/2022
6 Corporate Communication
IT Helpdesk: Ticket Volumes by Category
 Ticket volumes of user requests by category
Remark: Data based on the AP OTRS system
Top 5 categories
1. SAP – SAP accessing, account issue, usage, etc.;
2. Notes DB – mainly restore damaged archive mailboxes,
etc.;
3. Windows – Network folder issues, OS issues;
4. Outlook – more mailing delivery and reservation related
issues;
5. Blueye – more password resetting or account
locking/login issues.
11/30/2022
7 Corporate Communication
IT Helpdesk: Ticket Volumes by Locations (the Greater China)
 Email-ticket volumes of user requests by locations in the Greater China
Remark: „China“ includes Beijing office and other smaller branches
11/30/2022
8 Corporate Communication
IT Helpdesk: Ticket Volumes by Countries (Japan & Asia-Pacific)
 Email-ticket volumes of user requests by countries in Asia-Pacific
11/30/2022
9 Corporate Communication
IT Helpdesk: Ticket Status
 Ticket volumes by creation types
 % of ticket by hotline per month in this year. (higher=better, 40%, refer to the DE
hotline)
Email Hotline staffs ClientManagement staffs and others
Tickets 2561 31 444
0
500
1000
1500
2000
2500
3000
Tickets
Tickets
Remark: Data based on the AP OTRS system
Jan Feb Mar Apr May Jun Jul Aug Sep Oct Nov Dec
% rate 23% 24% 26% 21% 20% 21% 24%
0%
5%
10%
15%
20%
25%
30%
35%
40%
45%
50%
% rate
% rate
IT Helpdesk: Closed Ticket Amount per Teams
 Closed ticket amounts per IT teams
11/30/2022
10 Corporate Communication
IT Helpdesk: Closed Ticket Amount per Queues/IT staffs
Please check the details with opening the embedded Excel sheet for:
 Closed ticket amount in each queue;
 Closed ticket amount per each IT staff;
 Inputted time units per each IT staff
11/30/2022
11 Corporate Communication
Remark: Time unit amount is self-inputted unforcedly by IT staff when handling each ticket. And it can
partly reflect to the workload and average spent time for each ticket
IT Helpdesk: Ticket Closed Percentage Rate
 The trend analysis of ticket close percentage rate between 1 and 48 hours. About 30%
tickets can be closed within 1 hour; More than 50% tickets can be closed within 12
hours; more than 75% tickets can be closed within 48 hours
11/30/2022
12 Corporate Communication
IT Helpdesk: Ticket Pending Status
 Percentage rate analysis for the closed ticket ages
11/30/2022
13 Corporate Communication
11/30/2022
14 Corporate Communication
IT Helpdesk: Time Unit Status
 Ticket volumes with time unit (minutes) records by IT staffs (Top 20)
11/30/2022
15 Corporate Communication
IT Helpdesk: Time Unit Status
 Spent time units (minutes) per ticket by IT staffs (Top 20)
11/30/2022
16 Corporate Communication
IT Helpdesk: Customer Service
 Closed ticket amount and spent time units per line (Hotline, Application Support & Identity
Administration)
Sky
Huang
ViolaRen
Danny
Cao
Billie
Kong
Johnny
Min
Jane
Song
Smile
Shen
LeleLi SuriNi
Wendy
Hu
Hiroe
Sakai
Melanie
Chen
Fabio
Cheng
Closedticketamount 225 0 144 200 167 160 138 510 57 129 11 62 51
Inputtedtimeunitamount 2532 0 1404 3322 0 904 3415 3407 4195 2464 10 1580 1943
Ticketpersubline
Timeunitpersubline
Aver.Ticket/workingday/person
Aver.Hours/workingday/person
6.1
17918
ApplicationSupport(Incl.Identity&DominoAdministration)
1.1
Hotline
736
7258
6.4
1.6
1118
11/30/2022
17 Corporate Communication
IT Helpdesk: Client Management (GC)
 Closed ticket amount and spent time units per line (Client Management in GC)
Jerry
Huang
OuDong BenPan CarloFan
Kevin
Liang
Richard
Hsu
NeilChiu
Allen
Wang
JianZhao AliceLu
Kenson
Ren
AlexYuPeachMo
Renee
Chen
MarkMa
Henry
Pan
Jackson
Zhai
Jim
Huang
IvanChui
Franco
Law
Antony
Lai
Closedticketamount 92 37 70 5 103 26 76 28 11 18 23 25 0 3 0 15 41 24 16 1 9
Inputtedtimeunitamount 3905 2302 3045 640 2589 2202 4330 1435 140 600 0 220 660 45 0 475 4340 370 1375 1 6050
Ticketpersubline
Timeunitpersubline
Aver.Ticket/workingday/person
Aver.Hours/workingday/person 1.9 0.2 1.1
20448 960 13316
2.4 0.8 0.5
437 77
NorthChina,Taiwan&BranchOffices EastChina SouthChina
109
11/30/2022
18 Corporate Communication
IT Helpdesk: Client Management (Japan & AP)
 Closed ticket amount and spent time units per line (Client Management in Japan and
other AP offices)
Hitomi
Maeda
Hiroko
Nakamura
Hiroshi
Ito
Tomoko
Moriyama
JungIk
Cho
Riono
Ariestanto
AnLe
Vinh
Nguyen
Thao
Truong
Pairat
Udommongc
olkit
Chandara
Chor
Christopher
Adlawan
Raymond
Chia
Jim
Tzepin
Closedticketamount 50 90 10 27 1 1 1 0 0 0 4 0 0 0
Inputtedtimeunitamount 425 2550 0 0 0 60 60 0 0 0 490 966 0 0
Korea Indonesia Thailand Cambodia Philippines Singapore Malaysia
Ticketpersubline 1 1 0 4 0 0 0
Timeunitpersubline 0 60 0 490 966 0 0
Aver.Ticket/workingday/person 0.0 0.0 0.0 0.2 0.0 0.0 0.0
Aver.Hours/workingday/person 0.0 0.0 0.0 0.4 0.7 0.0 0.0
0.5 0.0
2975 60
1.9 0.0
Vietnam
Japan Asia-Pacific
177 1
11/30/2022
19 Corporate Communication
IT Helpdesk: Service Center Technology
 Closed ticket amount and spent time units per line (Service Center Technology)
WavesShi
HaoPing
Qian
Yoshikazu
Nakamura
ICIp
Henry
Ng
Percy
Pan
Oliver
Gao
Yunjie
Xie
Kenneth
Fong
EricLin
Alan
Mizrahi
Prince
Wang
Patrick
Yeung
Closedticketamount 14 11 22 0 40 23 12 11 15 17 9 0 4
Inputtedtimeunitamount 0 0 624 0 0 0 0 0 200 530 0 0 0
Ticketpersubline
Timeunitpersubline
Aver.Ticket/workingday/person
Aver.Hours/workingday/person 0.1
0.9
0.2
0.7
0.0
46
0
Infrastructure
62
624
0.4
0.0
45
730
Network
25
0
0.5
DataCenter Telecommunication
11/30/2022
20 Corporate Communication
IT Helpdesk: Application Development
 Closed ticket amount and spent time units per line (Application Development)
Simon
Benkert
Fiona
Chu
Joyce
Lin
Rain
Wang
Nancy
Wei
Simon
Zhong
Gilbert
Hsu
Kimmy
Mo
Closed ticket amount 1 0 2 4 1 1 0 0
Inputted timeunit amount 0 0 0 0 0 0 0 0
Ticket per subline
Timeunit per subline
Aver. Ticket / working day / person
Aver. Hours / working day / person
0
0
SAP Non-SAP
0.1
0.0
0.0
0.0
9
0
11/30/2022
21 Corporate Communication
IT Helpdesk: User Satisfaction Status
 We received total 41 valid user feedbacks via the online survey system in last month.
 Based on the feedback data, we have the scoring as below (5-score):
Remark: Data based on the internal survey website
4.42 4.43 4.47
4.34 4.37
4.63
4.40
4.48
4.40
4.29 4.33
4.63
4.50
4.57 4.57
4.37
4.43
4.78
4.00
4.10
4.20
4.30
4.40
4.50
4.60
4.70
4.80
4.90
1 2 3 4 5 6 7 8 9 10 11 12
Success for problem solving
Timely operation
Service attitude & skill
4.46 4.45
4.52
4.31
4.37
4.65
3.80
4.00
4.20
4.40
4.60
4.80
5.00
1 2 3 4 5 6 7 8 9 10 11 12
11/30/2022
22 Corporate Communication
IT Helpdesk: Special Cases & User Voices
 July: conference room and other resources’ reservation function started to switch from
Notes to Outlook. For Shg office, there would be some reservation conflicts before the
actual day on Aug. 1. Before this day local administrator has to monitor the status and
keep informing to the related users. The migration works were also announced and
kicked off in TW, HK & SZ;
 July 25: there were a few users (about 10 or more) meeting the problem of pop-up user
authentication window when using Office software. It was caused by the internal
translation function with on-line dictionary checking. Hotline and Client Management
don’t know the root cause and keep monitoring the issue now.
Remark: for IT management internal reference only
11/30/2022
23 Corporate Communication
IT Helpdesk: Other Internal Affairs
 The contents and structure of Blueye pages for GC IT was updated;
 Yue Dong/Carlo Fan provided updated training of PC software standard to
Client Management and Hotline at the middle of July;
 IT Dialog is planned to be held in HK/SH/BJ/TP/SZ in Aug. & Sep., and the
preparation works are on going.
Remark: for IT management internal reference only

IT Helpdesk Monthly Report 2014-07.pptx

  • 1.
    IT Helpdesk /Hotline Report Asia Pacific 2014.07 Created by
  • 2.
    11/30/2022 2 Corporate Communication ITHotline: Call Volume  Chart 1 - Monthly call volume in this year  Chart 2 - Daily call volume in this month 1565 3499 5805 5314 5139 2988 3677 1423 3301 5544 5106 4926 2882 3540 0 1000 2000 3000 4000 5000 6000 7000 Jan Feb Mar Apr May Jun Jul Aug Sep Oct Nov Dec Incoming calls Handled calls Remark: Data based on the queue log of Asterisk PBX system 0 50 100 150 200 250 300 350 400 450 1 2 3 4 5 6 7 8 9 10 11 12 13 14 15 16 17 18 19 20 21 22 23 24 25 26 27 28 29 30 31 Incoming_calls Pickup_calls
  • 3.
    11/30/2022 3 Corporate Communication ITHotline: Call Pick-up Rate  Rate % of incoming call picked up within 40 seconds SLA >= 95% (Refer to Germany, according to actual performance in 2012, higher=better) 100%  Rate % of missing call SLA <= 15% (Excluding ringing<5 seconds, according to actual performance in 2012, lower=better) 3.7% Remark: Data based on the queue log of Asterisk PBX system 98 99.5 100 100 99.9 100 100 9.1 5.7 4.5 3.9 4.1 3.5 3.7 0 20 40 60 80 100 120 Jan Feb Mar Apr May Jun Jul Aug Sep Oct Nov Dec Quick-response rate Missing-call rate
  • 4.
    11/30/2022 4 Corporate Communication ITHelpdesk: Ticket Volumes  Monthly ticket (new/close) volumes in this year  Daily ticket (new/close) volumes in last month 1 2 3 4 5 6 7 8 9 10 11 12 13 14 15 16 17 18 19 20 21 22 23 24 25 26 27 28 29 30 31 New 130 164 158 119 5 1 146 140 113 118 104 3 3 118 131 127 130 108 4 4 131 136 119 122 113 2 7 143 126 151 160 Close 107 148 159 152 0 0 127 152 126 138 150 0 0 176 111 118 142 97 0 0 136 121 134 142 106 0 0 143 124 163 159 0 20 40 60 80 100 120 140 160 180 200 New Close Remark: Data based on the AP OTRS system Jan Feb Mar Apr May Jun Jul Aug Sep Oct Nov Dec New 2715 2304 3044 3142 3054 2802 3036 Close 2792 2269 3035 3151 3133 3015 3131 0 500 1000 1500 2000 2500 3000 3500 New Close
  • 5.
    11/30/2022 5 Corporate Communication ITHelpdesk: Ticket Volumes by Category & Ticket Lifecycle  Ticket volumes by category  Average ticket lifecycle per month (hours, lower=better) User request Internal affairs User inquires & voices Tickets 2590 439 0 0 500 1000 1500 2000 2500 3000 Tickets Tickets Jan Feb Mar Apr May Jun Jul Aug Sep Oct Nov Dec Hours 52.3 35.9 43.5 53.4 44.0 49.2 37.4 0.0 10.0 20.0 30.0 40.0 50.0 60.0 Hours Hours Remark: Data based on the AP OTRS system
  • 6.
    11/30/2022 6 Corporate Communication ITHelpdesk: Ticket Volumes by Category  Ticket volumes of user requests by category Remark: Data based on the AP OTRS system Top 5 categories 1. SAP – SAP accessing, account issue, usage, etc.; 2. Notes DB – mainly restore damaged archive mailboxes, etc.; 3. Windows – Network folder issues, OS issues; 4. Outlook – more mailing delivery and reservation related issues; 5. Blueye – more password resetting or account locking/login issues.
  • 7.
    11/30/2022 7 Corporate Communication ITHelpdesk: Ticket Volumes by Locations (the Greater China)  Email-ticket volumes of user requests by locations in the Greater China Remark: „China“ includes Beijing office and other smaller branches
  • 8.
    11/30/2022 8 Corporate Communication ITHelpdesk: Ticket Volumes by Countries (Japan & Asia-Pacific)  Email-ticket volumes of user requests by countries in Asia-Pacific
  • 9.
    11/30/2022 9 Corporate Communication ITHelpdesk: Ticket Status  Ticket volumes by creation types  % of ticket by hotline per month in this year. (higher=better, 40%, refer to the DE hotline) Email Hotline staffs ClientManagement staffs and others Tickets 2561 31 444 0 500 1000 1500 2000 2500 3000 Tickets Tickets Remark: Data based on the AP OTRS system Jan Feb Mar Apr May Jun Jul Aug Sep Oct Nov Dec % rate 23% 24% 26% 21% 20% 21% 24% 0% 5% 10% 15% 20% 25% 30% 35% 40% 45% 50% % rate % rate
  • 10.
    IT Helpdesk: ClosedTicket Amount per Teams  Closed ticket amounts per IT teams 11/30/2022 10 Corporate Communication
  • 11.
    IT Helpdesk: ClosedTicket Amount per Queues/IT staffs Please check the details with opening the embedded Excel sheet for:  Closed ticket amount in each queue;  Closed ticket amount per each IT staff;  Inputted time units per each IT staff 11/30/2022 11 Corporate Communication Remark: Time unit amount is self-inputted unforcedly by IT staff when handling each ticket. And it can partly reflect to the workload and average spent time for each ticket
  • 12.
    IT Helpdesk: TicketClosed Percentage Rate  The trend analysis of ticket close percentage rate between 1 and 48 hours. About 30% tickets can be closed within 1 hour; More than 50% tickets can be closed within 12 hours; more than 75% tickets can be closed within 48 hours 11/30/2022 12 Corporate Communication
  • 13.
    IT Helpdesk: TicketPending Status  Percentage rate analysis for the closed ticket ages 11/30/2022 13 Corporate Communication
  • 14.
    11/30/2022 14 Corporate Communication ITHelpdesk: Time Unit Status  Ticket volumes with time unit (minutes) records by IT staffs (Top 20)
  • 15.
    11/30/2022 15 Corporate Communication ITHelpdesk: Time Unit Status  Spent time units (minutes) per ticket by IT staffs (Top 20)
  • 16.
    11/30/2022 16 Corporate Communication ITHelpdesk: Customer Service  Closed ticket amount and spent time units per line (Hotline, Application Support & Identity Administration) Sky Huang ViolaRen Danny Cao Billie Kong Johnny Min Jane Song Smile Shen LeleLi SuriNi Wendy Hu Hiroe Sakai Melanie Chen Fabio Cheng Closedticketamount 225 0 144 200 167 160 138 510 57 129 11 62 51 Inputtedtimeunitamount 2532 0 1404 3322 0 904 3415 3407 4195 2464 10 1580 1943 Ticketpersubline Timeunitpersubline Aver.Ticket/workingday/person Aver.Hours/workingday/person 6.1 17918 ApplicationSupport(Incl.Identity&DominoAdministration) 1.1 Hotline 736 7258 6.4 1.6 1118
  • 17.
    11/30/2022 17 Corporate Communication ITHelpdesk: Client Management (GC)  Closed ticket amount and spent time units per line (Client Management in GC) Jerry Huang OuDong BenPan CarloFan Kevin Liang Richard Hsu NeilChiu Allen Wang JianZhao AliceLu Kenson Ren AlexYuPeachMo Renee Chen MarkMa Henry Pan Jackson Zhai Jim Huang IvanChui Franco Law Antony Lai Closedticketamount 92 37 70 5 103 26 76 28 11 18 23 25 0 3 0 15 41 24 16 1 9 Inputtedtimeunitamount 3905 2302 3045 640 2589 2202 4330 1435 140 600 0 220 660 45 0 475 4340 370 1375 1 6050 Ticketpersubline Timeunitpersubline Aver.Ticket/workingday/person Aver.Hours/workingday/person 1.9 0.2 1.1 20448 960 13316 2.4 0.8 0.5 437 77 NorthChina,Taiwan&BranchOffices EastChina SouthChina 109
  • 18.
    11/30/2022 18 Corporate Communication ITHelpdesk: Client Management (Japan & AP)  Closed ticket amount and spent time units per line (Client Management in Japan and other AP offices) Hitomi Maeda Hiroko Nakamura Hiroshi Ito Tomoko Moriyama JungIk Cho Riono Ariestanto AnLe Vinh Nguyen Thao Truong Pairat Udommongc olkit Chandara Chor Christopher Adlawan Raymond Chia Jim Tzepin Closedticketamount 50 90 10 27 1 1 1 0 0 0 4 0 0 0 Inputtedtimeunitamount 425 2550 0 0 0 60 60 0 0 0 490 966 0 0 Korea Indonesia Thailand Cambodia Philippines Singapore Malaysia Ticketpersubline 1 1 0 4 0 0 0 Timeunitpersubline 0 60 0 490 966 0 0 Aver.Ticket/workingday/person 0.0 0.0 0.0 0.2 0.0 0.0 0.0 Aver.Hours/workingday/person 0.0 0.0 0.0 0.4 0.7 0.0 0.0 0.5 0.0 2975 60 1.9 0.0 Vietnam Japan Asia-Pacific 177 1
  • 19.
    11/30/2022 19 Corporate Communication ITHelpdesk: Service Center Technology  Closed ticket amount and spent time units per line (Service Center Technology) WavesShi HaoPing Qian Yoshikazu Nakamura ICIp Henry Ng Percy Pan Oliver Gao Yunjie Xie Kenneth Fong EricLin Alan Mizrahi Prince Wang Patrick Yeung Closedticketamount 14 11 22 0 40 23 12 11 15 17 9 0 4 Inputtedtimeunitamount 0 0 624 0 0 0 0 0 200 530 0 0 0 Ticketpersubline Timeunitpersubline Aver.Ticket/workingday/person Aver.Hours/workingday/person 0.1 0.9 0.2 0.7 0.0 46 0 Infrastructure 62 624 0.4 0.0 45 730 Network 25 0 0.5 DataCenter Telecommunication
  • 20.
    11/30/2022 20 Corporate Communication ITHelpdesk: Application Development  Closed ticket amount and spent time units per line (Application Development) Simon Benkert Fiona Chu Joyce Lin Rain Wang Nancy Wei Simon Zhong Gilbert Hsu Kimmy Mo Closed ticket amount 1 0 2 4 1 1 0 0 Inputted timeunit amount 0 0 0 0 0 0 0 0 Ticket per subline Timeunit per subline Aver. Ticket / working day / person Aver. Hours / working day / person 0 0 SAP Non-SAP 0.1 0.0 0.0 0.0 9 0
  • 21.
    11/30/2022 21 Corporate Communication ITHelpdesk: User Satisfaction Status  We received total 41 valid user feedbacks via the online survey system in last month.  Based on the feedback data, we have the scoring as below (5-score): Remark: Data based on the internal survey website 4.42 4.43 4.47 4.34 4.37 4.63 4.40 4.48 4.40 4.29 4.33 4.63 4.50 4.57 4.57 4.37 4.43 4.78 4.00 4.10 4.20 4.30 4.40 4.50 4.60 4.70 4.80 4.90 1 2 3 4 5 6 7 8 9 10 11 12 Success for problem solving Timely operation Service attitude & skill 4.46 4.45 4.52 4.31 4.37 4.65 3.80 4.00 4.20 4.40 4.60 4.80 5.00 1 2 3 4 5 6 7 8 9 10 11 12
  • 22.
    11/30/2022 22 Corporate Communication ITHelpdesk: Special Cases & User Voices  July: conference room and other resources’ reservation function started to switch from Notes to Outlook. For Shg office, there would be some reservation conflicts before the actual day on Aug. 1. Before this day local administrator has to monitor the status and keep informing to the related users. The migration works were also announced and kicked off in TW, HK & SZ;  July 25: there were a few users (about 10 or more) meeting the problem of pop-up user authentication window when using Office software. It was caused by the internal translation function with on-line dictionary checking. Hotline and Client Management don’t know the root cause and keep monitoring the issue now. Remark: for IT management internal reference only
  • 23.
    11/30/2022 23 Corporate Communication ITHelpdesk: Other Internal Affairs  The contents and structure of Blueye pages for GC IT was updated;  Yue Dong/Carlo Fan provided updated training of PC software standard to Client Management and Hotline at the middle of July;  IT Dialog is planned to be held in HK/SH/BJ/TP/SZ in Aug. & Sep., and the preparation works are on going. Remark: for IT management internal reference only