Download free for 30 days
Sign in
Upload
Language (EN)
Support
Business
Mobile
Social Media
Marketing
Technology
Art & Photos
Career
Design
Education
Presentations & Public Speaking
Government & Nonprofit
Healthcare
Internet
Law
Leadership & Management
Automotive
Engineering
Software
Recruiting & HR
Retail
Sales
Services
Science
Small Business & Entrepreneurship
Food
Environment
Economy & Finance
Data & Analytics
Investor Relations
Sports
Spiritual
News & Politics
Travel
Self Improvement
Real Estate
Entertainment & Humor
Health & Medicine
Devices & Hardware
Lifestyle
Change Language
Language
English
Español
Português
Français
Deutsche
Cancel
Save
Submit search
EN
Uploaded by
Mohd Mujahid Nasir
506 views
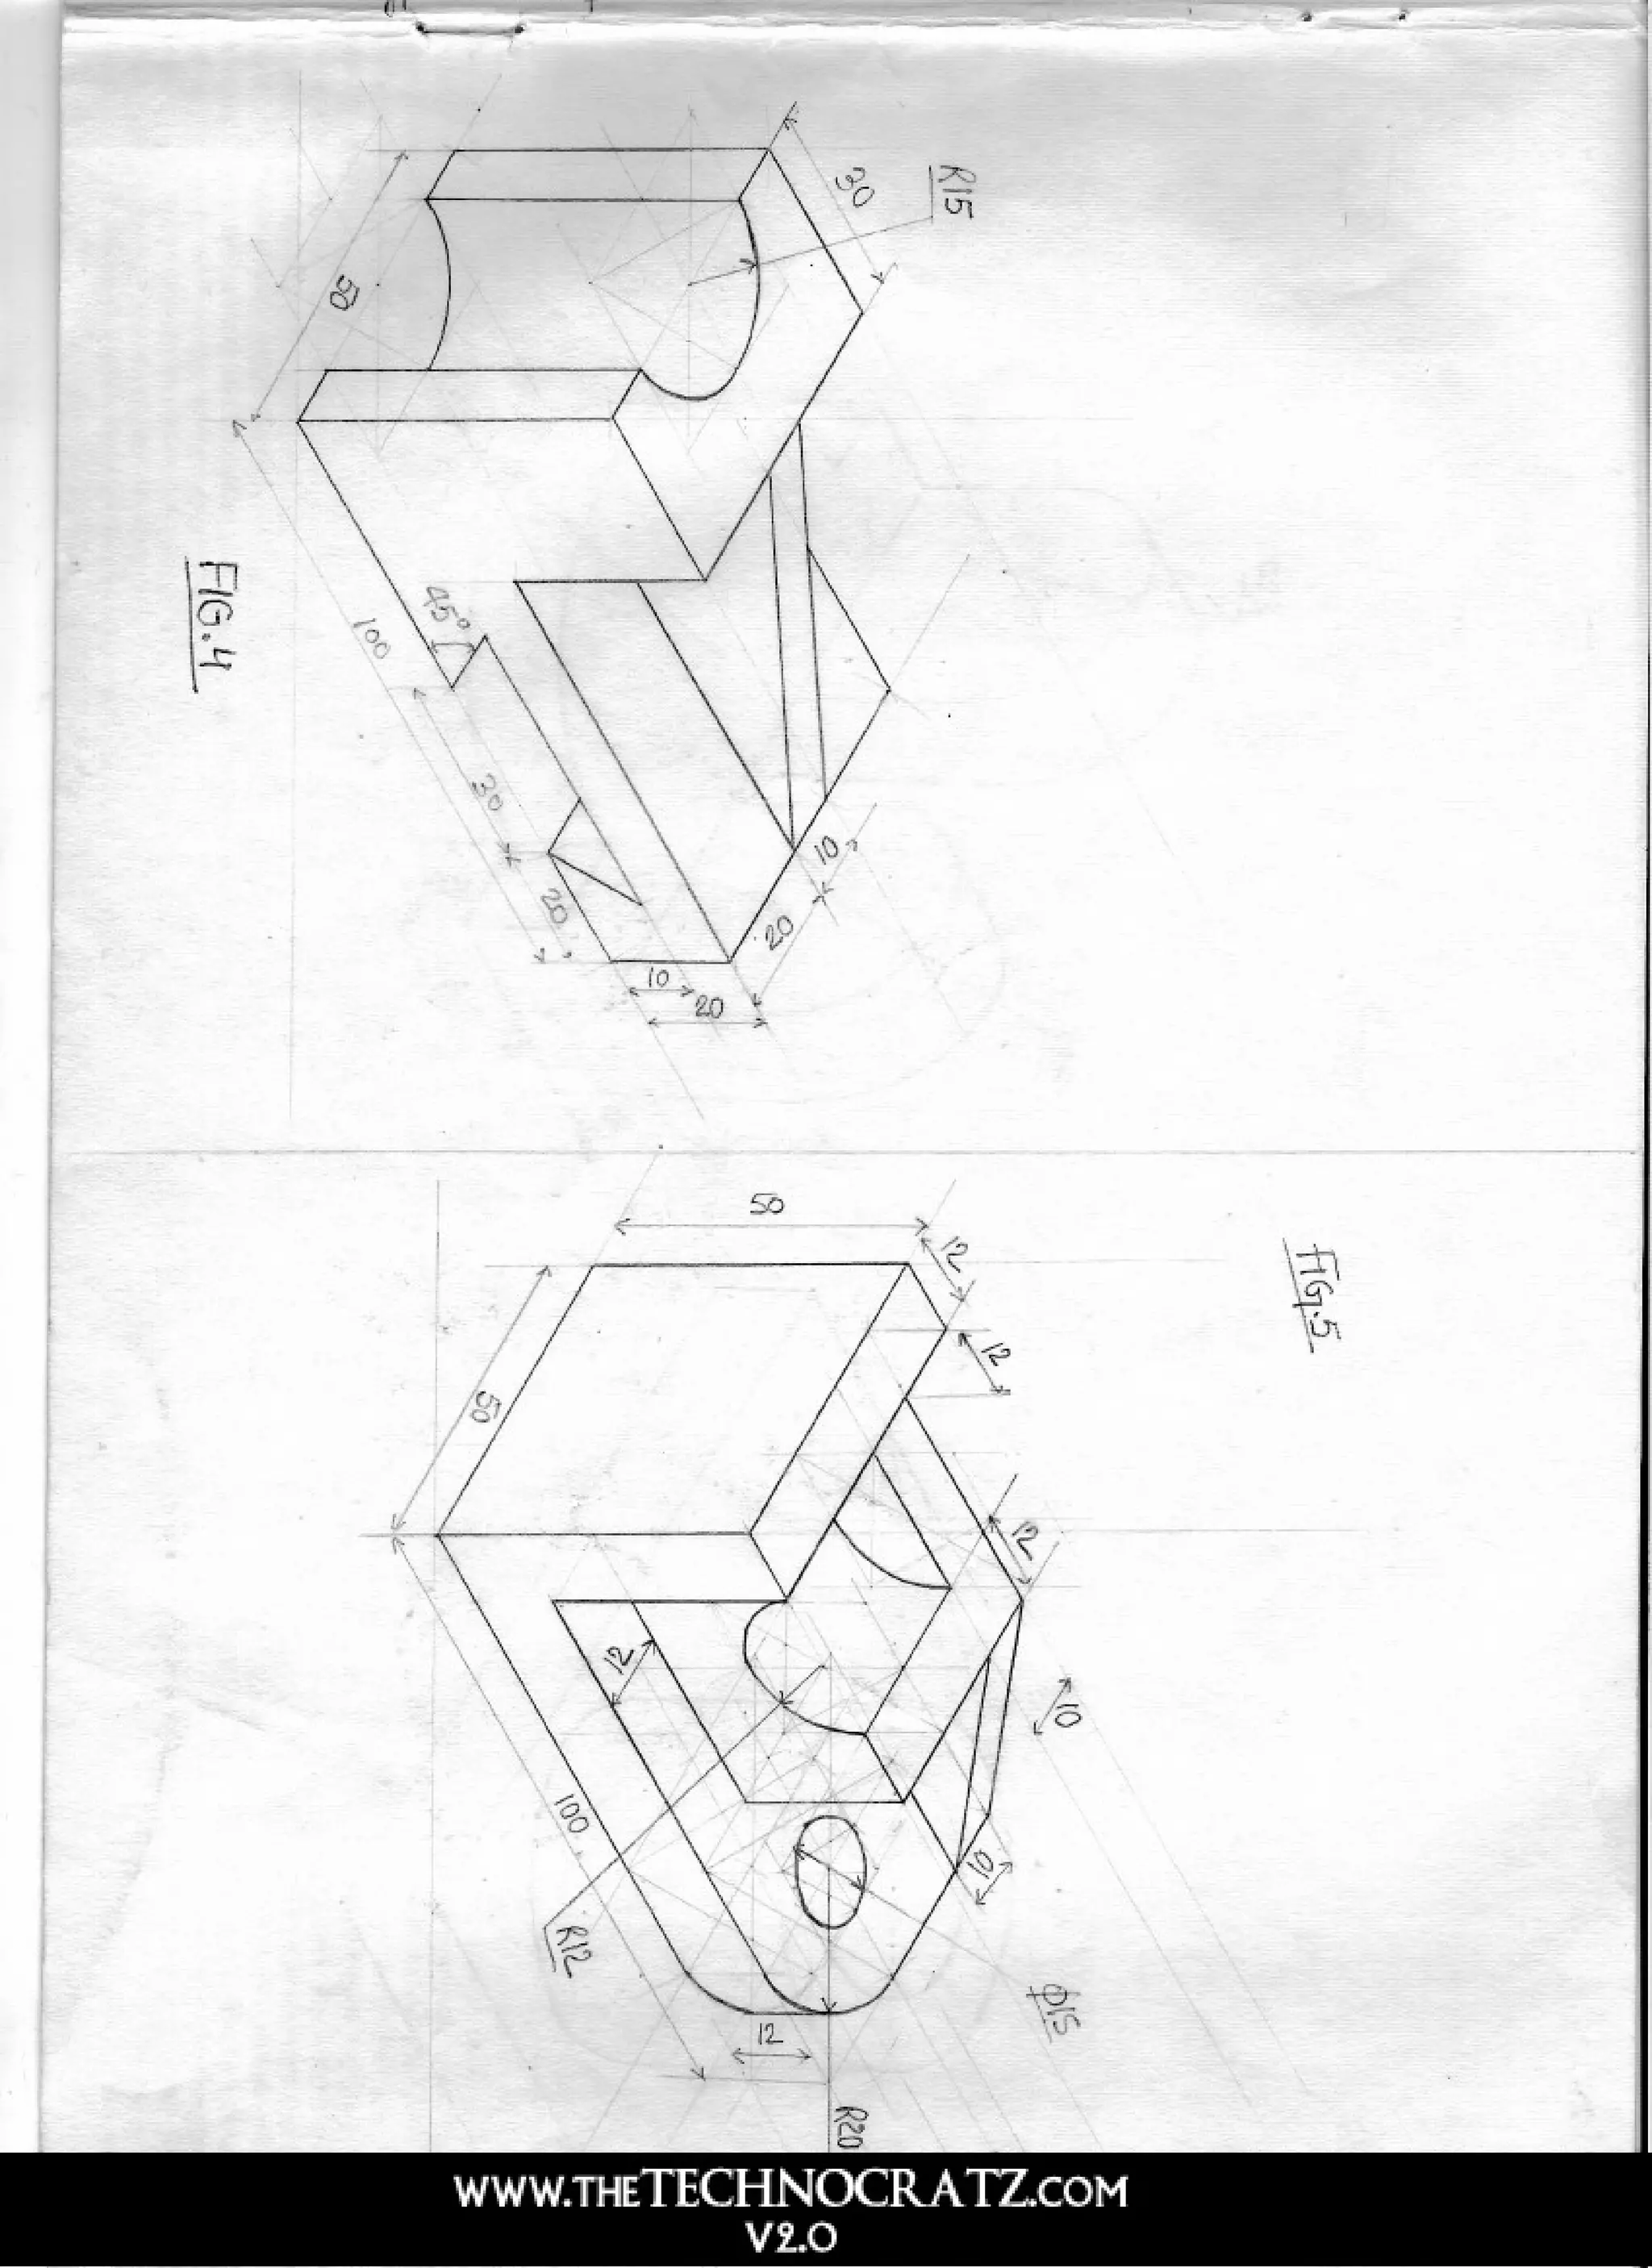
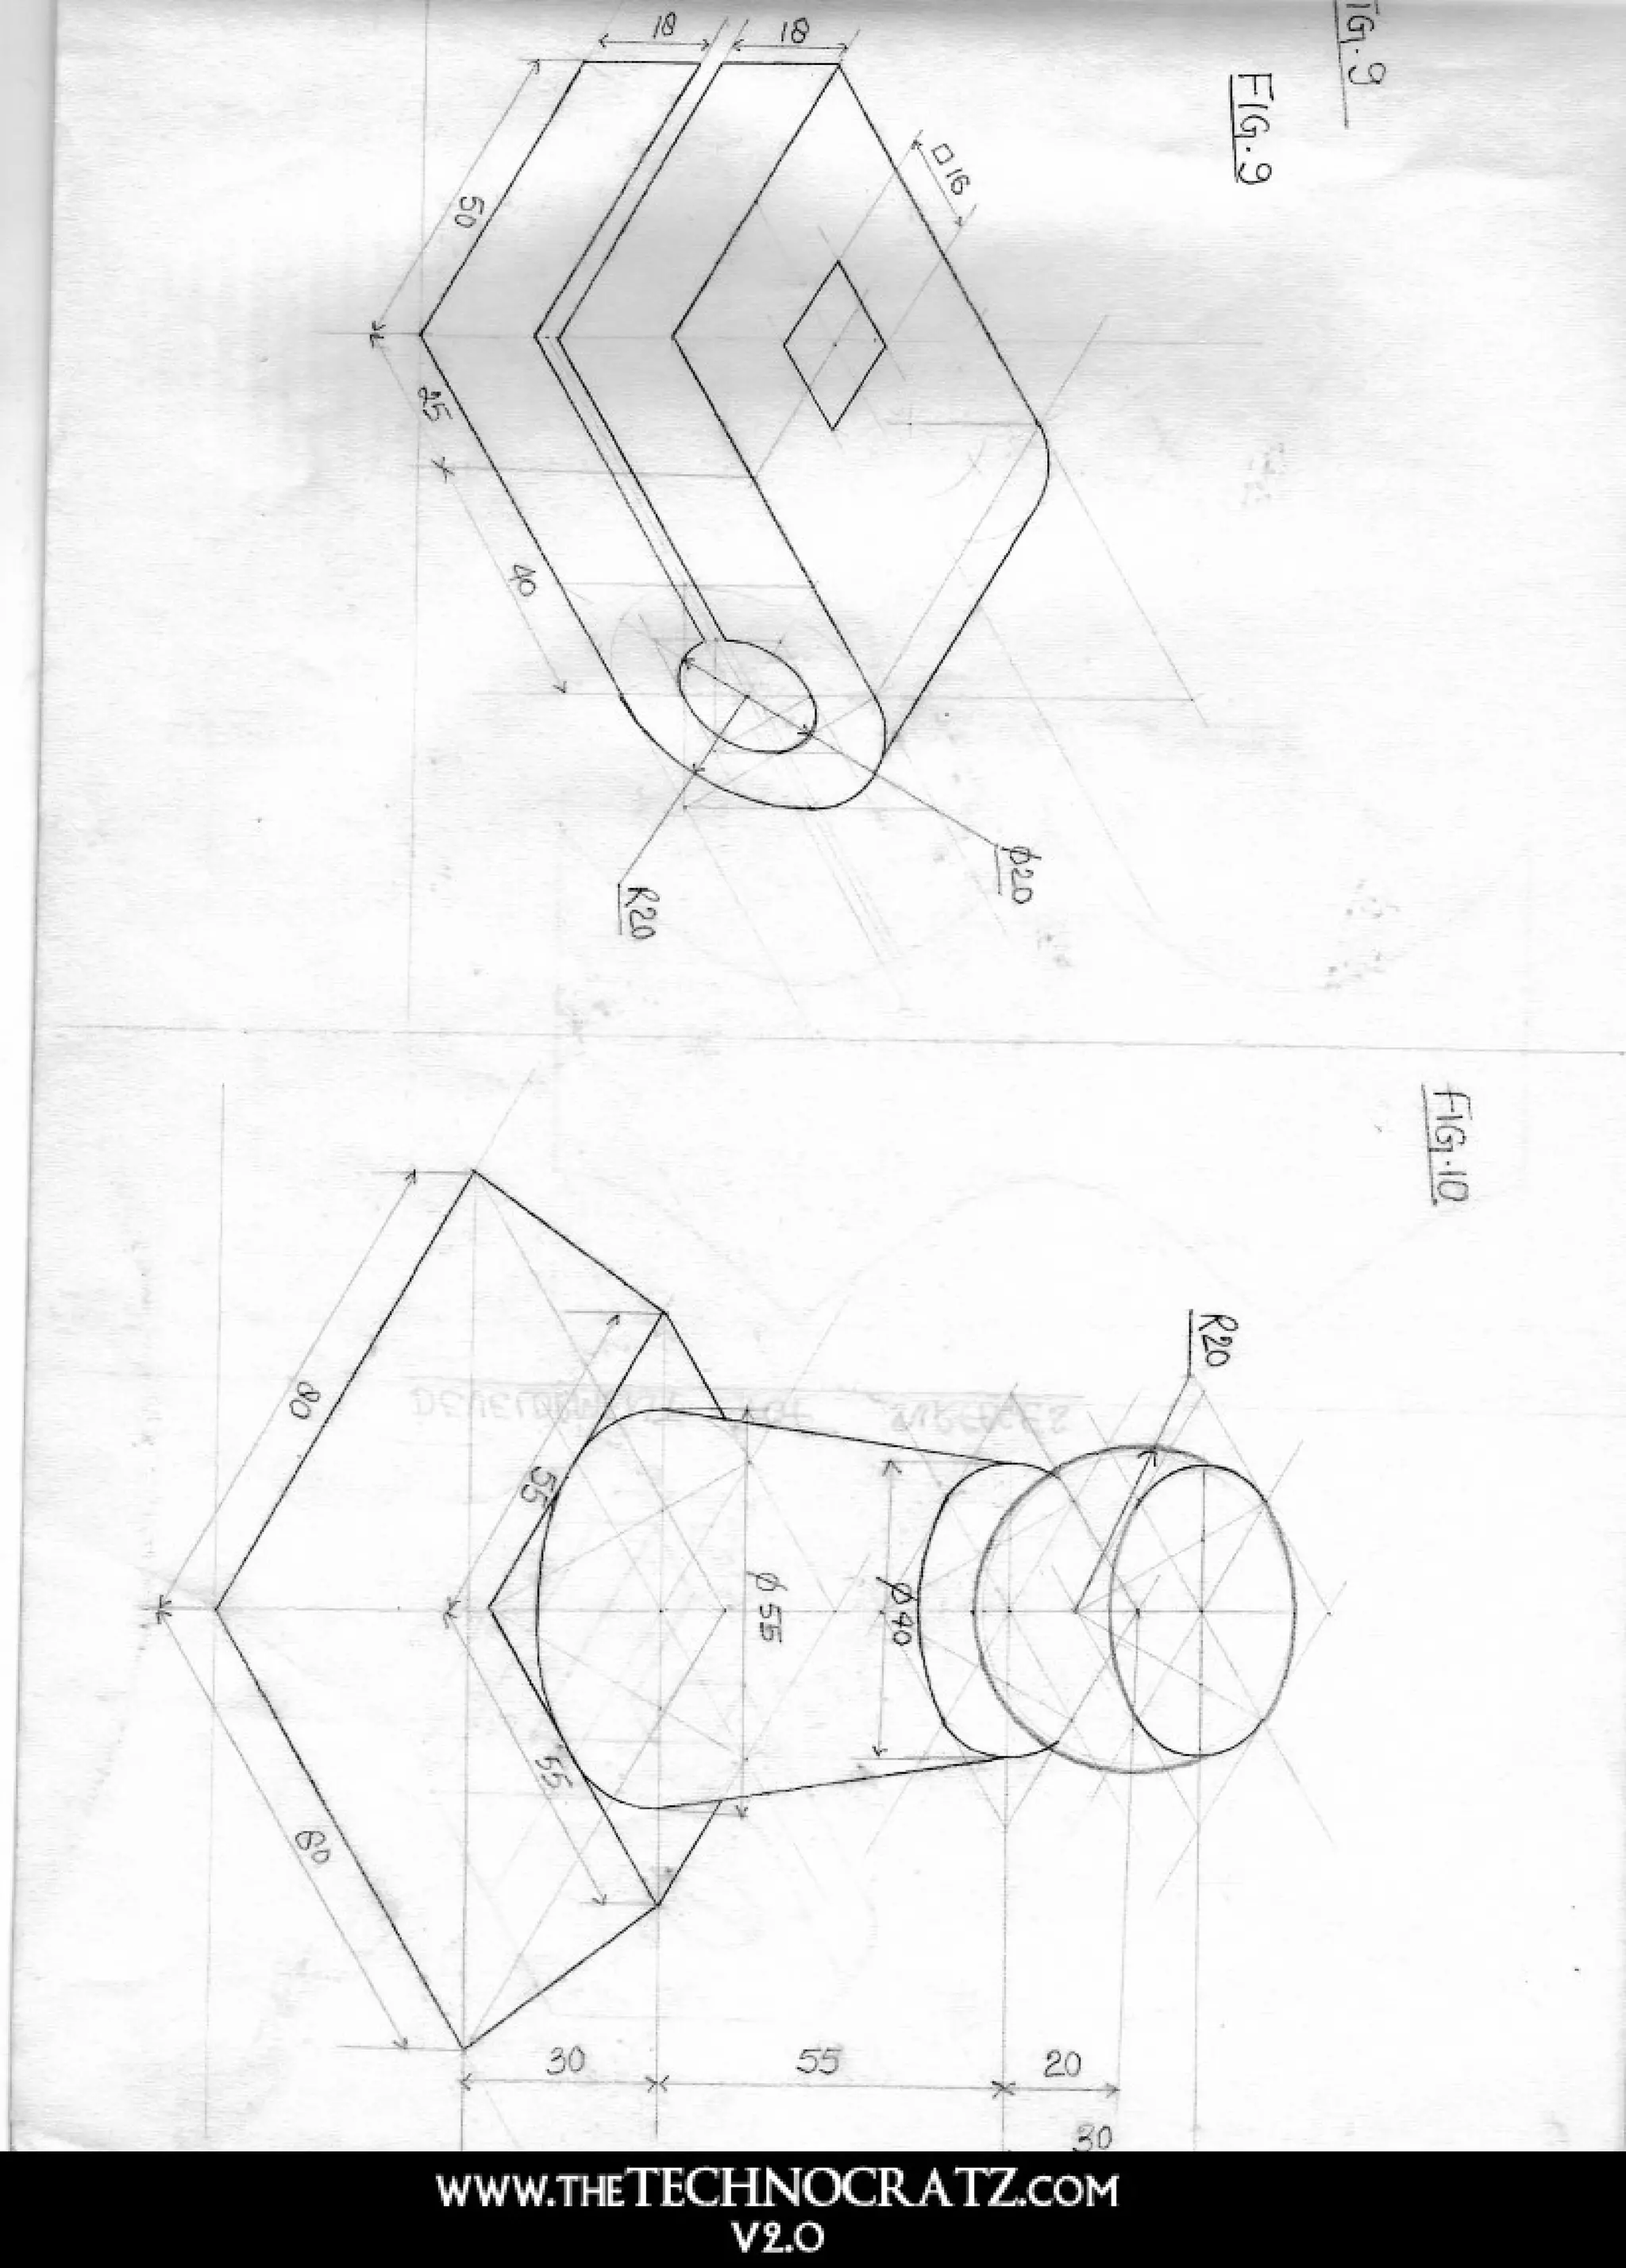
Isometric projection
Isometric projection
Engineering
◦
Read more
4
Save
Share
Embed
Embed presentation
Download
Downloaded 10 times
1
/ 5
2
/ 5
3
/ 5
4
/ 5
5
/ 5
More Related Content
PPT
Isometric projection
by
Vijendrasingh Rathor
PPT
Isometric
by
nashon1234567
PPT
Lesson 11-isometric-projections-i
by
eglive
PPT
Lesson 11 Isometric Projection - Part I
by
Jeyapoovan Thangasamy
PPT
Isometric projection
by
Yash Prajapati
PPT
Lesson 12 Isometric Projection - Part II
by
Jeyapoovan Thangasamy
PPT
B.tech i eg u5 isometric
by
Rai University
PPTX
Machine parts orthographic projections
by
Mohd Mujahid Nasir
Isometric projection
by
Vijendrasingh Rathor
Isometric
by
nashon1234567
Lesson 11-isometric-projections-i
by
eglive
Lesson 11 Isometric Projection - Part I
by
Jeyapoovan Thangasamy
Isometric projection
by
Yash Prajapati
Lesson 12 Isometric Projection - Part II
by
Jeyapoovan Thangasamy
B.tech i eg u5 isometric
by
Rai University
Machine parts orthographic projections
by
Mohd Mujahid Nasir
Viewers also liked
PPT
Isometric projections for engineering students
by
Akshay Darji
PPT
BE sem 1 Engineering Graphics(E.G.) full course ppt
by
Dhruv Parekh
PPT
Lecture 11 Perspective Projection
by
guest0026f
PPT
Axonometric
by
lluismira
PDF
Orthographic projection exercises
by
Sisco Batalla
PPT
Ist year engineering-graphics-ed-for-be-students (1) (1)
by
Vivek Sricharan
PPT
Pictorial Drawings
by
Bruce Coulter
PPT
Engineering Drawing: Chapter 05 pictorial sketching
by
mokhtar
PPSX
Pictorial Drawing
by
Grant Haggerty
Isometric projections for engineering students
by
Akshay Darji
BE sem 1 Engineering Graphics(E.G.) full course ppt
by
Dhruv Parekh
Lecture 11 Perspective Projection
by
guest0026f
Axonometric
by
lluismira
Orthographic projection exercises
by
Sisco Batalla
Ist year engineering-graphics-ed-for-be-students (1) (1)
by
Vivek Sricharan
Pictorial Drawings
by
Bruce Coulter
Engineering Drawing: Chapter 05 pictorial sketching
by
mokhtar
Pictorial Drawing
by
Grant Haggerty
Recently uploaded
PDF
lecture on Microprocessor: 8288 bus controller
by
sandeshupadhayay989
PPT
Steam generation , types of steam, boilers and their classifications, mountin...
by
PrashantPatunkar1
PPTX
pH-Responsive Polymers: Synthesis, Properties, and Biomedical Applications
by
BURAKALPERENKARABULU
PDF
Arithmetic for computers and its types..
by
suganyapownaiya
PPTX
AI INTRODUCTION New Microsoft Office PowerPoint Presentation.pptx
by
b23cs183
PPTX
Unit 2 - ABRASIVE PROCESS AND BROACHING.pptx
by
arivazhaganrajangam
PPTX
UNIT-1.pptx...................................
by
RavinderKaur647214
PPTX
SOFTWARE PROJECT MANAGEMENT PART 2-2.pptx
by
ssuserbafe2d
PPTX
MOD 1 (concrete technology -cement,aggregates .pptx
by
tkmmullonkal
PDF
22nd Safety Convention by IE(I) dt 27.12.25 by Rajesh Prasad.pdf
by
Rajesh Prasad
PPTX
Forouzan6e_ch09_PPTs_Transport.pptxmcgrawhill
by
shaiviadesh
PPTX
MET 464 /MOD 2/MIRCO AND NANO MANUFACTURING/SESSION 1.pptx
by
VINAY B
PPT
CHAPTER 09 - Digital signatures cryptography note
by
Sherin Wilson
PPTX
STM Unit 2 Complete notes for engineering students for better understanding
by
LakshmiVivekaKesanap
PPT
Escape-17-plenary-gani-grossmann-final.ppt
by
newjourneynewlife201
PPTX
narrow-band-dfr-presentation-megger.pptx
by
ssuser52ed331
PPTX
reference material iso 45001_2018.pptx reference material iso 45001_2018.pptx
by
MelwinPaul6
PPTX
Chapter4- Continuous-Time Markov Models- Stpchastoc Processes- Dr. Zahedi.pptx
by
zahedicourse
PPTX
MOHSIN IJAZ PRESENTATION Final-climate.pptx
by
akashhussain2851
PPTX
410776623-5G 3GPP STANDARED-Overview.pptx
by
Mohamedshabana38
lecture on Microprocessor: 8288 bus controller
by
sandeshupadhayay989
Steam generation , types of steam, boilers and their classifications, mountin...
by
PrashantPatunkar1
pH-Responsive Polymers: Synthesis, Properties, and Biomedical Applications
by
BURAKALPERENKARABULU
Arithmetic for computers and its types..
by
suganyapownaiya
AI INTRODUCTION New Microsoft Office PowerPoint Presentation.pptx
by
b23cs183
Unit 2 - ABRASIVE PROCESS AND BROACHING.pptx
by
arivazhaganrajangam
UNIT-1.pptx...................................
by
RavinderKaur647214
SOFTWARE PROJECT MANAGEMENT PART 2-2.pptx
by
ssuserbafe2d
MOD 1 (concrete technology -cement,aggregates .pptx
by
tkmmullonkal
22nd Safety Convention by IE(I) dt 27.12.25 by Rajesh Prasad.pdf
by
Rajesh Prasad
Forouzan6e_ch09_PPTs_Transport.pptxmcgrawhill
by
shaiviadesh
MET 464 /MOD 2/MIRCO AND NANO MANUFACTURING/SESSION 1.pptx
by
VINAY B
CHAPTER 09 - Digital signatures cryptography note
by
Sherin Wilson
STM Unit 2 Complete notes for engineering students for better understanding
by
LakshmiVivekaKesanap
Escape-17-plenary-gani-grossmann-final.ppt
by
newjourneynewlife201
narrow-band-dfr-presentation-megger.pptx
by
ssuser52ed331
reference material iso 45001_2018.pptx reference material iso 45001_2018.pptx
by
MelwinPaul6
Chapter4- Continuous-Time Markov Models- Stpchastoc Processes- Dr. Zahedi.pptx
by
zahedicourse
MOHSIN IJAZ PRESENTATION Final-climate.pptx
by
akashhussain2851
410776623-5G 3GPP STANDARED-Overview.pptx
by
Mohamedshabana38
Download