1. ***
***
0
2
4
6
8
10
12
14
16
18
Incubator Ctrl Media AVG Incubator Ctrl Dry AVG Ctrls AIR AVG 0.03 ppm Benzene AVG 0.1 ppm Benzene AVG 0.3 ppm Benzene AVG
Mean Tail Intensities
(%)
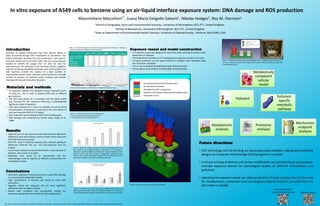
Figure 2: Mean tail intensity (%) of the control and exposed cells. Error
bars represent the standard deviation of the means. (***) indicates a
statistically significant difference between the exposed sample and their
relative controls. The figure includes 3 independent replicates for the
controls, and a single independent replicate for the exposed cells. Each
independent replicate consisted of 3 technical replicates.
N
(Cells)
Mean Median
Standard
Deviation
Variance
H
(Variance/Mean)
Incubator Controls (Media) 1550 4.52 0.74 9.40 70.98 20.61
Incubator Controls (Dry) 1376 6.73 3.40 11.80 135.26 18.98
Controls 1028 7.40 3.15 11.60 147.82 20.77
0.03 ppm benzene 314 11.49 3.21 15.58 243.83 21.26
0.1 ppm benzene 318 16.02* 5.53* 21.28 456.49 28.37
0.3 ppm benzene 375 12.27* 5.13* 16.90 303.75 23.29
In vitro exposure of A549 cells to benzene using an air-liquid interface exposure system: DNA damage and ROS production
Massimiliano Mascelloni1*, Juana Maria Delgado-Saborit1, Nikolas Hodges2, Roy M. Harrison1
1School of Geography, Earth and Environmental Sciences, University of Birmingham, B15 2TT, United Kingdom
2School of Biosciences, University of Birmingham, B15 2TT, United Kingdom
*Now at Department of Environmental Health Sciences, University of Massachusetts, Amherst, MA 01003, USA
Figure 1: Example of results from the Comet assay
A: control cells exposed to synthetic air for 2h;
B: Cells exposed to 0.1ppm benzene for 2h.
Metabolically
competent
cellular
model
Metabolomic
analyses
Proteomic
analyses
Mechanistic
endpoint
analyses
Pollutant
Pollutant-
specific
metabolic
pathway
Introduction
Exposure to volatile compounds that have adverse effects is
often monitored through their metabolites or biomarkers. The
field of biomarker discovery for such compounds is still nascent.
Extensive studies which are both costly and time consuming are
needed to identify the targets that can later be used for
biomonitoring. The potential of the presented device, together
with the increasing availability and lower costs of 3D printers and
CNC machines enables the creation of a high numbers of
reproducible samples with a relatively small investment. The high
number of samples can facilitate further analyses and method
development towards biomarker discovery.
The authors wish to thank Shrikant Jondhale for providing the A549 cells. Authors wish to thank CEFIC LRI 2010 Long Range Initiative Innovative Science Award for funding this study.
Reference paper:
Materials and methods
• An exposure chamber was designed around Transwell inserts
(Corning Inc., UK), in order to expose A549 cells to different
gas mixtures.
• The cells were grown on a monolayer and the apical media
was removed for the exposure, obtaining a physiologically
significant model of exposure.
• Cells were exposed for 2 hours to synthetic air and to three
concentrations of benzene to study short the term effects of
low level exposure (0.03; 0.1; 0.3ppm).
• ROS production was analysed via DCFH-DA (10 µM) assay
• DNA damage was measured by Comet assay (Singh et al.,
1988)
Exposure vessel and model construction
• The exposure vessel was designed to have three wells, allowing to perform each
experiment in triplicate
• The temperature was kept at 37°C by keeping the exposure vessel in a GC oven
• The gases (synthetic air and 1ppm benzene in nitrogen) were delivered using
two mass flow controllers
• The air was humidified by bubbling through deionized water
• The two gases were mixed in a heated glass mixing chamber
Results
• Exposure to air in the exposure vessel did not show significant
differences with the incubator control in both comet assay and
DCFH-DA fluorescence assay
• DCFH-DA assay in benzene exposed cells, showed significant
differences between the pre- and post-exposure only for
0.3ppm
• Comet assay showed increased DNA breaks in cells exposed to
benzene, with a peak on 0.1ppm
• Replicates were found to be reproducible and the
methodology could be applied to different environments for
toxicological studies
Conclusions
• Short term exposure to benzene proved to cause DNA damage
in a concentration-dependent fashion
• High concentration of benzene was found to cause ROS
production
• Negative control (air exposure) did not show significant
differences with incubator controls
• Results were consistent and reproducible, making the
procedure a good proof of concept for future applications
Future directions
• CNC technology and 3D printing are becoming easily available, editing and modifying
designs via Computer Aided Design (CAD) programs is a reality
• In-house printing of devices and ad-hoc modification can provide cheap and purpose-
oriented exposure devices for toxicological studies of different atmospheres and
pollutants
• Upscaling the exposure vessel can allow production of large samples that can be used
for metabolomics, proteomics and toxicological endpoint analyses, provided that the
cell model is suitable
Graphic representation of comet results: Y represents % tail intensity
***
0
2000
4000
6000
8000
10000
12000
14000
16000
18000
Incubator Ctrl Dry Incubator Ctrl Media Air exposure 0.03 ppm Benzene 0.1 ppm Benzene 0.3 ppm Benzene
Pre/Post Exposure Fluorescence
(Fluorescence Units)
Pre Exposure Post Exposure
Figure 3: Summary of the DCF fluorescence measurements before and
after exposure. Error bars represent standard deviation. (***) indicates a
statistically significant difference between the pre and the post exposure.
Table 1: Descriptive statistics of the Comet assay data (% tail intensity). * indicates a
statistically significant difference with the control.
Contact information:
mmascelloni@umass.edu
Figure 4: Schematics of the exposure vessel assembly.
Figure 5: Schematic with gas flow representation of the assembled exposure vessel. On
the right is reported a picture of the experimental setup in working condition, inside a gas
chromatography oven.