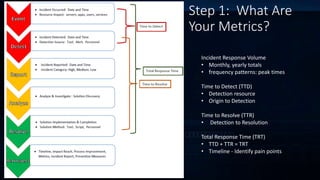
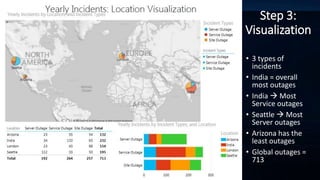
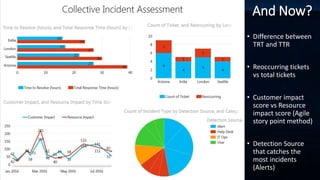
Incident Response Management
Aline Tran
Sr. Application Support Administrator
KS Bishop Estate
Insight into IRM with metrics, data, and
visualization at a $10 billion non-profit
organization specializing in commercial real
estate, agriculture, land conversation, community
outreach and education.
Presentation Progression
Step 1: Metrics
Step 2: Data
Step 3: Visualization
Step 4: Application!
Step 1: What Are
Your Metrics?
Incident Response Volume
• Monthly, yearly totals
• frequency patterns: peak times
Time to Detect (TTD)
• Detection resource
• Origin to Detection
Time to Resolve (TTR)
• Detection to Resolution
Total Response Time (TRT)
• TTD + TTR = TRT
• Timeline - Identify pain points
Step 2: What Does Your
Data Say?
Location Incident Types
Monthly
Incidents
Yearly
Incidents
Seattle Server Outage 15 112
Seattle Service Outage 10 33
Seattle Site Outage 9 50
India Server Outage 24 34
India Service Outage 12 133
India Site Outage 32 65
London Server Outage 10 23
London Service Outage 23 43
London Site Outage 5 88
Arizona Server Outage 12 23
Arizona Service Outage 10 55
Arizona Site Outage 27 54
WHAT DO YOU SEE?
Sandlot movie 1993
Flip the lens…
Step 3:
Visualization
• 3 types of
incidents
• India = overall
most outages
• India  Most
Service outages
• Seattle  Most
Server outages
• Arizona has the
least outages
• Global outages =
713
WHAT DO YOU SEE NOW?
Category Incident Type Location(s)
Customer
Impact
Resource
Impact
Detection Source Started Detected Reported
Time to
Resolve
Total
Response
Time
Reoccurring
High Service Outage Seattle 57 32 Alert 1/3/2016 1/5/2016 1/15/2016 10 12 0
Medium App Arizona 57 72 Alert 2/3/2016 2/5/2016 2/10/2016 5 7 1
Low Server India 32 62 User 3/3/2016 3/5/2016 3/8/2016 3 5 0
Medium System Arizona 47 32 User 4/3/2016 4/5/2016 4/9/2016 4 6 1
High Site Outage London 54 79 Alert 5/3/2016 5/5/2016 5/11/2016 6 8 1
Medium Server Arizona 35 25 IT Ops 6/3/2016 6/5/2016 6/8/2016 3 5 0
Medium Security Seattle 60 50 Alert 7/3/2016 7/5/2016 7/7/2016 2 4 0
High Site Outage London 50 80 Help Desk 8/3/2016 8/5/2016 8/5/2016 0 2 0
Low Security Arizona 65 85 Alert 3/3/2016 3/5/2016 3/11/2016 6 8 0
Low Service Outage India 69 54 Alert 2/3/2016 2/5/2016 2/8/2016 3 5 0
High Server Arizona 37 44 User 3/3/2016 3/5/2016 3/9/2016 4 6 1
High Service Outage Seattle 38 28 User 4/3/2016 4/5/2016 4/12/2016 7 9 1
High Service Outage London 44 34 Alert 1/13/2016 1/15/2016 1/15/2016 0 2 0
Medium App India 41 56 IT Ops 2/10/2016 2/12/2016 2/16/2016 4 6 1
Medium System London 47 67 Help Desk 3/18/2016 3/20/2016 3/25/2016 5 7 1
Low Security Arizona 49 34 Help Desk 4/13/2016 4/15/2016 4/20/2016 5 7 0
Medium Site Outage Seattle 63 38 Alert 4/13/2016 4/15/2016 4/18/2016 3 5 0
Low Server London 37 62 Alert 6/3/2016 6/5/2016 6/11/2016 6 8 0
High Service Outage India 32 22 User 7/3/2016 7/5/2016 7/11/2016 6 8 0
Might need stronger prescription…
And Now?
• Difference between
TRT and TTR
• Reoccurring tickets
vs total tickets
• Customer impact
score vs Resource
impact score (Agile
story point method)
• Detection Source
that catches the
most incidents
(Alerts)
LET’S TAKE IT FOR A SPIN!
Step 4: Application
HOW DO WE USE IT? Step 4: Application
Task No. Action Location Affected Description Event Resource Date Incident Hours
Communication
Score Ideal Score
1Origin Seattle User 1 opens infected email attachment Event 1 User 8/26/16 1:00 PM 0.00 0 100
2Detected Seattle
Help Desk receives call from User 1 saying files
are locked and ransom message displays Event 1 User 8/27/16 8:00 AM 19.00 80 100
3Reported Seattle
Help Desk notifies Desktop Team and ISO but not
Ops. ISO does not notify Ops. Event 1 Help Desk 8/27/16 9:00 AM 20.00 60 100
4Contained Seattle Desktop Team reclaims infected laptop Event 1 Desktop Team 8/27/16 12:00 PM 23.00 40 100
5Analyzed Seattle
Desktop Team analyzes the laptop and begins
restoration process. Desktop Team does not wait
for guidance from ISO and does not notify Ops. Event 1 Desktop Team 8/27/16 1:30 PM 24.50 20 100
6Restored Seattle
Desktop Team completes restore and returns
laptop to user. Does not notify other teams. Event 1 Desktop Team 8/27/16 3:30 PM 26.50 10 100
7Detected Seattle
User 2 calls Help Desk and reports files are locked
in a shared folder. Event 2 User 8/27/16 1:00 PM 24.00 80 100
8Reported Seattle
Help Desk notifies IT Ops to look at the shared
folder. Unknown if ISO is notified. Event 2 Help Desk 8/27/16 1:30 PM 24.50 60 100
9Analyzed Seattle
IT Ops analyzes and notes the files have all been
encrypted and are inaccessible. Confirms incident
with Help Desk. Does not notify Infrastructure Event 2 IT Ops 8/27/16 2:00 PM 25.00 75 100
10Notified Seattle
IT Ops attempts to call the ISO call tree for
incidents but no one picks up. Event 2 IT Ops 8/27/16 3:00 PM 26.00 80 100
11Stalled Seattle
IT Ops does not take action in case files need to
be investigated. Files on shared folder continue
to be encrypted. Event 2 IT Ops 8/27/16 3:15 PM 26.15 60 100
12Replied Seattle
IT Ops receives word from ISO to hold the
encrypted files as evidence. Event 2 IT Ops 8/28/16 7:00 AM 44.00 70 100
13Restored Seattle
IT Ops receives word from business unit affected
to restore the shared folder ASAP. IT Ops does
not hold the files as evidence and fulfills the
business want by restoring the shared folder
from a backup. Event 2 IT Ops 8/28/16 9:00 AM 46.00 50 100
14Post-Analysis Seattle
ISO confirms User 1 and User 2 incident are
related. Event 1 ISO 8/28/16 10:00 AM 47.00 60 100
15Post-Analysis Seattle
ISO creates timeline and reviews with involved
teams Event 1 ISO 8/29/16 1:00 PM 72.00 80 100
16Follow Up Seattle
Detailed meetings are conducted but no follow
up procedures are created Event 1 ISO 8/30/16 3:00 PM 98.00 40 100
Analyze & Apply Communications Metric
Communication score per team for
Incident. Hold teams accountable
for communication. Score is based
off Agile story point.
Communication score during the
incident timeline. Ideal line at 100.
Goal: Get the communication score
line closer to the ideal line!
Communication takes a dive once
teams are analyzing and restoring!
Now we know where to focus!
How Apply?
Improve communication!
Tracker role
- Designate sole role to just
stay updated on progress.
- Only person with direct
communication to the team.
Communicator role
- Eliminates communication
scramble, duplication,
uncertainty and interference.
- Communicates to rest of org,
external, stakeholders, etc.
• Let the Execution Team focus
on work!!!!
• Scalable  Pod = region
GO DANCE!

Incident Response Management - Metrics, Data, Visualize & Apply

  • 1.
    Incident Response Management AlineTran Sr. Application Support Administrator KS Bishop Estate Insight into IRM with metrics, data, and visualization at a $10 billion non-profit organization specializing in commercial real estate, agriculture, land conversation, community outreach and education.
  • 2.
    Presentation Progression Step 1:Metrics Step 2: Data Step 3: Visualization Step 4: Application!
  • 3.
    Step 1: WhatAre Your Metrics? Incident Response Volume • Monthly, yearly totals • frequency patterns: peak times Time to Detect (TTD) • Detection resource • Origin to Detection Time to Resolve (TTR) • Detection to Resolution Total Response Time (TRT) • TTD + TTR = TRT • Timeline - Identify pain points
  • 4.
    Step 2: WhatDoes Your Data Say? Location Incident Types Monthly Incidents Yearly Incidents Seattle Server Outage 15 112 Seattle Service Outage 10 33 Seattle Site Outage 9 50 India Server Outage 24 34 India Service Outage 12 133 India Site Outage 32 65 London Server Outage 10 23 London Service Outage 23 43 London Site Outage 5 88 Arizona Server Outage 12 23 Arizona Service Outage 10 55 Arizona Site Outage 27 54 WHAT DO YOU SEE? Sandlot movie 1993
  • 5.
  • 6.
    Step 3: Visualization • 3types of incidents • India = overall most outages • India  Most Service outages • Seattle  Most Server outages • Arizona has the least outages • Global outages = 713
  • 7.
    WHAT DO YOUSEE NOW? Category Incident Type Location(s) Customer Impact Resource Impact Detection Source Started Detected Reported Time to Resolve Total Response Time Reoccurring High Service Outage Seattle 57 32 Alert 1/3/2016 1/5/2016 1/15/2016 10 12 0 Medium App Arizona 57 72 Alert 2/3/2016 2/5/2016 2/10/2016 5 7 1 Low Server India 32 62 User 3/3/2016 3/5/2016 3/8/2016 3 5 0 Medium System Arizona 47 32 User 4/3/2016 4/5/2016 4/9/2016 4 6 1 High Site Outage London 54 79 Alert 5/3/2016 5/5/2016 5/11/2016 6 8 1 Medium Server Arizona 35 25 IT Ops 6/3/2016 6/5/2016 6/8/2016 3 5 0 Medium Security Seattle 60 50 Alert 7/3/2016 7/5/2016 7/7/2016 2 4 0 High Site Outage London 50 80 Help Desk 8/3/2016 8/5/2016 8/5/2016 0 2 0 Low Security Arizona 65 85 Alert 3/3/2016 3/5/2016 3/11/2016 6 8 0 Low Service Outage India 69 54 Alert 2/3/2016 2/5/2016 2/8/2016 3 5 0 High Server Arizona 37 44 User 3/3/2016 3/5/2016 3/9/2016 4 6 1 High Service Outage Seattle 38 28 User 4/3/2016 4/5/2016 4/12/2016 7 9 1 High Service Outage London 44 34 Alert 1/13/2016 1/15/2016 1/15/2016 0 2 0 Medium App India 41 56 IT Ops 2/10/2016 2/12/2016 2/16/2016 4 6 1 Medium System London 47 67 Help Desk 3/18/2016 3/20/2016 3/25/2016 5 7 1 Low Security Arizona 49 34 Help Desk 4/13/2016 4/15/2016 4/20/2016 5 7 0 Medium Site Outage Seattle 63 38 Alert 4/13/2016 4/15/2016 4/18/2016 3 5 0 Low Server London 37 62 Alert 6/3/2016 6/5/2016 6/11/2016 6 8 0 High Service Outage India 32 22 User 7/3/2016 7/5/2016 7/11/2016 6 8 0
  • 8.
    Might need strongerprescription…
  • 9.
    And Now? • Differencebetween TRT and TTR • Reoccurring tickets vs total tickets • Customer impact score vs Resource impact score (Agile story point method) • Detection Source that catches the most incidents (Alerts)
  • 10.
    LET’S TAKE ITFOR A SPIN! Step 4: Application
  • 11.
    HOW DO WEUSE IT? Step 4: Application Task No. Action Location Affected Description Event Resource Date Incident Hours Communication Score Ideal Score 1Origin Seattle User 1 opens infected email attachment Event 1 User 8/26/16 1:00 PM 0.00 0 100 2Detected Seattle Help Desk receives call from User 1 saying files are locked and ransom message displays Event 1 User 8/27/16 8:00 AM 19.00 80 100 3Reported Seattle Help Desk notifies Desktop Team and ISO but not Ops. ISO does not notify Ops. Event 1 Help Desk 8/27/16 9:00 AM 20.00 60 100 4Contained Seattle Desktop Team reclaims infected laptop Event 1 Desktop Team 8/27/16 12:00 PM 23.00 40 100 5Analyzed Seattle Desktop Team analyzes the laptop and begins restoration process. Desktop Team does not wait for guidance from ISO and does not notify Ops. Event 1 Desktop Team 8/27/16 1:30 PM 24.50 20 100 6Restored Seattle Desktop Team completes restore and returns laptop to user. Does not notify other teams. Event 1 Desktop Team 8/27/16 3:30 PM 26.50 10 100 7Detected Seattle User 2 calls Help Desk and reports files are locked in a shared folder. Event 2 User 8/27/16 1:00 PM 24.00 80 100 8Reported Seattle Help Desk notifies IT Ops to look at the shared folder. Unknown if ISO is notified. Event 2 Help Desk 8/27/16 1:30 PM 24.50 60 100 9Analyzed Seattle IT Ops analyzes and notes the files have all been encrypted and are inaccessible. Confirms incident with Help Desk. Does not notify Infrastructure Event 2 IT Ops 8/27/16 2:00 PM 25.00 75 100 10Notified Seattle IT Ops attempts to call the ISO call tree for incidents but no one picks up. Event 2 IT Ops 8/27/16 3:00 PM 26.00 80 100 11Stalled Seattle IT Ops does not take action in case files need to be investigated. Files on shared folder continue to be encrypted. Event 2 IT Ops 8/27/16 3:15 PM 26.15 60 100 12Replied Seattle IT Ops receives word from ISO to hold the encrypted files as evidence. Event 2 IT Ops 8/28/16 7:00 AM 44.00 70 100 13Restored Seattle IT Ops receives word from business unit affected to restore the shared folder ASAP. IT Ops does not hold the files as evidence and fulfills the business want by restoring the shared folder from a backup. Event 2 IT Ops 8/28/16 9:00 AM 46.00 50 100 14Post-Analysis Seattle ISO confirms User 1 and User 2 incident are related. Event 1 ISO 8/28/16 10:00 AM 47.00 60 100 15Post-Analysis Seattle ISO creates timeline and reviews with involved teams Event 1 ISO 8/29/16 1:00 PM 72.00 80 100 16Follow Up Seattle Detailed meetings are conducted but no follow up procedures are created Event 1 ISO 8/30/16 3:00 PM 98.00 40 100
  • 12.
    Analyze & ApplyCommunications Metric Communication score per team for Incident. Hold teams accountable for communication. Score is based off Agile story point. Communication score during the incident timeline. Ideal line at 100. Goal: Get the communication score line closer to the ideal line! Communication takes a dive once teams are analyzing and restoring! Now we know where to focus!
  • 13.
    How Apply? Improve communication! Trackerrole - Designate sole role to just stay updated on progress. - Only person with direct communication to the team. Communicator role - Eliminates communication scramble, duplication, uncertainty and interference. - Communicates to rest of org, external, stakeholders, etc. • Let the Execution Team focus on work!!!! • Scalable  Pod = region
  • 14.