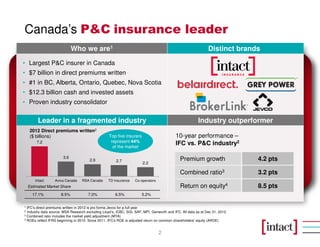
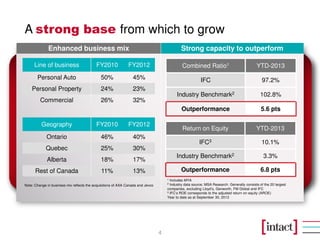
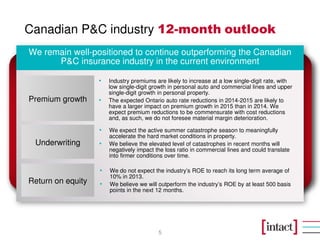
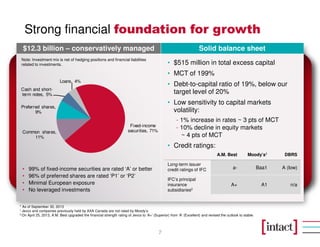
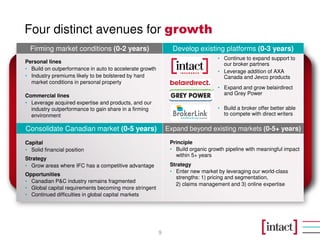
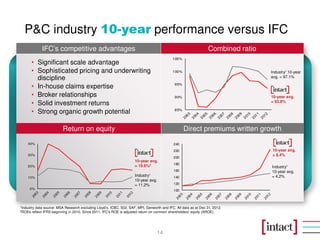
SlideShare a Scribd company logo
1 of 23
Download to read offline
Intact Financial Corporation
Continuing our journey to build a world-class P&C insurer
Investor Presentation
December 2013
(TSX: IFC)
Canada’s P&C insurance leader
Leader in a fragmented industry Industry outperformer
Distinct brandsWho we are1
• Largest P&C insurer in Canada
• $7 billion in direct premiums written
• #1 in BC, Alberta, Ontario, Quebec, Nova Scotia
• $12.3 billion cash and invested assets
• Proven industry consolidator
Premium growth
Combined ratio3
Return on equity4
4.2 pts
3.2 pts
8.5 pts
10-year performance –
IFC vs. P&C industry2
2012 Direct premiums written2
($ billions) Top five insurers
represent 44%
of the market
1 IFC’s direct premiums written in 2012 is pro forma Jevco for a full year
2 Industry data source: MSA Research excluding Lloyd’s, ICBC, SGI, SAF, MPI, Genworth and IFC. All data as at Dec 31, 2012.
3 Combined ratio includes the market yield adjustment (MYA)
4 ROEs reflect IFRS beginning in 2010. Since 2011, IFC's ROE is adjusted return on common shareholders' equity (AROE)
7.2
3.6
2.9 2.7
2.2
Intact Aviva Canada RSA Canada TD Insurance Co-operators
Estimated Market Share
17.1% 8.5% 7.0% 6.5% 5.2%
2
Consistent industry outperformance
3
Significant
scale
advantage
Sophisticated
pricing and
underwriting
Multi-
channel
distribution
Proven
acquisition
strategy
In-house
claims
expertise
Broker
relationships
Solid
investment
returns
Industry data source: MSA Research excluding Lloyd’s, ICBC, SGI, SAF, MPI, Genworth and IFC
Data in five-year chart is for the period ended December 31, 2012
Includes market yield adjustment (MYA)
Five-year average loss ratios2012 metrics
96.7%
93.4%
Combined Ratio
76.5%
67.9%
63.7%
69.2%
67.7%
58.1%
Auto Personal Property Commercial P&C
Industry IFC
10.6%
16.5%
ROE
Industry IFC
A strong base from which to grow
4
Strong capacity to outperformEnhanced business mix
Geography FY2010 FY2012
Ontario 46% 40%
Quebec 25% 30%
Alberta 18% 17%
Rest of Canada 11% 13%
Return on Equity YTD-2013
IFC3 10.1%
Industry Benchmark2 3.3%
Outperformance 6.8 pts
1 Includes MYA
2 Industry data source: MSA Research. Generally consists of the 20 largest
companies, excluding Lloyd’s, Genworth, FM Global and IFC
3 IFC’s ROE corresponds to the adjusted return on equity (AROE)
Year to date as at September 30, 2013
Note: Change in business mix reflects the acquisitions of AXA Canada and Jevco
Line of business FY2010 FY2012
Personal Auto 50% 45%
Personal Property 24% 23%
Commercial 26% 32%
Combined Ratio1 YTD-2013
IFC 97.2%
Industry Benchmark2 102.8%
Outperformance 5.6 pts
Canadian P&C industry 12-month outlook
5
We remain well-positioned to continue outperforming the Canadian
P&C insurance industry in the current environment
Premium growth
Return on equity
• We expect the active summer catastrophe season to meaningfully
accelerate the hard market conditions in property.
• We believe the elevated level of catastrophes in recent months will
negatively impact the loss ratio in commercial lines and could translate
into firmer conditions over time.
• Industry premiums are likely to increase at a low single-digit rate, with
low single-digit growth in personal auto and commercial lines and upper
single-digit growth in personal property.
• The expected Ontario auto rate reductions in 2014-2015 are likely to
have a larger impact on premium growth in 2015 than in 2014. We
expect premium reductions to be commensurate with cost reductions
and, as such, we do not foresee material margin deterioration.
Underwriting
• We do not expect the industry’s ROE to reach its long term average of
10% in 2013.
• We believe we will outperform the industry’s ROE by at least 500 basis
points in the next 12 months.
Beat industry ROE by
5 points every year
Pricing & Segmentation:
2 points
Claims management:
3 points
Investments and capital
management: 2 points
Total: 7 points
Leaves 2 points to reinvest in
customer experience (price,
product, service, brand)
NOIPS growth of 10%
per year over time
Organic growth:
4-6%
Margin improvement:
0-3%
Capital management/deployment:
2-4%
A 36-month roadmap for outperformance
6
Strong financial foundation for growth
7
• $515 million in total excess capital
• MCT of 199%
• Debt-to-capital ratio of 19%, below our
target level of 20%
• Low sensitivity to capital markets
volatility:
- 1% increase in rates ~ 3 pts of MCT
- 10% decline in equity markets
~ 4 pts of MCT
• Credit ratings:
Solid balance sheet$12.3 billion – conservatively managed
A.M. Best Moody’s1 DBRS
Long-term issuer
credit ratings of IFC a- Baa1 A (low)
IFC’s principal
insurance
subsidiaries2
A+ A1 n/a
* As of September 30, 2013
1 Jevco and companies previously held by AXA Canada are not rated by Moody’s.
2 On April 25, 2013, A.M. Best upgraded the financial strength rating of Jevco to ‘A+’ (Superior) from ‘A’ (Excellent) and revised the outlook to stable.
Note: Investment mix is net of hedging positions and financial liabilities
related to investments.
• 99% of fixed-income securities are rated ‘A’ or better
• 96% of preferred shares are rated ‘P1’ or ‘P2’
• Minimal European exposure
• No leveraged investments
Fixed-income
securities, 71%Common shares,
11%
Preferred shares,
9%
Cash and short-
term notes, 5%
Loans, 4%
Strategic capital management
8
• We have increased our dividend each year
since our IPO
Shareholder friendly approachCapital management framework
Strong capital base has allowed us to pursue our
growth objectives while returning capital to
shareholders
Maintain leverage ratio
(target 20% debt to total capital)
Maintain existing dividends
Increase dividends
Invest in growth initiatives
Share buybacks
$0.163
$0.25
$0.27
$0.31 $0.32
$0.34
$0.37
$0.40
$0.44
-
0.05
0.10
0.15
0.20
0.25
0.30
0.35
0.40
0.45
0.50
2005 2006 2007 2008 2009 2010 2011 2012 Q3-13
Quarterlydividendpershare
• We believe we have organic growth
opportunities within our multi-brand offering
• We have a track record of 13 accretive
acquisitions, the most recent being AXA Canada
and Jevco
• We have returned over $1.2 billion to
shareholders in the form of buybacks in the past
five years
Four distinct avenues for growth
Consolidate Canadian market (0-5 years) Expand beyond existing markets (0-5+ years)
Develop existing platforms (0-3 years)Firming market conditions (0-2 years)
Capital
• Solid financial position
Strategy
• Grow areas where IFC has a competitive advantage
Opportunities
• Canadian P&C industry remains fragmented
• Global capital requirements becoming more stringent
• Continued difficulties in global capital markets
Principle
• Build organic growth pipeline with meaningful impact
within 5+ years
Strategy
• Enter new market by leveraging our world-class
strengths: 1) pricing and segmentation,
2) claims management and 3) online expertise
• Continue to expand support to
our broker partners
• Leverage addition of AXA
Canada and Jevco products
• Expand and grow belairdirect
and Grey Power
• Build a broker offer better able
to compete with direct writers
9
Personal lines
• Build on outperformance in auto to accelerate growth
• Industry premiums likely to be bolstered by hard
market conditions in personal property
Commercial lines
• Leverage acquired expertise and products, and our
industry outperformance to gain share in a firming
environment
10
Integrations are on track
Jevco – closed September 2012AXA Canada – closed September 2011
• Integration of AXA Canada continues to
progress very well and nearing
completion
• Almost all policies have been converted
and we are focused on
decommissioning the AXA systems
• Continue to target $100 million in annual
after-tax synergies by early 2014
− $89 million synergies run-rate at
September 30, 2013
• IRR estimated above 23%
• Continuing to convert policies into IFC
systems
• Retention has been good and we are
working to re-underwrite portions of the
portfolio, where required
• We expect to reach a $15 million run-
rate in after-tax synergies by the end of
2013, and $23 million by end of 2014
• IRR estimated above 20%
Building on our sustainable competitive
advantages
11
We have a sustainable competitive advantage versus
the industry due to our disciplined approach and quality
operations
We remain committed to adapting products to suit
consumers’ needs
We continue our shareholder-friendly approach to
capital management
Our solid financial position enables us to take
advantage of growth opportunities which may present
themselves in a consolidating industry
Best-in-class team in place to reach our goals
Appendices
Intact Financial Corporation (TSX: IFC)
P&C insurance – a $42 billion market in Canada
13
Industry DPW by line of business3% of GDP in Canada
Industry – premiums by province
• Fragmented market1:
– Top five represent 44%, versus bank/lifeco
markets which are closer to 65-75%
– IFC is largest player with approx. 17%
market share, versus largest bank/lifeco
with 22-25% market share
– P&C insurance shares the same regulator
as the banks and lifecos
• Barriers to entry: scale, regulation, manufacturing
capability, market knowledge
• Home and commercial insurance rates
unregulated; personal auto rates regulated in
some provinces
• Capital is regulated nationally by OSFI
• Brokers continue to own commercial lines and a
large share of personal lines in Canada; direct-to-
consumer channel is growing (distribution =
brokers 67% and direct 33%)
• 30-year return on equity for the industry is
approximately 10%
1 Pro forma IFC’s acquisition of AXA Canada
Industry data source: MSA Research excluding Lloyd’s, ICBC, SAF, SGI, MPI and Genworth.
OSFI = Office of the Superintendent of Financial Institutions Canada
Data as at the end of 2012.
Personal
Auto, 41%
Personal
Property,
21%
Commercial
P&C and
other, 31%
Commercial
Auto, 7%
Ontario,
48%
Quebec,
18%
Alberta,
16%
Other
provinces
and
territories,
18%
P&C industry 10-year performance versus IFC
14
Return on equity Direct premiums written growth
Combined ratioIFC’s competitive advantages
0%
10%
20%
30%
40%
85%
90%
95%
100%
105%
100
120
140
160
180
200
220
240
• Significant scale advantage
• Sophisticated pricing and underwriting
discipline
• In-house claims expertise
• Broker relationships
• Solid investment returns
• Strong organic growth potential
1Industry data source: MSA Research excluding Lloyd’s, ICBC, SGI, SAF, MPI, Genworth and IFC. All data as at Dec 31, 2012.
2ROEs reflect IFRS beginning in 2010. Since 2011, IFC's ROE is adjusted return on common shareholders' equity (AROE).
Industry1
10-year avg.
= 11.2%
10-year avg.
= 19.6%2
Industry1 10-year
avg. = 97.1%
10-year avg.
= 93.8%
10-year avg.
= 8.4%
Industry1
10-year avg.
= 4.2%
Ontario auto environment
15
Ontario government’s strategy to reduce both rates and costs
We outperform the industryOntario mediation backlog
• Reduce insurance rates by an average of 15% over 2 years
– 3% - 5% by January 2014, 8% by August 2014, for the full 15% by August 2015
• We expect the government to announce some cost reduction measures in the coming months,
for implementation in 2014
• We believe the outcome could be margin-neutral and are working with the government to
identify and prioritize additional cost reduction options
• FSCO assigned all remaining cases in
August 2013; industry backlog should be
cleared by year-end
• Total FSCO arbitrations increased 68% in
the first eight months of the year, while IFC
has increased only 3% due to our proactive
approach
• Ontario auto accounts for under one quarter
of our direct premiums written
• Industry near breakeven in first nine months
of 2013
• Continued our solid outperformance versus
the industry year to date September 2013
Plan for delivering 10 points improvement in
personal property
16
0.6% -0.8% -4.0% -3.4% -6.0% -4.3%
104.3% 101.2%
94.6% 93.6% 89.2% 94.7%
8.7%
8.6%
5.9% 13.3%
10.3%
20.3%
FY2008 FY2009 FY2010 FY2011 FY2012 YTD-13
PYD CR excl. CAT and PYD CAT
113.6% 109.0% 96.5% 103.5% 93.5% 110.7% • Rates
• Limit water coverage
• Curtail hail/wind exposure
• Tie prevention to pricing
• Exposure management: geocoding
• National product
• Education and prevention
• Government co-ordination
• Supply chain management
Combined Ratio Composition Actions within 12 months
4.2 4.3
4.5
6.7
7.2
3.5
4.0
4.5
5.0
5.5
6.0
6.5
7.0
7.5
33
35
37
39
41
43
45
2008 2009 2010 2011 2012
Industry IFC
Further industry consolidation ahead
17
Our track record of acquisitions1 Top 20 P&C insurers = 84% of market
Canadian M&A environmentOur acquisition strategy
Environment more conducive to acquisitions now than in
recent years:
• Industry ROEs, although slightly improved from
trough levels of mid-2009, are well below prior peak
• Foreign parent companies are generally in less
favourable capital position
• Demutualization likely for P&C insurance industry
• Targeting large-scale acquisitions of $500 million or
more in direct premiums written
• Pursuing acquisitions in lines of business where we
have expertise
• Acquisition target IRR of 15%
• Targets:
− Bring loss ratio of acquired book of business to
our average loss ratio within 18 to 24 months
− Bring expense ratio to 2 pts below IFC ratio
2012 – Jevco ($530 mil.)
2011 – AXA ($2,600 mil.)
2004 – Allianz ($600 mil.)
2001 – Zurich ($510 mil.)
1999 – Pafco ($40 mil.)
1998 – Guardian ($630 mil.)
1997 – Canadian Surety ($30 mil.)
1995 – Wellington ($370 mil.)
1 Direct premiums written in $ billions, including pools, excluding second term of 2-year policies. IFC’s direct premiums written in 2012 is pro forma Jevco for a full year.
Industry data source: MSA Research excluding Lloyd’s, ICBC, SGI, SAF, MPI, and Genworth. All data as at Dec 31, 2012.
Historical financials
18
IFRS Canadian GAAP
(in $ millions, except as otherwise noted) 2012 2011 2010 2009 2008
Income statement highlights
Direct written premiums $6,868 $5,099 $4,498 $4,275 $4,146
Underwriting income 451 273 193 54 117
Net operating income (NOI) 675 460 402 282 361
NOIPS to common shareholders (in dollars) 5.00 3.91 3.49 2.35 2.96
Balance sheet highlights
Total investments $12,959 $11,828 $8,653 $8,057 $6,605
Debt outstanding 1,143 1,293 496 398 -
Total shareholders' equity (excl. AOCI) 4,710 4,135 2,654 3,047 3,079
Performance metrics
Loss ratio 61.6% 63.9% 65.4% 70.0% 68.2%
Expense ratio 31.5% 30.5% 30.0% 28.7% 28.9%
Combined ratio 93.1% 94.4% 95.4% 98.7% 97.1%
Operating ROE (excl. AOCI) 16.8% 15.3% 15.1% 9.2% 11.3%
Debt / Capital 18.9% 22.9% 14.3% 11.8% -
Combined ratios by line of business
Personal auto 95.7% 90.9% 98.1% 94.9% 95.9%
Personal property 93.5% 103.5% 96.5% 109.0% 113.6%
Commercial auto 81.5% 86.5% 86.0% 79.8% 87.2%
Commercial P&C 91.6% 95.6% 90.7% 104.1% 85.3%
Cash and invested assets
19
Asset class
Quality:
Approx. 96% rated ‘P1’ or ‘P2’
High-quality, dividend paying
Canadian companies. Objective is to
capture non-taxable dividend income.
Fixed income
Quality:
99% of bonds rated ‘A’ or better
100%
Canadian
* As of September 30, 2013
Preferred shares
Geographic exposure of portfolio
100%
Canadian
Corporate 34%
Cdn. federal government and agency 34%
Cdn. provincial and municipal 26%
Supra-National & Foreign 4%
ABS/MBS 2%
TOTAL 100%
Perpetual and callable floating and reset 66.6%
Fixed-rate perpetual 24.7%
Retractable 8.7%
TOTAL 100.0%
Canadian 94.2%
United States 2.4%
Int’l (excl. U.S.) 3.4%
TOTAL 100%
Common shares
Track record of prudent reserving practices
20
3.3%
7.9%
4.9%
2.9%
4.0%
3.2%
4.8% 4.9%
5.7%
0%
1%
2%
3%
4%
5%
6%
7%
8%
9%
2004 2005 2006 2007 2008 2009 2010 2011 2012
• Quarterly and annual
fluctuations in reserve
development are normal
• 2005 reserve development
was unusually high due to
the favourable effects of
certain auto insurance
reforms
• This reflects our preference
to take a conservative
approach to establishing
claims reserves
Rate of claims reserve development
(favourable prior year development as a % of opening reserves)
Investor Relations contact information
21
Vice President, Investor Relations
Phone: 416.344.8004
Cell: 416.797.7828
Email: Dennis.Westfall@intact.net
Manager, Investor Relations
Phone: 416.341.1464 ext 45153
Email: Maida.Sit@intact.net
Email: ir@intact.net
Phone: 416.941.5336 or 1.866.778.0774 (toll-free within North America)
Fax: 416.941.0006
Corporate Website: http://www.intactfc.com
Maida Sit, CFADennis Westfall, CFA
General Contact Info
Forward looking statements and disclaimer
22
Certain of the statements included in this presentation about the Company’s current and future plans, expectations and intentions, results, levels of activity,
performance, goals or achievements or any other future events or developments constitute forward-looking statements. The words “may”, “will”, “would”,
“should”, “could”, “expects”, “plans”, “intends”, “trends”, “indications”, “anticipates”, “believes”, “estimates”, “predicts”, “likely”, “potential” or the negative or other
variations of these words or other similar or comparable words or phrases, are intended to identify forward-looking statements. Forward-looking statements are
based on estimates and assumptions made by management based on management’s experience and perception of historical trends, current conditions and
expected future developments, as well as other factors that management believes are appropriate in the circumstances. Many factors could cause the
Company’s actual results, performance or achievements or future events or developments to differ materially from those expressed or implied by the forward-
looking statements, including, without limitation, the following factors: the Company’s ability to implement its strategy or operate its business as management
currently expects; its ability to accurately assess the risks associated with the insurance policies that the Company writes; unfavourable capital market
developments or other factors which may affect the Company’s investments and funding obligations under its pension plans; the cyclical nature of the P&C
insurance industry; management’s ability to accurately predict future claims frequency; government regulations designed to protect policyholders and creditors
rather than investors; litigation and regulatory actions; periodic negative publicity regarding the insurance industry; intense competition; the Company’s reliance
on brokers and third parties to sell its products to clients; the Company’s ability to successfully pursue its acquisition strategy; the Company’s ability to execute
its business strategy; the terms and conditions of, and regulatory approvals relating to, the integration of Jevco; various other actions to be taken or
requirements to be met in connection with the Jevco acquisition and integrating the Company and Jevco; synergies arising from, and the Company’s integration
plans relating to the AXA Canada and Jevco acquisitions; management's estimates and expectations in relation to resulting accretion, IRR and debt-to-capital
ratio since closing of the AXA Canada and Jevco acquisitions; actions to be taken or requirements to be met in connection with the AXA Canada acquisition and
integrating the Company and AXA Canada; the Company’s participation in the Facility Association (a mandatory pooling arrangement among all industry
participants) and similar mandated risk-sharing pools; terrorist attacks and ensuing events; the occurrence of catastrophic events; the Company’s ability to
maintain its financial strength and issuer credit ratings; access to debt financing and the Company's ability to compete for large commercial business; the
Company’s ability to alleviate risk through reinsurance; the Company’s ability to successfully manage credit risk (including credit risk related to the financial
health of reinsurers); the Company’s reliance on information technology and telecommunications systems; the Company’s dependence on key employees;
changes in laws or regulations; general economic, financial and political conditions; the Company’s dependence on the results of operations of its subsidiaries;
the volatility of the stock market and other factors affecting the Company’s share price; and future sales of a substantial number of its common shares. All of the
forward-looking statements included in this presentation are qualified by these cautionary statements and those made in the “Risk management” section of our
MD&A for the year ended December 31, 2012. These factors are not intended to represent a complete list of the factors that could affect the Company. These
factors should, however, be considered carefully. Although the forward-looking statements are based upon what management believes to be reasonable
assumptions, the Company cannot assure investors that actual results will be consistent with these forward-looking statements. When relying on forward-
looking statements to make decisions, investors should ensure the preceding information is carefully considered. Undue reliance should not be placed on
forward-looking statements made herein. The Company and management have no intention and undertake no obligation to update or revise any forward-
looking statements, whether as a result of new information, future events or otherwise, except as required by law.
Forward looking statements and disclaimer
23
Disclaimer
This Presentation does not constitute or form part of any offer for sale or solicitation of any offer to buy or subscribe for any securities nor shall it or any
part of it form the basis of or be relied on in connection with, or act as any inducement to enter into, any contract or commitment whatsoever.
The information contained in this Presentation concerning the Company does not purport to be all-inclusive or to contain all the information that a
prospective purchaser or investor may desire to have in evaluating whether or not to make an investment in the Company. The information is qualified
entirely by reference to the Company’s publicly disclosed information.
No representation or warranty, express or implied, is made or given by or on behalf of the Company or any of its the directors, officers or employees as
to the accuracy, completeness or fairness of the information or opinions contained in this Presentation and no responsibility or liability is accepted by
any person for such information or opinions. In furnishing this Presentation, the Company does not undertake or agree to any obligation to provide the
attendees with access to any additional information or to update this Presentation or to correct any inaccuracies in, or omissions from, this Presentation
that may become apparent. The information and opinions contained in this Presentation are provided as at the date of this Presentation. The contents
of this Presentation are not to be construed as legal, financial or tax advice. Each prospective purchaser should contact his, her or its own legal adviser,
independent financial adviser or tax adviser for legal, financial or tax advice.
The Company uses both International Financial Reporting Standards (“IFRS”) and certain non-IFRS measures to assess performance. Non-IFRS
measures do not have any standardized meaning prescribed by IFRS and are unlikely to be comparable to any similar measures presented by other
companies. Management of the Company analyzes performance based on underwriting ratios such as combined, general expenses and claims ratios
as well as other performance measures such as return on equity (“ROE”) and operating return on equity. These measures and other insurance related
terms are defined in the Company’s glossary available on the Intact Financial Corporation web site at www.intactfc.com in the “Investor Relations”
section. Additional information about the Company, including the Annual Information Form, may be found online on SEDAR at www.sedar.com.

More Related Content

What's hot

Investor Presentation September 2014
Investor Presentation September 2014 Investor Presentation September 2014
Investor Presentation September 2014 Intact
 
Investor presentation-march-2016
Investor presentation-march-2016Investor presentation-march-2016
Investor presentation-march-2016Intact
 
Aveda energy investor presentation september 2013
Aveda energy investor presentation september  2013Aveda energy investor presentation september  2013
Aveda energy investor presentation september 2013AvedaEnergy
 
Ifc investor-presentation-(may-2017)
Ifc investor-presentation-(may-2017)Ifc investor-presentation-(may-2017)
Ifc investor-presentation-(may-2017)Intact
 
Ifc investor presentation (may 2017) rev
Ifc investor presentation (may 2017) revIfc investor presentation (may 2017) rev
Ifc investor presentation (may 2017) revIntact
 
IFC investor presentation sept 19, 2011
IFC investor presentation sept 19, 2011IFC investor presentation sept 19, 2011
IFC investor presentation sept 19, 2011mehradahari
 
Investor presentation sept.oct_2010_r
Investor presentation sept.oct_2010_rInvestor presentation sept.oct_2010_r
Investor presentation sept.oct_2010_rIntact
 
Presentation aux investisseurs (anglais seulement) mai 2013
Presentation aux investisseurs (anglais seulement) mai 2013Presentation aux investisseurs (anglais seulement) mai 2013
Presentation aux investisseurs (anglais seulement) mai 2013Intact
 
Ifc investor presentation (march 6 2017)
Ifc investor presentation (march 6 2017)Ifc investor presentation (march 6 2017)
Ifc investor presentation (march 6 2017)Intact
 
Investor presentation february 2015
Investor presentation   february 2015Investor presentation   february 2015
Investor presentation february 2015genworth_financial
 
Investor presentation-march-2016
Investor presentation-march-2016Investor presentation-march-2016
Investor presentation-march-2016Intact
 
Investor Presentation April 2015
Investor Presentation April 2015Investor Presentation April 2015
Investor Presentation April 2015Intact
 
Intact Investor Presentation - June 2010
Intact Investor Presentation - June 2010Intact Investor Presentation - June 2010
Intact Investor Presentation - June 2010Intact
 
Investor presentation may 2012
Investor presentation may 2012Investor presentation may 2012
Investor presentation may 2012Intact
 
Ifc investor-presentation-(november-2016)
Ifc investor-presentation-(november-2016)Ifc investor-presentation-(november-2016)
Ifc investor-presentation-(november-2016)Intact
 
Investor Presentation August 2013
Investor Presentation August 2013Investor Presentation August 2013
Investor Presentation August 2013Intact
 
Investor presentation-november-2014 v001-j60qin
Investor presentation-november-2014 v001-j60qinInvestor presentation-november-2014 v001-j60qin
Investor presentation-november-2014 v001-j60qinIntact
 

What's hot (20)

Investor Presentation September 2014
Investor Presentation September 2014 Investor Presentation September 2014
Investor Presentation September 2014
 
January Investor Presentation
January Investor PresentationJanuary Investor Presentation
January Investor Presentation
 
Investor presentation-march-2016
Investor presentation-march-2016Investor presentation-march-2016
Investor presentation-march-2016
 
Aveda energy investor presentation september 2013
Aveda energy investor presentation september  2013Aveda energy investor presentation september  2013
Aveda energy investor presentation september 2013
 
Investor Day 2013: Aeroplan 2.0
Investor Day 2013: Aeroplan 2.0Investor Day 2013: Aeroplan 2.0
Investor Day 2013: Aeroplan 2.0
 
Ifc investor-presentation-(may-2017)
Ifc investor-presentation-(may-2017)Ifc investor-presentation-(may-2017)
Ifc investor-presentation-(may-2017)
 
Ifc investor presentation (may 2017) rev
Ifc investor presentation (may 2017) revIfc investor presentation (may 2017) rev
Ifc investor presentation (may 2017) rev
 
IFC investor presentation sept 19, 2011
IFC investor presentation sept 19, 2011IFC investor presentation sept 19, 2011
IFC investor presentation sept 19, 2011
 
Investor presentation sept.oct_2010_r
Investor presentation sept.oct_2010_rInvestor presentation sept.oct_2010_r
Investor presentation sept.oct_2010_r
 
Presentation aux investisseurs (anglais seulement) mai 2013
Presentation aux investisseurs (anglais seulement) mai 2013Presentation aux investisseurs (anglais seulement) mai 2013
Presentation aux investisseurs (anglais seulement) mai 2013
 
Ifc investor presentation (march 6 2017)
Ifc investor presentation (march 6 2017)Ifc investor presentation (march 6 2017)
Ifc investor presentation (march 6 2017)
 
Investor presentation february 2015
Investor presentation   february 2015Investor presentation   february 2015
Investor presentation february 2015
 
Investor presentation-march-2016
Investor presentation-march-2016Investor presentation-march-2016
Investor presentation-march-2016
 
Investor Presentation April 2015
Investor Presentation April 2015Investor Presentation April 2015
Investor Presentation April 2015
 
Intact Investor Presentation - June 2010
Intact Investor Presentation - June 2010Intact Investor Presentation - June 2010
Intact Investor Presentation - June 2010
 
Investor presentation may 2012
Investor presentation may 2012Investor presentation may 2012
Investor presentation may 2012
 
Ifc investor-presentation-(november-2016)
Ifc investor-presentation-(november-2016)Ifc investor-presentation-(november-2016)
Ifc investor-presentation-(november-2016)
 
Investor Presentation August 2013
Investor Presentation August 2013Investor Presentation August 2013
Investor Presentation August 2013
 
February Investor Presentation
February Investor PresentationFebruary Investor Presentation
February Investor Presentation
 
Investor presentation-november-2014 v001-j60qin
Investor presentation-november-2014 v001-j60qinInvestor presentation-november-2014 v001-j60qin
Investor presentation-november-2014 v001-j60qin
 

Viewers also liked

Trupanion June Investor Presentation
Trupanion June Investor PresentationTrupanion June Investor Presentation
Trupanion June Investor Presentationtrupanion
 
An Introduction to the Investor Advisory Service (Handout)
An Introduction to the Investor Advisory Service (Handout)An Introduction to the Investor Advisory Service (Handout)
An Introduction to the Investor Advisory Service (Handout)Doug Gerlach
 
Trupanion Investor Presentation - August 2016
Trupanion Investor Presentation - August 2016Trupanion Investor Presentation - August 2016
Trupanion Investor Presentation - August 2016trupanion
 
Trupanion investor presentation - September 2016
Trupanion investor presentation - September 2016Trupanion investor presentation - September 2016
Trupanion investor presentation - September 2016trupanion
 
MSLGROUP Global Institutional Investors Insight Report 2014
MSLGROUP Global Institutional Investors Insight Report 2014MSLGROUP Global Institutional Investors Insight Report 2014
MSLGROUP Global Institutional Investors Insight Report 2014MSL
 
Venture Capital and Cleantech: The Wrong Model for Energy Innovation
Venture Capital and Cleantech: The Wrong Model for Energy InnovationVenture Capital and Cleantech: The Wrong Model for Energy Innovation
Venture Capital and Cleantech: The Wrong Model for Energy InnovationTBJ Investments, LLC
 
Symantec investor presentation november 2015 final
Symantec investor presentation november 2015 finalSymantec investor presentation november 2015 final
Symantec investor presentation november 2015 finalInvestorSymantec
 
Investor Day Presentation, Sept 2012
Investor Day Presentation, Sept 2012Investor Day Presentation, Sept 2012
Investor Day Presentation, Sept 2012ADVA
 
Amg investor presentation may 2012
Amg   investor presentation may 2012Amg   investor presentation may 2012
Amg investor presentation may 2012jdiluzio
 
Investor Presentation - September 2014
Investor Presentation - September 2014Investor Presentation - September 2014
Investor Presentation - September 2014Sagegold
 
Social Media & Investor Relations: It’s NOT Oil and Water
Social Media & Investor Relations: It’s NOT Oil and WaterSocial Media & Investor Relations: It’s NOT Oil and Water
Social Media & Investor Relations: It’s NOT Oil and WaterMichael Pranikoff
 
10 tips on Social Media and Investor Relations - Christian Brosstad, 12th Nor...
10 tips on Social Media and Investor Relations - Christian Brosstad, 12th Nor...10 tips on Social Media and Investor Relations - Christian Brosstad, 12th Nor...
10 tips on Social Media and Investor Relations - Christian Brosstad, 12th Nor...Christian Brosstad
 
Social Media for Investor Relations
Social Media for Investor RelationsSocial Media for Investor Relations
Social Media for Investor RelationsSharon Merrill
 
Investor roadshow presentation
Investor roadshow presentationInvestor roadshow presentation
Investor roadshow presentationTrueBlueInc
 
Symantec investor presentation november 2014 final
Symantec investor presentation november 2014 finalSymantec investor presentation november 2014 final
Symantec investor presentation november 2014 finalInvestorSymantec
 
Symantec investor presentation august 2015 v_final
Symantec investor presentation august 2015 v_finalSymantec investor presentation august 2015 v_final
Symantec investor presentation august 2015 v_finalInvestorSymantec
 
July Investor Presentation
July Investor PresentationJuly Investor Presentation
July Investor PresentationShona_Energy
 

Viewers also liked (20)

Trupanion June Investor Presentation
Trupanion June Investor PresentationTrupanion June Investor Presentation
Trupanion June Investor Presentation
 
Investor relations
Investor relationsInvestor relations
Investor relations
 
An Introduction to the Investor Advisory Service (Handout)
An Introduction to the Investor Advisory Service (Handout)An Introduction to the Investor Advisory Service (Handout)
An Introduction to the Investor Advisory Service (Handout)
 
Investor presentation November 2013
Investor presentation November 2013Investor presentation November 2013
Investor presentation November 2013
 
Trupanion Investor Presentation - August 2016
Trupanion Investor Presentation - August 2016Trupanion Investor Presentation - August 2016
Trupanion Investor Presentation - August 2016
 
Trupanion investor presentation - September 2016
Trupanion investor presentation - September 2016Trupanion investor presentation - September 2016
Trupanion investor presentation - September 2016
 
MSLGROUP Global Institutional Investors Insight Report 2014
MSLGROUP Global Institutional Investors Insight Report 2014MSLGROUP Global Institutional Investors Insight Report 2014
MSLGROUP Global Institutional Investors Insight Report 2014
 
Hancock investor meeting
Hancock investor meetingHancock investor meeting
Hancock investor meeting
 
Venture Capital and Cleantech: The Wrong Model for Energy Innovation
Venture Capital and Cleantech: The Wrong Model for Energy InnovationVenture Capital and Cleantech: The Wrong Model for Energy Innovation
Venture Capital and Cleantech: The Wrong Model for Energy Innovation
 
Symantec investor presentation november 2015 final
Symantec investor presentation november 2015 finalSymantec investor presentation november 2015 final
Symantec investor presentation november 2015 final
 
Investor Day Presentation, Sept 2012
Investor Day Presentation, Sept 2012Investor Day Presentation, Sept 2012
Investor Day Presentation, Sept 2012
 
Amg investor presentation may 2012
Amg   investor presentation may 2012Amg   investor presentation may 2012
Amg investor presentation may 2012
 
Investor Presentation - September 2014
Investor Presentation - September 2014Investor Presentation - September 2014
Investor Presentation - September 2014
 
Social Media & Investor Relations: It’s NOT Oil and Water
Social Media & Investor Relations: It’s NOT Oil and WaterSocial Media & Investor Relations: It’s NOT Oil and Water
Social Media & Investor Relations: It’s NOT Oil and Water
 
10 tips on Social Media and Investor Relations - Christian Brosstad, 12th Nor...
10 tips on Social Media and Investor Relations - Christian Brosstad, 12th Nor...10 tips on Social Media and Investor Relations - Christian Brosstad, 12th Nor...
10 tips on Social Media and Investor Relations - Christian Brosstad, 12th Nor...
 
Social Media for Investor Relations
Social Media for Investor RelationsSocial Media for Investor Relations
Social Media for Investor Relations
 
Investor roadshow presentation
Investor roadshow presentationInvestor roadshow presentation
Investor roadshow presentation
 
Symantec investor presentation november 2014 final
Symantec investor presentation november 2014 finalSymantec investor presentation november 2014 final
Symantec investor presentation november 2014 final
 
Symantec investor presentation august 2015 v_final
Symantec investor presentation august 2015 v_finalSymantec investor presentation august 2015 v_final
Symantec investor presentation august 2015 v_final
 
July Investor Presentation
July Investor PresentationJuly Investor Presentation
July Investor Presentation
 

Similar to Investor presentation december 2013

Presentation aux investisseurs (anglais seulement) septembre 2013
Presentation aux investisseurs (anglais seulement) septembre 2013Presentation aux investisseurs (anglais seulement) septembre 2013
Presentation aux investisseurs (anglais seulement) septembre 2013Intact
 
Presentation aux investisseurs (anglais seulement) aout 2013
Presentation aux investisseurs (anglais seulement) aout 2013Presentation aux investisseurs (anglais seulement) aout 2013
Presentation aux investisseurs (anglais seulement) aout 2013Intact
 
Investor Presentation May 2013
Investor Presentation May 2013Investor Presentation May 2013
Investor Presentation May 2013Intact
 
Investor presentation-february-2015 v001-x550w6
Investor presentation-february-2015 v001-x550w6Investor presentation-february-2015 v001-x550w6
Investor presentation-february-2015 v001-x550w6Intact
 
Présentation aux investisseurs (anglais seulement) novembre 2014
Présentation aux investisseurs (anglais seulement) novembre 2014Présentation aux investisseurs (anglais seulement) novembre 2014
Présentation aux investisseurs (anglais seulement) novembre 2014Intact
 
Investor presentation-may-2015 v001-p70xic
Investor presentation-may-2015 v001-p70xicInvestor presentation-may-2015 v001-p70xic
Investor presentation-may-2015 v001-p70xicIntact
 
Investor presentation-august-2015
Investor presentation-august-2015Investor presentation-august-2015
Investor presentation-august-2015Intact
 
Investor presentation-april-2016
Investor presentation-april-2016Investor presentation-april-2016
Investor presentation-april-2016Intact
 
Ifc investor-presentation-(september-2016)
Ifc investor-presentation-(september-2016)Ifc investor-presentation-(september-2016)
Ifc investor-presentation-(september-2016)Intact
 
Investor Presentation June 2016
Investor Presentation June 2016Investor Presentation June 2016
Investor Presentation June 2016Intact
 
Ifc investor presentation (nov 2017)
Ifc investor presentation (nov 2017)Ifc investor presentation (nov 2017)
Ifc investor presentation (nov 2017)Intact
 
Ifc investor-presentation-(aug-2017)
Ifc investor-presentation-(aug-2017)Ifc investor-presentation-(aug-2017)
Ifc investor-presentation-(aug-2017)Intact
 
Ifc investor-presentation-(may-2018)
Ifc investor-presentation-(may-2018)Ifc investor-presentation-(may-2018)
Ifc investor-presentation-(may-2018)Intact
 
Ifc investor-presentation-(may-2018)-revised
Ifc investor-presentation-(may-2018)-revisedIfc investor-presentation-(may-2018)-revised
Ifc investor-presentation-(may-2018)-revisedIntact
 
Ifc investor presentation (march 6 2017)
Ifc investor presentation (march 6 2017)Ifc investor presentation (march 6 2017)
Ifc investor presentation (march 6 2017)Intact
 
Canadian Asset Managers - Initiation Report
Canadian Asset Managers - Initiation ReportCanadian Asset Managers - Initiation Report
Canadian Asset Managers - Initiation ReportKevin Cheng, CFA
 
Ifc investor-presentation-(feb-2018)-final-v2
Ifc investor-presentation-(feb-2018)-final-v2Ifc investor-presentation-(feb-2018)-final-v2
Ifc investor-presentation-(feb-2018)-final-v2Intact
 
Genworth MI Canada Investor Presentation September 2014
Genworth MI Canada Investor Presentation September 2014Genworth MI Canada Investor Presentation September 2014
Genworth MI Canada Investor Presentation September 2014genworth_financial
 
Investor presentation sept.oct_2010_r
Investor presentation sept.oct_2010_rInvestor presentation sept.oct_2010_r
Investor presentation sept.oct_2010_rIntact
 
Bajaj Finserv - A Quality Insurance Company (Retail Report)
Bajaj Finserv - A Quality Insurance Company (Retail Report)Bajaj Finserv - A Quality Insurance Company (Retail Report)
Bajaj Finserv - A Quality Insurance Company (Retail Report)HBJ Capital Services Pvt. Ltd
 

Similar to Investor presentation december 2013 (20)

Presentation aux investisseurs (anglais seulement) septembre 2013
Presentation aux investisseurs (anglais seulement) septembre 2013Presentation aux investisseurs (anglais seulement) septembre 2013
Presentation aux investisseurs (anglais seulement) septembre 2013
 
Presentation aux investisseurs (anglais seulement) aout 2013
Presentation aux investisseurs (anglais seulement) aout 2013Presentation aux investisseurs (anglais seulement) aout 2013
Presentation aux investisseurs (anglais seulement) aout 2013
 
Investor Presentation May 2013
Investor Presentation May 2013Investor Presentation May 2013
Investor Presentation May 2013
 
Investor presentation-february-2015 v001-x550w6
Investor presentation-february-2015 v001-x550w6Investor presentation-february-2015 v001-x550w6
Investor presentation-february-2015 v001-x550w6
 
Présentation aux investisseurs (anglais seulement) novembre 2014
Présentation aux investisseurs (anglais seulement) novembre 2014Présentation aux investisseurs (anglais seulement) novembre 2014
Présentation aux investisseurs (anglais seulement) novembre 2014
 
Investor presentation-may-2015 v001-p70xic
Investor presentation-may-2015 v001-p70xicInvestor presentation-may-2015 v001-p70xic
Investor presentation-may-2015 v001-p70xic
 
Investor presentation-august-2015
Investor presentation-august-2015Investor presentation-august-2015
Investor presentation-august-2015
 
Investor presentation-april-2016
Investor presentation-april-2016Investor presentation-april-2016
Investor presentation-april-2016
 
Ifc investor-presentation-(september-2016)
Ifc investor-presentation-(september-2016)Ifc investor-presentation-(september-2016)
Ifc investor-presentation-(september-2016)
 
Investor Presentation June 2016
Investor Presentation June 2016Investor Presentation June 2016
Investor Presentation June 2016
 
Ifc investor presentation (nov 2017)
Ifc investor presentation (nov 2017)Ifc investor presentation (nov 2017)
Ifc investor presentation (nov 2017)
 
Ifc investor-presentation-(aug-2017)
Ifc investor-presentation-(aug-2017)Ifc investor-presentation-(aug-2017)
Ifc investor-presentation-(aug-2017)
 
Ifc investor-presentation-(may-2018)
Ifc investor-presentation-(may-2018)Ifc investor-presentation-(may-2018)
Ifc investor-presentation-(may-2018)
 
Ifc investor-presentation-(may-2018)-revised
Ifc investor-presentation-(may-2018)-revisedIfc investor-presentation-(may-2018)-revised
Ifc investor-presentation-(may-2018)-revised
 
Ifc investor presentation (march 6 2017)
Ifc investor presentation (march 6 2017)Ifc investor presentation (march 6 2017)
Ifc investor presentation (march 6 2017)
 
Canadian Asset Managers - Initiation Report
Canadian Asset Managers - Initiation ReportCanadian Asset Managers - Initiation Report
Canadian Asset Managers - Initiation Report
 
Ifc investor-presentation-(feb-2018)-final-v2
Ifc investor-presentation-(feb-2018)-final-v2Ifc investor-presentation-(feb-2018)-final-v2
Ifc investor-presentation-(feb-2018)-final-v2
 
Genworth MI Canada Investor Presentation September 2014
Genworth MI Canada Investor Presentation September 2014Genworth MI Canada Investor Presentation September 2014
Genworth MI Canada Investor Presentation September 2014
 
Investor presentation sept.oct_2010_r
Investor presentation sept.oct_2010_rInvestor presentation sept.oct_2010_r
Investor presentation sept.oct_2010_r
 
Bajaj Finserv - A Quality Insurance Company (Retail Report)
Bajaj Finserv - A Quality Insurance Company (Retail Report)Bajaj Finserv - A Quality Insurance Company (Retail Report)
Bajaj Finserv - A Quality Insurance Company (Retail Report)
 

Recently uploaded

AfRESFullPaper22018EmpiricalPerformanceofRealEstateInvestmentTrustsandShareho...
AfRESFullPaper22018EmpiricalPerformanceofRealEstateInvestmentTrustsandShareho...AfRESFullPaper22018EmpiricalPerformanceofRealEstateInvestmentTrustsandShareho...
AfRESFullPaper22018EmpiricalPerformanceofRealEstateInvestmentTrustsandShareho...yordanosyohannes2
 
Call Girls Near Golden Tulip Essential Hotel, New Delhi 9873777170
Call Girls Near Golden Tulip Essential Hotel, New Delhi 9873777170Call Girls Near Golden Tulip Essential Hotel, New Delhi 9873777170
Call Girls Near Golden Tulip Essential Hotel, New Delhi 9873777170Sonam Pathan
 
Classical Theory of Macroeconomics by Adam Smith
Classical Theory of Macroeconomics by Adam SmithClassical Theory of Macroeconomics by Adam Smith
Classical Theory of Macroeconomics by Adam SmithAdamYassin2
 
call girls in Nand Nagri (DELHI) 🔝 >༒9953330565🔝 genuine Escort Service 🔝✔️✔️
call girls in  Nand Nagri (DELHI) 🔝 >༒9953330565🔝 genuine Escort Service 🔝✔️✔️call girls in  Nand Nagri (DELHI) 🔝 >༒9953330565🔝 genuine Escort Service 🔝✔️✔️
call girls in Nand Nagri (DELHI) 🔝 >༒9953330565🔝 genuine Escort Service 🔝✔️✔️9953056974 Low Rate Call Girls In Saket, Delhi NCR
 
Vp Girls near me Delhi Call Now or WhatsApp
Vp Girls near me Delhi Call Now or WhatsAppVp Girls near me Delhi Call Now or WhatsApp
Vp Girls near me Delhi Call Now or WhatsAppmiss dipika
 
Call Girls Near Delhi Pride Hotel, New Delhi|9873777170
Call Girls Near Delhi Pride Hotel, New Delhi|9873777170Call Girls Near Delhi Pride Hotel, New Delhi|9873777170
Call Girls Near Delhi Pride Hotel, New Delhi|9873777170Sonam Pathan
 
NO1 WorldWide Love marriage specialist baba ji Amil Baba Kala ilam powerful v...
NO1 WorldWide Love marriage specialist baba ji Amil Baba Kala ilam powerful v...NO1 WorldWide Love marriage specialist baba ji Amil Baba Kala ilam powerful v...
NO1 WorldWide Love marriage specialist baba ji Amil Baba Kala ilam powerful v...Amil baba
 
The Triple Threat | Article on Global Resession | Harsh Kumar
The Triple Threat | Article on Global Resession | Harsh KumarThe Triple Threat | Article on Global Resession | Harsh Kumar
The Triple Threat | Article on Global Resession | Harsh KumarHarsh Kumar
 
Lundin Gold April 2024 Corporate Presentation v4.pdf
Lundin Gold April 2024 Corporate Presentation v4.pdfLundin Gold April 2024 Corporate Presentation v4.pdf
Lundin Gold April 2024 Corporate Presentation v4.pdfAdnet Communications
 
Call Girls Near Me WhatsApp:+91-9833363713
Call Girls Near Me WhatsApp:+91-9833363713Call Girls Near Me WhatsApp:+91-9833363713
Call Girls Near Me WhatsApp:+91-9833363713Sonam Pathan
 
OAT_RI_Ep19 WeighingTheRisks_Apr24_TheYellowMetal.pptx
OAT_RI_Ep19 WeighingTheRisks_Apr24_TheYellowMetal.pptxOAT_RI_Ep19 WeighingTheRisks_Apr24_TheYellowMetal.pptx
OAT_RI_Ep19 WeighingTheRisks_Apr24_TheYellowMetal.pptxhiddenlevers
 
VIP Kolkata Call Girl Serampore 👉 8250192130 Available With Room
VIP Kolkata Call Girl Serampore 👉 8250192130  Available With RoomVIP Kolkata Call Girl Serampore 👉 8250192130  Available With Room
VIP Kolkata Call Girl Serampore 👉 8250192130 Available With Roomdivyansh0kumar0
 
fca-bsps-decision-letter-redacted (1).pdf
fca-bsps-decision-letter-redacted (1).pdffca-bsps-decision-letter-redacted (1).pdf
fca-bsps-decision-letter-redacted (1).pdfHenry Tapper
 
Stock Market Brief Deck for 4/24/24 .pdf
Stock Market Brief Deck for 4/24/24 .pdfStock Market Brief Deck for 4/24/24 .pdf
Stock Market Brief Deck for 4/24/24 .pdfMichael Silva
 
Governor Olli Rehn: Dialling back monetary restraint
Governor Olli Rehn: Dialling back monetary restraintGovernor Olli Rehn: Dialling back monetary restraint
Governor Olli Rehn: Dialling back monetary restraintSuomen Pankki
 
How Automation is Driving Efficiency Through the Last Mile of Reporting
How Automation is Driving Efficiency Through the Last Mile of ReportingHow Automation is Driving Efficiency Through the Last Mile of Reporting
How Automation is Driving Efficiency Through the Last Mile of ReportingAggregage
 
(办理原版一样)QUT毕业证昆士兰科技大学毕业证学位证留信学历认证成绩单补办
(办理原版一样)QUT毕业证昆士兰科技大学毕业证学位证留信学历认证成绩单补办(办理原版一样)QUT毕业证昆士兰科技大学毕业证学位证留信学历认证成绩单补办
(办理原版一样)QUT毕业证昆士兰科技大学毕业证学位证留信学历认证成绩单补办fqiuho152
 
Stock Market Brief Deck for "this does not happen often".pdf
Stock Market Brief Deck for "this does not happen often".pdfStock Market Brief Deck for "this does not happen often".pdf
Stock Market Brief Deck for "this does not happen often".pdfMichael Silva
 
Independent Lucknow Call Girls 8923113531WhatsApp Lucknow Call Girls make you...
Independent Lucknow Call Girls 8923113531WhatsApp Lucknow Call Girls make you...Independent Lucknow Call Girls 8923113531WhatsApp Lucknow Call Girls make you...
Independent Lucknow Call Girls 8923113531WhatsApp Lucknow Call Girls make you...makika9823
 

Recently uploaded (20)

AfRESFullPaper22018EmpiricalPerformanceofRealEstateInvestmentTrustsandShareho...
AfRESFullPaper22018EmpiricalPerformanceofRealEstateInvestmentTrustsandShareho...AfRESFullPaper22018EmpiricalPerformanceofRealEstateInvestmentTrustsandShareho...
AfRESFullPaper22018EmpiricalPerformanceofRealEstateInvestmentTrustsandShareho...
 
Call Girls Near Golden Tulip Essential Hotel, New Delhi 9873777170
Call Girls Near Golden Tulip Essential Hotel, New Delhi 9873777170Call Girls Near Golden Tulip Essential Hotel, New Delhi 9873777170
Call Girls Near Golden Tulip Essential Hotel, New Delhi 9873777170
 
Classical Theory of Macroeconomics by Adam Smith
Classical Theory of Macroeconomics by Adam SmithClassical Theory of Macroeconomics by Adam Smith
Classical Theory of Macroeconomics by Adam Smith
 
call girls in Nand Nagri (DELHI) 🔝 >༒9953330565🔝 genuine Escort Service 🔝✔️✔️
call girls in  Nand Nagri (DELHI) 🔝 >༒9953330565🔝 genuine Escort Service 🔝✔️✔️call girls in  Nand Nagri (DELHI) 🔝 >༒9953330565🔝 genuine Escort Service 🔝✔️✔️
call girls in Nand Nagri (DELHI) 🔝 >༒9953330565🔝 genuine Escort Service 🔝✔️✔️
 
Vp Girls near me Delhi Call Now or WhatsApp
Vp Girls near me Delhi Call Now or WhatsAppVp Girls near me Delhi Call Now or WhatsApp
Vp Girls near me Delhi Call Now or WhatsApp
 
Call Girls Near Delhi Pride Hotel, New Delhi|9873777170
Call Girls Near Delhi Pride Hotel, New Delhi|9873777170Call Girls Near Delhi Pride Hotel, New Delhi|9873777170
Call Girls Near Delhi Pride Hotel, New Delhi|9873777170
 
NO1 WorldWide Love marriage specialist baba ji Amil Baba Kala ilam powerful v...
NO1 WorldWide Love marriage specialist baba ji Amil Baba Kala ilam powerful v...NO1 WorldWide Love marriage specialist baba ji Amil Baba Kala ilam powerful v...
NO1 WorldWide Love marriage specialist baba ji Amil Baba Kala ilam powerful v...
 
The Triple Threat | Article on Global Resession | Harsh Kumar
The Triple Threat | Article on Global Resession | Harsh KumarThe Triple Threat | Article on Global Resession | Harsh Kumar
The Triple Threat | Article on Global Resession | Harsh Kumar
 
Lundin Gold April 2024 Corporate Presentation v4.pdf
Lundin Gold April 2024 Corporate Presentation v4.pdfLundin Gold April 2024 Corporate Presentation v4.pdf
Lundin Gold April 2024 Corporate Presentation v4.pdf
 
Call Girls Near Me WhatsApp:+91-9833363713
Call Girls Near Me WhatsApp:+91-9833363713Call Girls Near Me WhatsApp:+91-9833363713
Call Girls Near Me WhatsApp:+91-9833363713
 
OAT_RI_Ep19 WeighingTheRisks_Apr24_TheYellowMetal.pptx
OAT_RI_Ep19 WeighingTheRisks_Apr24_TheYellowMetal.pptxOAT_RI_Ep19 WeighingTheRisks_Apr24_TheYellowMetal.pptx
OAT_RI_Ep19 WeighingTheRisks_Apr24_TheYellowMetal.pptx
 
VIP Kolkata Call Girl Serampore 👉 8250192130 Available With Room
VIP Kolkata Call Girl Serampore 👉 8250192130  Available With RoomVIP Kolkata Call Girl Serampore 👉 8250192130  Available With Room
VIP Kolkata Call Girl Serampore 👉 8250192130 Available With Room
 
fca-bsps-decision-letter-redacted (1).pdf
fca-bsps-decision-letter-redacted (1).pdffca-bsps-decision-letter-redacted (1).pdf
fca-bsps-decision-letter-redacted (1).pdf
 
Stock Market Brief Deck for 4/24/24 .pdf
Stock Market Brief Deck for 4/24/24 .pdfStock Market Brief Deck for 4/24/24 .pdf
Stock Market Brief Deck for 4/24/24 .pdf
 
Governor Olli Rehn: Dialling back monetary restraint
Governor Olli Rehn: Dialling back monetary restraintGovernor Olli Rehn: Dialling back monetary restraint
Governor Olli Rehn: Dialling back monetary restraint
 
How Automation is Driving Efficiency Through the Last Mile of Reporting
How Automation is Driving Efficiency Through the Last Mile of ReportingHow Automation is Driving Efficiency Through the Last Mile of Reporting
How Automation is Driving Efficiency Through the Last Mile of Reporting
 
(办理原版一样)QUT毕业证昆士兰科技大学毕业证学位证留信学历认证成绩单补办
(办理原版一样)QUT毕业证昆士兰科技大学毕业证学位证留信学历认证成绩单补办(办理原版一样)QUT毕业证昆士兰科技大学毕业证学位证留信学历认证成绩单补办
(办理原版一样)QUT毕业证昆士兰科技大学毕业证学位证留信学历认证成绩单补办
 
Monthly Economic Monitoring of Ukraine No 231, April 2024
Monthly Economic Monitoring of Ukraine No 231, April 2024Monthly Economic Monitoring of Ukraine No 231, April 2024
Monthly Economic Monitoring of Ukraine No 231, April 2024
 
Stock Market Brief Deck for "this does not happen often".pdf
Stock Market Brief Deck for "this does not happen often".pdfStock Market Brief Deck for "this does not happen often".pdf
Stock Market Brief Deck for "this does not happen often".pdf
 
Independent Lucknow Call Girls 8923113531WhatsApp Lucknow Call Girls make you...
Independent Lucknow Call Girls 8923113531WhatsApp Lucknow Call Girls make you...Independent Lucknow Call Girls 8923113531WhatsApp Lucknow Call Girls make you...
Independent Lucknow Call Girls 8923113531WhatsApp Lucknow Call Girls make you...
 

Investor presentation december 2013

  • 1. Intact Financial Corporation Continuing our journey to build a world-class P&C insurer Investor Presentation December 2013 (TSX: IFC)
  • 2. Canada’s P&C insurance leader Leader in a fragmented industry Industry outperformer Distinct brandsWho we are1 • Largest P&C insurer in Canada • $7 billion in direct premiums written • #1 in BC, Alberta, Ontario, Quebec, Nova Scotia • $12.3 billion cash and invested assets • Proven industry consolidator Premium growth Combined ratio3 Return on equity4 4.2 pts 3.2 pts 8.5 pts 10-year performance – IFC vs. P&C industry2 2012 Direct premiums written2 ($ billions) Top five insurers represent 44% of the market 1 IFC’s direct premiums written in 2012 is pro forma Jevco for a full year 2 Industry data source: MSA Research excluding Lloyd’s, ICBC, SGI, SAF, MPI, Genworth and IFC. All data as at Dec 31, 2012. 3 Combined ratio includes the market yield adjustment (MYA) 4 ROEs reflect IFRS beginning in 2010. Since 2011, IFC's ROE is adjusted return on common shareholders' equity (AROE) 7.2 3.6 2.9 2.7 2.2 Intact Aviva Canada RSA Canada TD Insurance Co-operators Estimated Market Share 17.1% 8.5% 7.0% 6.5% 5.2% 2
  • 3. Consistent industry outperformance 3 Significant scale advantage Sophisticated pricing and underwriting Multi- channel distribution Proven acquisition strategy In-house claims expertise Broker relationships Solid investment returns Industry data source: MSA Research excluding Lloyd’s, ICBC, SGI, SAF, MPI, Genworth and IFC Data in five-year chart is for the period ended December 31, 2012 Includes market yield adjustment (MYA) Five-year average loss ratios2012 metrics 96.7% 93.4% Combined Ratio 76.5% 67.9% 63.7% 69.2% 67.7% 58.1% Auto Personal Property Commercial P&C Industry IFC 10.6% 16.5% ROE Industry IFC
  • 4. A strong base from which to grow 4 Strong capacity to outperformEnhanced business mix Geography FY2010 FY2012 Ontario 46% 40% Quebec 25% 30% Alberta 18% 17% Rest of Canada 11% 13% Return on Equity YTD-2013 IFC3 10.1% Industry Benchmark2 3.3% Outperformance 6.8 pts 1 Includes MYA 2 Industry data source: MSA Research. Generally consists of the 20 largest companies, excluding Lloyd’s, Genworth, FM Global and IFC 3 IFC’s ROE corresponds to the adjusted return on equity (AROE) Year to date as at September 30, 2013 Note: Change in business mix reflects the acquisitions of AXA Canada and Jevco Line of business FY2010 FY2012 Personal Auto 50% 45% Personal Property 24% 23% Commercial 26% 32% Combined Ratio1 YTD-2013 IFC 97.2% Industry Benchmark2 102.8% Outperformance 5.6 pts
  • 5. Canadian P&C industry 12-month outlook 5 We remain well-positioned to continue outperforming the Canadian P&C insurance industry in the current environment Premium growth Return on equity • We expect the active summer catastrophe season to meaningfully accelerate the hard market conditions in property. • We believe the elevated level of catastrophes in recent months will negatively impact the loss ratio in commercial lines and could translate into firmer conditions over time. • Industry premiums are likely to increase at a low single-digit rate, with low single-digit growth in personal auto and commercial lines and upper single-digit growth in personal property. • The expected Ontario auto rate reductions in 2014-2015 are likely to have a larger impact on premium growth in 2015 than in 2014. We expect premium reductions to be commensurate with cost reductions and, as such, we do not foresee material margin deterioration. Underwriting • We do not expect the industry’s ROE to reach its long term average of 10% in 2013. • We believe we will outperform the industry’s ROE by at least 500 basis points in the next 12 months.
  • 6. Beat industry ROE by 5 points every year Pricing & Segmentation: 2 points Claims management: 3 points Investments and capital management: 2 points Total: 7 points Leaves 2 points to reinvest in customer experience (price, product, service, brand) NOIPS growth of 10% per year over time Organic growth: 4-6% Margin improvement: 0-3% Capital management/deployment: 2-4% A 36-month roadmap for outperformance 6
  • 7. Strong financial foundation for growth 7 • $515 million in total excess capital • MCT of 199% • Debt-to-capital ratio of 19%, below our target level of 20% • Low sensitivity to capital markets volatility: - 1% increase in rates ~ 3 pts of MCT - 10% decline in equity markets ~ 4 pts of MCT • Credit ratings: Solid balance sheet$12.3 billion – conservatively managed A.M. Best Moody’s1 DBRS Long-term issuer credit ratings of IFC a- Baa1 A (low) IFC’s principal insurance subsidiaries2 A+ A1 n/a * As of September 30, 2013 1 Jevco and companies previously held by AXA Canada are not rated by Moody’s. 2 On April 25, 2013, A.M. Best upgraded the financial strength rating of Jevco to ‘A+’ (Superior) from ‘A’ (Excellent) and revised the outlook to stable. Note: Investment mix is net of hedging positions and financial liabilities related to investments. • 99% of fixed-income securities are rated ‘A’ or better • 96% of preferred shares are rated ‘P1’ or ‘P2’ • Minimal European exposure • No leveraged investments Fixed-income securities, 71%Common shares, 11% Preferred shares, 9% Cash and short- term notes, 5% Loans, 4%
  • 8. Strategic capital management 8 • We have increased our dividend each year since our IPO Shareholder friendly approachCapital management framework Strong capital base has allowed us to pursue our growth objectives while returning capital to shareholders Maintain leverage ratio (target 20% debt to total capital) Maintain existing dividends Increase dividends Invest in growth initiatives Share buybacks $0.163 $0.25 $0.27 $0.31 $0.32 $0.34 $0.37 $0.40 $0.44 - 0.05 0.10 0.15 0.20 0.25 0.30 0.35 0.40 0.45 0.50 2005 2006 2007 2008 2009 2010 2011 2012 Q3-13 Quarterlydividendpershare • We believe we have organic growth opportunities within our multi-brand offering • We have a track record of 13 accretive acquisitions, the most recent being AXA Canada and Jevco • We have returned over $1.2 billion to shareholders in the form of buybacks in the past five years
  • 9. Four distinct avenues for growth Consolidate Canadian market (0-5 years) Expand beyond existing markets (0-5+ years) Develop existing platforms (0-3 years)Firming market conditions (0-2 years) Capital • Solid financial position Strategy • Grow areas where IFC has a competitive advantage Opportunities • Canadian P&C industry remains fragmented • Global capital requirements becoming more stringent • Continued difficulties in global capital markets Principle • Build organic growth pipeline with meaningful impact within 5+ years Strategy • Enter new market by leveraging our world-class strengths: 1) pricing and segmentation, 2) claims management and 3) online expertise • Continue to expand support to our broker partners • Leverage addition of AXA Canada and Jevco products • Expand and grow belairdirect and Grey Power • Build a broker offer better able to compete with direct writers 9 Personal lines • Build on outperformance in auto to accelerate growth • Industry premiums likely to be bolstered by hard market conditions in personal property Commercial lines • Leverage acquired expertise and products, and our industry outperformance to gain share in a firming environment
  • 10. 10 Integrations are on track Jevco – closed September 2012AXA Canada – closed September 2011 • Integration of AXA Canada continues to progress very well and nearing completion • Almost all policies have been converted and we are focused on decommissioning the AXA systems • Continue to target $100 million in annual after-tax synergies by early 2014 − $89 million synergies run-rate at September 30, 2013 • IRR estimated above 23% • Continuing to convert policies into IFC systems • Retention has been good and we are working to re-underwrite portions of the portfolio, where required • We expect to reach a $15 million run- rate in after-tax synergies by the end of 2013, and $23 million by end of 2014 • IRR estimated above 20%
  • 11. Building on our sustainable competitive advantages 11 We have a sustainable competitive advantage versus the industry due to our disciplined approach and quality operations We remain committed to adapting products to suit consumers’ needs We continue our shareholder-friendly approach to capital management Our solid financial position enables us to take advantage of growth opportunities which may present themselves in a consolidating industry Best-in-class team in place to reach our goals
  • 13. P&C insurance – a $42 billion market in Canada 13 Industry DPW by line of business3% of GDP in Canada Industry – premiums by province • Fragmented market1: – Top five represent 44%, versus bank/lifeco markets which are closer to 65-75% – IFC is largest player with approx. 17% market share, versus largest bank/lifeco with 22-25% market share – P&C insurance shares the same regulator as the banks and lifecos • Barriers to entry: scale, regulation, manufacturing capability, market knowledge • Home and commercial insurance rates unregulated; personal auto rates regulated in some provinces • Capital is regulated nationally by OSFI • Brokers continue to own commercial lines and a large share of personal lines in Canada; direct-to- consumer channel is growing (distribution = brokers 67% and direct 33%) • 30-year return on equity for the industry is approximately 10% 1 Pro forma IFC’s acquisition of AXA Canada Industry data source: MSA Research excluding Lloyd’s, ICBC, SAF, SGI, MPI and Genworth. OSFI = Office of the Superintendent of Financial Institutions Canada Data as at the end of 2012. Personal Auto, 41% Personal Property, 21% Commercial P&C and other, 31% Commercial Auto, 7% Ontario, 48% Quebec, 18% Alberta, 16% Other provinces and territories, 18%
  • 14. P&C industry 10-year performance versus IFC 14 Return on equity Direct premiums written growth Combined ratioIFC’s competitive advantages 0% 10% 20% 30% 40% 85% 90% 95% 100% 105% 100 120 140 160 180 200 220 240 • Significant scale advantage • Sophisticated pricing and underwriting discipline • In-house claims expertise • Broker relationships • Solid investment returns • Strong organic growth potential 1Industry data source: MSA Research excluding Lloyd’s, ICBC, SGI, SAF, MPI, Genworth and IFC. All data as at Dec 31, 2012. 2ROEs reflect IFRS beginning in 2010. Since 2011, IFC's ROE is adjusted return on common shareholders' equity (AROE). Industry1 10-year avg. = 11.2% 10-year avg. = 19.6%2 Industry1 10-year avg. = 97.1% 10-year avg. = 93.8% 10-year avg. = 8.4% Industry1 10-year avg. = 4.2%
  • 15. Ontario auto environment 15 Ontario government’s strategy to reduce both rates and costs We outperform the industryOntario mediation backlog • Reduce insurance rates by an average of 15% over 2 years – 3% - 5% by January 2014, 8% by August 2014, for the full 15% by August 2015 • We expect the government to announce some cost reduction measures in the coming months, for implementation in 2014 • We believe the outcome could be margin-neutral and are working with the government to identify and prioritize additional cost reduction options • FSCO assigned all remaining cases in August 2013; industry backlog should be cleared by year-end • Total FSCO arbitrations increased 68% in the first eight months of the year, while IFC has increased only 3% due to our proactive approach • Ontario auto accounts for under one quarter of our direct premiums written • Industry near breakeven in first nine months of 2013 • Continued our solid outperformance versus the industry year to date September 2013
  • 16. Plan for delivering 10 points improvement in personal property 16 0.6% -0.8% -4.0% -3.4% -6.0% -4.3% 104.3% 101.2% 94.6% 93.6% 89.2% 94.7% 8.7% 8.6% 5.9% 13.3% 10.3% 20.3% FY2008 FY2009 FY2010 FY2011 FY2012 YTD-13 PYD CR excl. CAT and PYD CAT 113.6% 109.0% 96.5% 103.5% 93.5% 110.7% • Rates • Limit water coverage • Curtail hail/wind exposure • Tie prevention to pricing • Exposure management: geocoding • National product • Education and prevention • Government co-ordination • Supply chain management Combined Ratio Composition Actions within 12 months
  • 17. 4.2 4.3 4.5 6.7 7.2 3.5 4.0 4.5 5.0 5.5 6.0 6.5 7.0 7.5 33 35 37 39 41 43 45 2008 2009 2010 2011 2012 Industry IFC Further industry consolidation ahead 17 Our track record of acquisitions1 Top 20 P&C insurers = 84% of market Canadian M&A environmentOur acquisition strategy Environment more conducive to acquisitions now than in recent years: • Industry ROEs, although slightly improved from trough levels of mid-2009, are well below prior peak • Foreign parent companies are generally in less favourable capital position • Demutualization likely for P&C insurance industry • Targeting large-scale acquisitions of $500 million or more in direct premiums written • Pursuing acquisitions in lines of business where we have expertise • Acquisition target IRR of 15% • Targets: − Bring loss ratio of acquired book of business to our average loss ratio within 18 to 24 months − Bring expense ratio to 2 pts below IFC ratio 2012 – Jevco ($530 mil.) 2011 – AXA ($2,600 mil.) 2004 – Allianz ($600 mil.) 2001 – Zurich ($510 mil.) 1999 – Pafco ($40 mil.) 1998 – Guardian ($630 mil.) 1997 – Canadian Surety ($30 mil.) 1995 – Wellington ($370 mil.) 1 Direct premiums written in $ billions, including pools, excluding second term of 2-year policies. IFC’s direct premiums written in 2012 is pro forma Jevco for a full year. Industry data source: MSA Research excluding Lloyd’s, ICBC, SGI, SAF, MPI, and Genworth. All data as at Dec 31, 2012.
  • 18. Historical financials 18 IFRS Canadian GAAP (in $ millions, except as otherwise noted) 2012 2011 2010 2009 2008 Income statement highlights Direct written premiums $6,868 $5,099 $4,498 $4,275 $4,146 Underwriting income 451 273 193 54 117 Net operating income (NOI) 675 460 402 282 361 NOIPS to common shareholders (in dollars) 5.00 3.91 3.49 2.35 2.96 Balance sheet highlights Total investments $12,959 $11,828 $8,653 $8,057 $6,605 Debt outstanding 1,143 1,293 496 398 - Total shareholders' equity (excl. AOCI) 4,710 4,135 2,654 3,047 3,079 Performance metrics Loss ratio 61.6% 63.9% 65.4% 70.0% 68.2% Expense ratio 31.5% 30.5% 30.0% 28.7% 28.9% Combined ratio 93.1% 94.4% 95.4% 98.7% 97.1% Operating ROE (excl. AOCI) 16.8% 15.3% 15.1% 9.2% 11.3% Debt / Capital 18.9% 22.9% 14.3% 11.8% - Combined ratios by line of business Personal auto 95.7% 90.9% 98.1% 94.9% 95.9% Personal property 93.5% 103.5% 96.5% 109.0% 113.6% Commercial auto 81.5% 86.5% 86.0% 79.8% 87.2% Commercial P&C 91.6% 95.6% 90.7% 104.1% 85.3%
  • 19. Cash and invested assets 19 Asset class Quality: Approx. 96% rated ‘P1’ or ‘P2’ High-quality, dividend paying Canadian companies. Objective is to capture non-taxable dividend income. Fixed income Quality: 99% of bonds rated ‘A’ or better 100% Canadian * As of September 30, 2013 Preferred shares Geographic exposure of portfolio 100% Canadian Corporate 34% Cdn. federal government and agency 34% Cdn. provincial and municipal 26% Supra-National & Foreign 4% ABS/MBS 2% TOTAL 100% Perpetual and callable floating and reset 66.6% Fixed-rate perpetual 24.7% Retractable 8.7% TOTAL 100.0% Canadian 94.2% United States 2.4% Int’l (excl. U.S.) 3.4% TOTAL 100% Common shares
  • 20. Track record of prudent reserving practices 20 3.3% 7.9% 4.9% 2.9% 4.0% 3.2% 4.8% 4.9% 5.7% 0% 1% 2% 3% 4% 5% 6% 7% 8% 9% 2004 2005 2006 2007 2008 2009 2010 2011 2012 • Quarterly and annual fluctuations in reserve development are normal • 2005 reserve development was unusually high due to the favourable effects of certain auto insurance reforms • This reflects our preference to take a conservative approach to establishing claims reserves Rate of claims reserve development (favourable prior year development as a % of opening reserves)
  • 21. Investor Relations contact information 21 Vice President, Investor Relations Phone: 416.344.8004 Cell: 416.797.7828 Email: Dennis.Westfall@intact.net Manager, Investor Relations Phone: 416.341.1464 ext 45153 Email: Maida.Sit@intact.net Email: ir@intact.net Phone: 416.941.5336 or 1.866.778.0774 (toll-free within North America) Fax: 416.941.0006 Corporate Website: http://www.intactfc.com Maida Sit, CFADennis Westfall, CFA General Contact Info
  • 22. Forward looking statements and disclaimer 22 Certain of the statements included in this presentation about the Company’s current and future plans, expectations and intentions, results, levels of activity, performance, goals or achievements or any other future events or developments constitute forward-looking statements. The words “may”, “will”, “would”, “should”, “could”, “expects”, “plans”, “intends”, “trends”, “indications”, “anticipates”, “believes”, “estimates”, “predicts”, “likely”, “potential” or the negative or other variations of these words or other similar or comparable words or phrases, are intended to identify forward-looking statements. Forward-looking statements are based on estimates and assumptions made by management based on management’s experience and perception of historical trends, current conditions and expected future developments, as well as other factors that management believes are appropriate in the circumstances. Many factors could cause the Company’s actual results, performance or achievements or future events or developments to differ materially from those expressed or implied by the forward- looking statements, including, without limitation, the following factors: the Company’s ability to implement its strategy or operate its business as management currently expects; its ability to accurately assess the risks associated with the insurance policies that the Company writes; unfavourable capital market developments or other factors which may affect the Company’s investments and funding obligations under its pension plans; the cyclical nature of the P&C insurance industry; management’s ability to accurately predict future claims frequency; government regulations designed to protect policyholders and creditors rather than investors; litigation and regulatory actions; periodic negative publicity regarding the insurance industry; intense competition; the Company’s reliance on brokers and third parties to sell its products to clients; the Company’s ability to successfully pursue its acquisition strategy; the Company’s ability to execute its business strategy; the terms and conditions of, and regulatory approvals relating to, the integration of Jevco; various other actions to be taken or requirements to be met in connection with the Jevco acquisition and integrating the Company and Jevco; synergies arising from, and the Company’s integration plans relating to the AXA Canada and Jevco acquisitions; management's estimates and expectations in relation to resulting accretion, IRR and debt-to-capital ratio since closing of the AXA Canada and Jevco acquisitions; actions to be taken or requirements to be met in connection with the AXA Canada acquisition and integrating the Company and AXA Canada; the Company’s participation in the Facility Association (a mandatory pooling arrangement among all industry participants) and similar mandated risk-sharing pools; terrorist attacks and ensuing events; the occurrence of catastrophic events; the Company’s ability to maintain its financial strength and issuer credit ratings; access to debt financing and the Company's ability to compete for large commercial business; the Company’s ability to alleviate risk through reinsurance; the Company’s ability to successfully manage credit risk (including credit risk related to the financial health of reinsurers); the Company’s reliance on information technology and telecommunications systems; the Company’s dependence on key employees; changes in laws or regulations; general economic, financial and political conditions; the Company’s dependence on the results of operations of its subsidiaries; the volatility of the stock market and other factors affecting the Company’s share price; and future sales of a substantial number of its common shares. All of the forward-looking statements included in this presentation are qualified by these cautionary statements and those made in the “Risk management” section of our MD&A for the year ended December 31, 2012. These factors are not intended to represent a complete list of the factors that could affect the Company. These factors should, however, be considered carefully. Although the forward-looking statements are based upon what management believes to be reasonable assumptions, the Company cannot assure investors that actual results will be consistent with these forward-looking statements. When relying on forward- looking statements to make decisions, investors should ensure the preceding information is carefully considered. Undue reliance should not be placed on forward-looking statements made herein. The Company and management have no intention and undertake no obligation to update or revise any forward- looking statements, whether as a result of new information, future events or otherwise, except as required by law.
  • 23. Forward looking statements and disclaimer 23 Disclaimer This Presentation does not constitute or form part of any offer for sale or solicitation of any offer to buy or subscribe for any securities nor shall it or any part of it form the basis of or be relied on in connection with, or act as any inducement to enter into, any contract or commitment whatsoever. The information contained in this Presentation concerning the Company does not purport to be all-inclusive or to contain all the information that a prospective purchaser or investor may desire to have in evaluating whether or not to make an investment in the Company. The information is qualified entirely by reference to the Company’s publicly disclosed information. No representation or warranty, express or implied, is made or given by or on behalf of the Company or any of its the directors, officers or employees as to the accuracy, completeness or fairness of the information or opinions contained in this Presentation and no responsibility or liability is accepted by any person for such information or opinions. In furnishing this Presentation, the Company does not undertake or agree to any obligation to provide the attendees with access to any additional information or to update this Presentation or to correct any inaccuracies in, or omissions from, this Presentation that may become apparent. The information and opinions contained in this Presentation are provided as at the date of this Presentation. The contents of this Presentation are not to be construed as legal, financial or tax advice. Each prospective purchaser should contact his, her or its own legal adviser, independent financial adviser or tax adviser for legal, financial or tax advice. The Company uses both International Financial Reporting Standards (“IFRS”) and certain non-IFRS measures to assess performance. Non-IFRS measures do not have any standardized meaning prescribed by IFRS and are unlikely to be comparable to any similar measures presented by other companies. Management of the Company analyzes performance based on underwriting ratios such as combined, general expenses and claims ratios as well as other performance measures such as return on equity (“ROE”) and operating return on equity. These measures and other insurance related terms are defined in the Company’s glossary available on the Intact Financial Corporation web site at www.intactfc.com in the “Investor Relations” section. Additional information about the Company, including the Annual Information Form, may be found online on SEDAR at www.sedar.com.