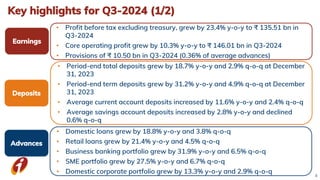
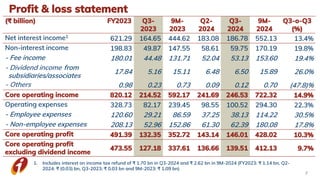
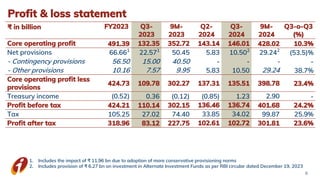
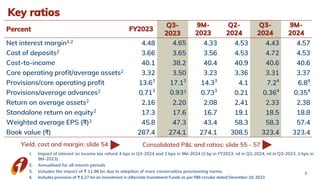
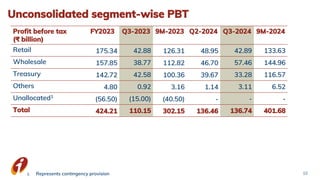
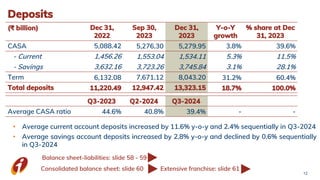
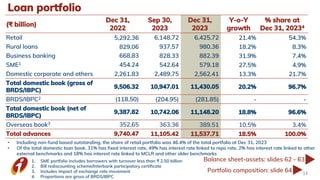
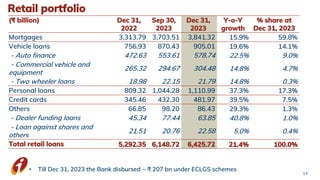
2. 2
Certain statements in this release relating to a future period of time (including inter alia concerning our
future business plans or growth prospects) are forward-looking statements intended to qualify for the 'safe
harbor' under applicable securities laws including the US Private Securities Litigation Reform Act of 1995.
Such forward-looking statements involve a number of risks and uncertainties that could cause actual
results to differ materially from those in such forward-looking statements. These risks and uncertainties
include, but are not limited to statutory and regulatory changes, international economic and business
conditions; political or economic instability in the jurisdictions where we have operations, increase in non-
performing loans, unanticipated changes in interest rates, foreign exchange rates, equity prices or other
rates or prices, our growth and expansion in business, the adequacy of our allowance for credit losses, the
actual growth in demand for banking products and services, investment income, cash flow projections, our
exposure to market risks, changes in India’s sovereign rating, as well as other risks detailed in the reports
filed by us with the United States Securities and Exchange Commission. Any forward-looking statements
contained herein are based on assumptions that we believe to be reasonable as of the date of this release.
ICICI Bank undertakes no obligation to update forward-looking statements to reflect events or
circumstances after the date thereof. Additional risks that could affect our future operating results are more
fully described in our filings with the United States Securities and Exchange Commission. These filings are
available at www.sec.gov.
4. 4
Key highlights for Q3-2024 (1/2)
• Profit before tax excluding treasury, grew by 23.4% y-o-y to ₹ 135.51 bn in
Q3-2024
• Core operating profit grew by 10.3% y-o-y to ₹ 146.01 bn in Q3-2024
• Provisions of ₹ 10.50 bn in Q3-2024 (0.36% of average advances)
• Period-end total deposits grew by 18.7% y-o-y and 2.9% q-o-q at December
31, 2023
• Period-end term deposits grew by 31.2% y-o-y and 4.9% q-o-q at December
31, 2023
• Average current account deposits increased by 11.6% y-o-y and 2.4% q-o-q
• Average savings account deposits increased by 2.8% y-o-y and declined
0.6% q-o-q
• Domestic loans grew by 18.8% y-o-y and 3.8% q-o-q
• Retail loans grew by 21.4% y-o-y and 4.5% q-o-q
• Business banking portfolio grew by 31.9% y-o-y and 6.5% q-o-q
• SME portfolio grew by 27.5% y-o-y and 6.7% q-o-q
• Domestic corporate portfolio grew by 13.3% y-o-y and 2.9% q-o-q
Earnings
Deposits
Advances
5. 5
Key highlights for Q3-2024 (2/2)
• Net NPA ratio was 0.44% at Dec 31, 2023 (Sep 30, 2023: 0.43%)
• Net additions of ₹ 3.63 bn to gross NPAs in Q3-2024 (Q2-2024: ₹ 1.16 bn)
• Provision coverage was 80.7% at Dec 31, 2023 (Sep 30, 2023: 82.6%)
• Fund based o/s of ₹ 33.18 bn (0.3% of advances) to all standard borrowers
under resolution; provisions of ₹ 10.32 bn held against these borrowers
• Contingency provisions of ₹ 131.00 bn at Dec 31, 2023
• Profit after tax grew by 23.6% y-o-y to ₹ 102.72 bn in Q3-2024
• Common Equity Tier 1 ratio of 16.03%1
1. Including profits for 9M-2024
Asset
quality
Profit after
tax and
capital
12. Deposits
(₹ billion) Dec 31,
2022
Sep 30,
2023
Dec 31,
2023
Y-o-Y
growth
% share at Dec
31, 2023
CASA 5,088.42 5,276.30 5,279.95 3.8% 39.6%
- Current 1,456.26 1,553.04 1,534.11 5.3% 11.5%
- Savings 3,632.16 3,723.26 3,745.84 3.1% 28.1%
Term 6,132.08 7,671.12 8,043.20 31.2% 60.4%
Total deposits 11,220.49 12,947.42 13,323.15 18.7% 100.0%
Q3-2023 Q2-2024 Q3-2024
Average CASA ratio 44.6% 40.8% 39.4% - -
• Average current account deposits increased by 11.6% y-o-y and 2.4% sequentially in Q3-2024
• Average savings account deposits increased by 2.8% y-o-y and declined by 0.6% sequentially
in Q3-2024
Balance sheet-liabilities: slide 58 - 59
Consolidated balance sheet: slide 60 Extensive franchise: slide 61
12
13. Loan portfolio
• Including non-fund based outstanding, the share of retail portfolio was 46.4% of the total portfolio at Dec 31, 2023
• Of the total domestic loan book, 31% has fixed interest rate, 49% has interest rate linked to repo rate, 2% has interest rate linked to other
external benchmarks and 18% has interest rate linked to MCLR and other older benchmarks
Balance sheet-assets: slides 62 - 63
Portfolio composition: slide 64 13
(₹ billion)
Dec 31,
2022
Sep 30,
2023
Dec 31,
2023
Y-o-Y
growth
% share at
Dec 31, 20234
Retail 5,292.36 6,148.72 6,425.72 21.4% 54.3%
Rural loans 829.06 937.57 980.36 18.2% 8.3%
Business banking 668.83 828.33 882.39 31.9% 7.4%
SME1 454.24 542.64 579.18 27.5% 4.9%
Domestic corporate and others 2,261.83 2,489.75 2,562.41 13.3% 21.7%
Total domestic book (gross of
BRDS/IBPC)
9,506.32 10,947.01 11,430.05 20.2% 96.7%
BRDS/IBPC2 (118.50) (204.95) (281.85) - -
Total domestic book (net of
BRDS/IBPC)
9,387.82 10,742.06 11,148.20 18.8% 96.6%
Overseas book3 352.65 363.36 389.51 10.5% 3.4%
Total advances 9,740.47 11,105.42 11,537.71 18.5% 100.0%
1. SME portfolio includes borrowers with turnover less than ₹ 2.50 billion
2. Bill rediscounting scheme/Interbank participatory certificate
3. Includes impact of exchange rate movement
4. Proportions are gross of BRDS/IBPC
14. Retail portfolio
14
• Till Dec 31, 2023 the Bank disbursed ~ ₹ 207 bn under ECLGS schemes
(₹ billion) Dec 31,
2022
Sep 30,
2023
Dec 31,
2023
Y-o-Y
growth
% share at
Dec 31, 2023
Mortgages 3,313.79 3,703.51 3,841.32 15.9% 59.8%
Vehicle loans 756.93 870.43 905.01 19.6% 14.1%
- Auto finance 472.63 553.61 578.74 22.5% 9.0%
- Commercial vehicle and
equipment
265.32 294.67 304.48 14.8% 4.7%
- Two wheeler loans 18.98 22.15 21.79 14.8% 0.3%
Personal loans 809.32 1,044.28 1,110.99 37.3% 17.3%
Credit cards 345.46 432.30 481.97 39.5% 7.5%
Others 66.85 98.20 86.43 29.3% 1.3%
- Dealer funding loans 45.34 77.44 63.85 40.8% 1.0%
- Loan against shares and
others
21.51 20.76 22.58 5.0% 0.4%
Total retail loans 5,292.35 6,148.72 6,425.72 21.4% 100.0%
16. 16
Reliable, seamless and scalable platforms, delivering best in class customer experience
Robust platforms
Retail Internet Banking & iMobile Pay
400+
Services
500+
Services
iPlay videos
DIY journeys
Products
integrated in VKYC
360+
100+
20
Digital
onboarding
Intuitive
journeys
Secure and
personalized
Ecosystem
banking
Improved
engagement
17. Travel, Shopping and Offers
Instant Loans, Cards, PayLater,
PayLater EMI
17
iMobile Pay – Universal Super App
Payments
Borrow
Deposits and Personal
Finance Management
IMPS/NEFT/Quick transfers
Bill Payment and
Recharge
Scan to Pay, Pay to Contact
Savings
Spends
10 mn+
Activations from
Non-ICICI
Bank account
holders1
1. Till December 31, 2023
18. InstaBIZ: Universal app for Business Banking
New developments
1. As of December 31, 2023
2. By count
3. YTD December 23
UPI for
corporate
Fund Transfer
Revamp
Enhanced
collection
Dashboard
Expression QR
FD Backed
Forward
Inward
Remittance
Settlement
Account
Aggregator
18
Loan Application
Tracker
Insta
LC & EPC
Average CA balances
digitally active vs inactive
customer1
v
2.1x
Payment transactions
done digitally (in Dec
2023)2
~90%
~73k New Bizpay registrations3
Lead indicators
19. 19
Onboarding
Verification
Decisioning
Disbursement
STP for Affluent Customers
and instant Paperless Saving
A/C
Digital disbursement
(e-sign/e-stamp/e-Nach)
New enhancements
Key functionality
Journey
Integration with Account
Aggregators
Instant property valuation
reports for select developers
iLens - ICICI Bank Lending Solution
• In-built waiver & allocation logics
• FI, PD, Legal, Technical enabled
• Paperless logins
• On the fly decisioning
• Digital sanction letter
• One view eligibility & verifications
• Digital disbursement
• Integrated Bank approved projects
• Digital income fetch
• Digital co-applicant addition
• Customized agency dashboards
• All types of KYC verification
• Customer affluent classification
• Automated regulatory tagging
• Customer affluent classification
• Automated regulatory tagging
Benefits
Reduction in valuation effort
and TAT
Seamless opening of saving
account
Reduced errors and
increased authenticity
Faster decision making for
approvals
20. Digital solutions for merchant ecosystem
20
39% YoY growth in
active merchants2
1. Q3-2024 over Q3-2023
2. December 31, 2023 over December 31, 2022
30% growth in
spends1
• Super merchant account: Zero balance, swipe based benefits
• Enabling Eazypay QR onboarding with the linkage of any Bank’s
account
• Merchant OD : Instant sanction and disbursement upto ₹ 2.5 mn
• Digital store management
• Buy now pay later- DC/CC EMI
• Digital POS solutions through Eazypay (POS, UPI, Cards, etc.)
• PG: Eazypay Pro , POS: Eazypay Platinum 2.0
• Merchant module in InstaBIZ
• Value added services
• Insta QR kit: Pre-printed QR code for Instant activation
• Voice notification on App: Txn notification on Instabiz app
21. Digital channel for payment of import
obligations
For effective management of your
import payment cycle
Embedded banking solutions for
streamlining trade transactions
Digital Solutions for Importers
Logistics & Cargo
Tracking
Partner Discovery &
Smart Order
Business Incorporation &
Regulatory Guidelines
1. Q3-2024 (by count)
2. Q3-2024 over Q3-2023 (by count)
3. Q3-2024 over Q3-2023 (by value)
72.2%
Trade online
digital adoption1
26.2%
Volume of digital
throughput2
iDocs
Import Financing
Trade API
1.75x
Merchandise
Import Flows2
Trade
Analytics
TradeOneView
Import
Regularization
iBOE
Import
LC Issuance
LC Backed
Direct Imports:
iDocs
Import
Financing
Buyers Credit
Rupee Vostro
Account
Current Account
Accounts
Collection
Bills
Open Account
21
22. Simplifying Cross Border Remittances
Challenges
Solution
Remitter 1
Remitter 2
Remitter n
VA 1
VA 2
VA n
One time
registration
Credit in clients’
linked A/C
Manual reconciliation of
multiple inward transactions
Account details exposed to
multiple parties
Multi-party cross-border Inward Remittance
solution - virtual a/c architecture
Challenges
Solution
Benefits
SmartORM
Get outward remittance documents pre-
vetted before booking Fx deals
Auto-email with vetting
observations
High operational efficiency:
reduced turnaround time
Seamless processing with
multi-channel availability
Better treasury management
eliminating Fx deal loss
Fx deal funding cost loss in
discrepant transactions
High transaction cycle time
in case of discrepancies
Seamless Remittance
processed
Fx Deal
Pre-scrutinize
Transaction
Beneficiary
Customer
H2H
Auto-email with
Scrutiny feedback
TOL
Branch
1
2
3
4
Benefits
Enhanced security with
account no. masking
Seamless auto-
reconciliation
Multi-channel MIS Feed
(Mail/API/H2H)
Inward credit in linked A/C:
Easy payer identification
SmartIRM
VA: Virtual Account
22
23. 23
Supply chain solutions
Product suite
Receivables
Factoring Dealer
financing
Reverse
factoring
Payable
financing
Vendor bill
discounting
Purchase bill
finance
Receivable solutions Payable solutions
48%
Loan book1
Supply Chain Finance & Structured Trade
Self liquidating and short tenor transactions
resulting in granular book
Increased client requirement for efficient
supply chain management
Bespoke solutions leading to operational
efficiency in client’s supply chain
End-to-end digital architecture enabling
seamless transaction flow
1. December 31, 2023 over December 31, 2022
24. Digital sourcing for retail products in 9M-2024
24
Credit cards (by volume)
Fixed deposits
(by volume)
SIPs initiated (by volume)
Mortgages
(Number of sanctions)
Personal loan
disbursements (by volume)
1. Represents insignificant number
1
26. Digital payments
26
UPI: P2M1 transactions
Volume: 30.8% y-o-y
Value: 85.0% y-o-y
1. Payments to merchants
Market share by value was 19.7% in Dec
2023
Electronic toll collections
Market share by value was 28.8% in
Q3-2024
11.9% y-o-y
28. NPA trends
(₹ billion) Dec 31,
2022
Sep 30,
2023
Dec 31,
2023
Gross NPAs1 325.28 298.37 287.75
Less: cumulative provisions 268.77 247.91 233.97
Net NPAs1 56.51 50.46 53.78
Gross NPA ratio1 3.07% 2.48% 2.30%
Net NPA ratio1 0.55% 0.43% 0.44%
Provision coverage ratio 82.0% 82.6% 80.7%
Non-fund o/s to NPAs 38.69 38.86 36.94
Provisions on non-fund o/s to NPAs 19.93 20.64 20.61
28
1. Based on customer assets
• Net investment in security receipts of ARCs was ₹ 1.42 billion at Dec 31, 2023
(Sep 30, 2023: ₹ 1.52 billion; Dec 31, 2022: ₹ 4.90 billion)
Retail, rural and business
banking NPAs: slide 65
29. NPA movement1
29
1. Based on customer assets
2. Includes additions of ₹ 6.17 bn from kisan credit card portfolio
₹ billion FY2023 Q3-2023 Q2-2024 Q3-2024
Opening gross NPA 339.20 325.71 318.22 298.37
Add: gross additions (1) 186.41 57.23 46.87 57.14
- Retail, rural and business banking 154.90 41.59 43.64 54.822
- Corporate and SME 31.51 15.64 3.23 2.32
Less: recoveries, upgrades and others (2) 166.03 46.04 45.71 53.51
- Retail, rural and business banking 124.14 31.84 30.19 31.80
- Corporate and SME 41.89 14.20 15.52 21.71
Net additions (1)-(2) 20.38 11.19 1.16 3.63
Less: write-offs 44.66 11.62 19.22 13.89
: sale of NPAs 3.08 - 1.79 0.36
Closing gross NPAs 311.84 325.28 298.37 287.75
30. Resolution under RBI frameworks
30
1. Includes standard borrowers under resolution as per various RBI frameworks
(₹ billion) 31-Dec-22 30-Sep-23 31-Dec-23
Retail, rural and business banking1 41.90 30.00 27.82
Corporate and SME1 7.97 5.36 5.36
Total fund based o/s1 49.87 35.36 33.18
Total fund based o/s1 as % of total advances 0.5% 0.3% 0.3%
Provisions held on loans under resolution 15.29 11.07 10.32
31. Standard asset and other provisions
31
(₹ billion) Dec 31,
2022
Mar 31,
2023
Jun 30,
2023
Sep 30,
2023
Dec 31,
2023
Contingency provisions1
115.00 131.00 131.00 131.00 131.00
Provision on non-fund based o/s to
NPAs
19.93 20.05 19.64 20.64 20.61
Provisions on fund based o/s to
standard borrowers under resolution
15.29 13.80 12.24 11.07 10.32
General provisions on other standard
assets and other provisions
63.18 61.50 60.58 66.39 68.32
Total 213.40 226.35 223.46 229.10 230.25
Total as a % of net advances 2.2% 2.2% 2.1% 2.1% 2.0%
1. Includes Covid-19 related provisions
33. Diversified and granular loan book
33
1. Proportions are gross of BRDS/IBPC
2. Includes dealer funding, loan against shares and others
3. Including non-fund based outstanding, the share of retail portfolio was 46.4% of the total portfolio at Dec 31, 2023
2
54.3% of total loans are retail3
Breakup of loan portfolio1 at Dec 31, 2023
34. Rating-wise loan book, excluding retail and rural portfolio
34
Rating category1 Mar 31,
2020
Mar 31,
2021
Mar 31,
2022
Mar 31,
2023
Sep 30,
2023
Dec 31,
2023
AA- and above 27.3% 35.3% 36.1% 46.9% 44.5% 41.7%
A+, A, A- 36.9% 33.7% 35.7% 26.6% 26.8% 28.1%
A- and above 64.2% 69.1% 71.8% 73.5% 71.3% 69.8%
BBB+,BBB, BBB- 29.8% 25.6% 24.5% 24.3% 26.8% 28.2%
BB and below 3.0% 3.6% 2.2% 0.8% 0.7% 0.9%
Non-performing loans 2.4% 1.1% 0.7% 0.4% 0.3% 0.3%
Unrated 0.5% 0.5% 0.8% 1.0% 0.9% 0.8%
Total 100.0% 100.0% 100.0% 100.0% 100.0% 100.0%
Total net loans, excluding
retail and rural portfolio (₹
billion)
2,639 2,818 3,276 3,826 4,114 4,287
1. Based on internal ratings
35. • Other than two accounts, the maximum single borrower outstanding in the BB and
below portfolio was less than ₹ 5.00 billion at Dec 31, 2023
• At Dec 31, 2023, total provisions3 held on BB and below portfolio were ₹ 9.25 billion
(Sep 30, 2023: ₹ 8.17 billion)
Corporate and SME: BB and below
35
1. Excludes banks, investments and fund and non-fund based outstanding to NPAs
2. Fund-based and non-fund based outstanding
3. Including provisions on loans under resolution
(₹ billion) Dec 31,
2022
Sep 30,
2023
Dec 31,
2023
BB and below outstanding1 55.81 47.89 58.53
- Fund and non-fund o/s to borrowers with loans
under resolution 8.79 6.82 6.61
- Other borrowers with o/s greater than ₹ 1.00 bn2
26.06 21.91 31.66
- Other borrowers with o/s less than ₹ 1.00 bn2
20.96 19.16 20.26
36. Mortgage portfolio
36
Mortgage portfolio includes home loans ~69%, top-up loans given to existing home
loan customers 6%, office premises loans ~5% and loan against property ~19%
~85%
Mortgage customers
have existing relationship
with the Bank
~ ₹ 3.5 mn
Average ticket
size of home
loan
~60%
Average loan-
to-value ratio of
home loan
~40%
Average loan-to-
value ratio of loan
against property
iLens, an integrated, end-to-end, retail lending solution, covering all facets of loan
lifecycle starting from sourcing till disbursement for all kind of customers. It is a single
interface for employees, third party agencies and sourcing channels
Home loans are geographically well diversified, built on fundamental premises of
cashflow assessment of underlying borrower + meeting the legal and technical
standards of the Bank for the property being mortgaged
Loan against property portfolio has conservative loan to value ratios, lending based on
cash flows of business/individuals with limited reliance on the value of collateral;
valuation of the property is carried out internally
37. Auto and two wheeler finance
37
Auto loan portfolio comprises 85% new vehicles and 15% used vehicles
~75%
Auto loan customers have
liability relationship with
the Bank
Instant car loan disbursement, a industry first proposition, for pre-approved
customers; delivery order is generated digitally in a seamless manner. The product
won the ‘Best Automobile/Car Loan Product Award' in 2021
Two wheeler loans – onboarding mobility solution provides an end-to-end digital
journey for customers with instant approval; instant verification and rule engine based
decisioning
Digital processing for
new car loan
~85%
“Dream Car Search”, a one stop digital solution to assist customers in their car
buying journey; offers superior and more personalized service to the customer;
helps in reducing operating expenses
38. Rural and personal loan and credit card portfolio
38
Rural loans Personal loans and credit cards
~ 55% Portfolio to existing customers
~ 85% Portfolio of salaried individuals
~ 75% Salaried customers from well rated
corporates, MNCs, and government entities
Gold loans comprise ~2% and kisan credit cards
comprise ~2% of the total loan book
Through API integration with Bharat
Bill Payment System, customers can
instantly pay interest on their overdraft
facilities; eliminates branch visits to
service their loans
Leverage opportunities for
growth in identified ecosystems
such as farmers, dealers, self-
employed, corporates, institutions and
micro-entrepreneurs
Personal loan disbursements
increased sequentially with focus on
cross-selling to our existing customers
Growth in retail credit card spends
driven by
Improvement in discretionary spending
higher activation rate through digital
onboarding of customers, including
Amazon Pay credit cards
39. SME and business banking portfolio
39
₹ 10 - 15 mn
Average ticket size of
business banking loan
~ ₹ 100 million
Average ticket size of the
incremental sanctions in
SME in Q3-2024
~ 80%
Of business banking book
fully collateralized with a
collateral cover of >100%
Focus on parameterised and programme based lending,
granularity, collateral and robust monitoring; well diversified
portfolio across sectors and geographies
Growth driven by leveraging branch network and digital
platforms such as InstaBIZ, Merchant STACK and Trade
Online and efforts towards process decongestion such as e-
signing of disbursement documents through EazySign
Primary collateral in the business banking portfolio in the form of charge on
current assets and backed by property
40. Exposure to power sector
(₹ billion) Dec 31,
2022
Sep 30,
2023
Dec 31,
2023
Share at Dec
31, 2023 (%)
Borrowers classified as NPA or part of BB
and below portfolio1 50.98 43.82 13.98 2.8%
Other borrowers 387.58 399.07 483.33 97.2%
Total 438.56 442.89 497.31 100.0%
• Of the other borrowers aggregating ₹ 483.33 billion, excluding exposure to
State Electricity Boards, about 85% was rated A- and above
Sector-wise exposures: slide 66
40
1. Including loans restructured or under a RBI resolution scheme
41. NBFCs, HFCs and builder portfolio
Outstanding (₹ billion)
Dec 31,
2022
Sep 30,
2023
Dec 31,
2023
NBFCs1
660.45 799.30 740.50
HFCs1
104.95 38.19 44.34
Builder portfolio (construction finance, lease rental
discounting, term loans and working capital) 360.11 430.58 456.85
41
1. Includes loans, investment and non-fund based outstanding
• Proportion of the NBFC and HFC portfolio internally rated BB and below or non-performing at
Dec 31, 2023 was < 0.5% (similar level as Sep 30, 2023)
• 3.1% of the builder portfolio at Dec 31, 2023 was either internally rated BB and below or
classified as non-performing Sep 30, 2023: 3.5%)
42. Portfolio of overseas branches
42
Total outstanding1 at Dec 31, 2023: USD 3.17 billion
1. Corporate fund and non-fund outstanding of overseas branches, net of cash/bank/insurance backed lending
The overseas non-India linked
corporate portfolio reduced by
30.4% year-on-year or about
USD 116 million at Dec 31,
2023
43. Concentration risk ratios
• All top 20 borrowers as of Dec 31, 2023 are rated A- and above internally
Advances
Mar 31,
2021
Mar 31,
2022
Mar 31,
2023
Jun 30,
2023
Sep 30,
2023
Dec 31,
2023
Exposure to top 20
borrowers1 as a % of total
exposure
12.1% 9.6% 8.5% 8.7% 8.6% 8.2%
Exposure to top 10 groups
as a % of total exposure
11.6% 10.3% 10.1% 10.5% 10.1% 10.0%
43
1. Excludes banks
Deposits
Mar 31,
2021
Mar 31,
2022
Mar 31,
2023
Jun 30,
2023
Sep 30,
2023
Dec 31,
2023
Exposure to top 20
depositors1 as a % of total
deposits
5.38% 5.26% 3.46% 3.78% 3.88% 3.59%
45. Strong capital position
Sep 30, 20231 Dec 31, 20232
(₹ billion) % (₹ billion) %
Total capital 1,939.11 16.07 1,936.21 14.61
- Tier I 1,852.06 15.35 1,847.42 13.94
- of which: CET1 1,840.66 15.26 1,847.62 13.94
- Tier II 87.05 0.72 88.79 0.67
Risk weighted assets 12,064.06 13,253.25
- On balance sheet 10,887.46 11,987.63
- Off balance sheet 1,176.60 1,265.62
• Including profits for 9M-2024, CET1 ratio was 16.03%, Tier I ratio was 16.03% and total
capital adequacy ratio was 16.70% at Dec 31, 2023
1. Excluding profits for H1-2024
2. Excluding profits for 9M-2024
Consolidated capital adequacy: slide 67
45
47. Profit after tax of key subsidiaries and associates
1. As per Ind AS
2. Represents total comprehensive income
Details on key subsidiaries and associates: slides 68 - 73
47
Profit after tax (₹ billion) FY2023
Q3-
2023
Q2-
2024
Q3-
2024
ICICI Prudential Life Insurance 8.11 2.21 2.44 2.27
ICICI Lombard General Insurance 17.29 3.53 5.77 4.31
ICICI Prudential Asset Management1 15.16 4.20 5.01 5.46
ICICI Securities (Consolidated)1
11.18 2.81 4.24 4.66
ICICI Securities Primary Dealership1,2
1.28 0.12 0.17 1.37
ICICI Home Finance1
3.02 1.05 1.12 1.86
ICICI Venture 0.06 0.10 0.03 0.01
ICICI Bank UK (USD million) 13.0 3.1 3.3 6.7
ICICI Bank Canada (CAD million) 46.4 11.5 21.1 15.9
48. Insurance entities
ICICI Prudential Life Insurance
• Value of new business (VNB) was ₹ 14.51 billion in 9M-2024 (9M-2023: ₹ 17.10 billion)
• VNB margin was 26.7% in 9M-2024 (FY2023: 32.0%)
• Annualised premium equivalent (APE) was ₹ 54.30 billion in 9M-2024 (9M-2023: ₹
53.41 billion)
• New business sum assured grew by 4.4% y-o-y in 9M-2024
ICICI Lombard General Insurance
• Gross direct premium income (GDPI) grew by 16.5% y-o-y to ₹ 187.03 billion in 9M-
2024
• Leading private sector non-life insurer in India with a market share1 of 8.8% at
December 31, 2023
48
1. Based on GDPI
49. ICICI Securities and ICICI AMC
1. Active in trailing 12 months
2. Excluding FII, DII and proprietary
3. Average assets under management (excluding fund of funds); source: Association of Mutual Funds in India (AMFI)
ICICI Securities
• NSE active clients1 market share at 5.3% at December 31, 2023 compared to 5.7% at
September 30, 2023
• Retail equity market share was 13.1% in Q3-2024 compared to 12.8% in Q2-2024
• Market share in commodity trading segment2 was 7.5% in Q3-2024 compared to 7.8%
in Q2-2024
ICICI AMC
• AAUM3 grew by 25.9% y-o-y to ₹ 6,146 billion in Q3-2024
• Market leader in equity and hybrid AUM with market share of 13.3% at December 31,
2023
49
51. Promoting sustainable practices
Focus on increasing Indian
Green Building Council
certification of Bank’s premises
Forest Stewardship Council
certified recycled paper being
used for pre-print forms at
branches
Enhancing internal risk
assessment tools for evaluating
climate transition risk and
evaluate borrower risks in high-
polluting sectors
Being responsible and transparent
Micro page developed on the
Bank’s website for all ESG and
CSR related disclosures
Extensive awareness
campaigns through digital
channels on cyber security,
fraud prevention
Striving to create value for
stakeholders
Project ‘GhanVan’ launched with
Tata Power, for nurturing
biodiversity through tree
plantation in the Western Ghats
Process completed for ISO
45001-2018 certification of
select offices on occupational
health & safety management
Enhanced internal portal focusing
on employee well-being in areas
like fitness, financial planning
and protection
ESG at ICICI Bank
51
Environment Social Governance
The Bank’s efforts contribute to the UN Sustainable Development Goals
54. Yield, cost and margin
1. Annualised for all interim periods
2. Impact of interest on income tax refund of 4 bps in Q3-2024 and 2 bps in 9M-2024 (1 bp in FY2023, nil in Q2-2024, nil in
Q3-2023, 1 bp in 9M-2023) 54
slide 9
Movement in yield, costs &
margins (Percent)1 FY2023 Q3-2023 9M-2023 Q2-2024 Q3-2024 9M-2024
Yield on total interest-earning
assets2 7.87 8.07 7.62 8.64 8.71 8.69
- Yield on advances 8.94 9.13 8.65 9.81 9.79 9.82
Cost of funds 3.93 3.95 3.80 4.78 4.96 4.79
- Cost of deposits 3.66 3.65 3.56 4.53 4.72 4.53
Net interest margin2
4.48 4.65 4.33 4.53 4.43 4.57
- Domestic 4.61 4.79 4.47 4.61 4.52 4.66
- Overseas 0.61 0.63 0.49 1.56 1.47 1.35
55. Consolidated profit & loss statement
55
(₹ billion) FY2023 Q3-2023 9M-2023 Q2-2024 Q3-2024 9M-2024
Q3-o-Q3
growth
Net interest income 705.23 186.41 505.64 210.30 214.57 632.25 15.1%
Non-interest income 651.12 162.41 456.29 183.54 186.14 519.46 14.6%
- Fee income 228.72 57.09 168.03 68.88 70.64 201.48 23.7%
- Premium income 411.37 101.53 279.60 106.79 105.88 289.64 4.3%
- Other income 11.03 3.79 8.65 7.87 9.62 28.34 -
Total income 1,356.35 348.82 961.93 393.84 400.71 1,151.71 14.9%
Operating expenses 824.39 205.12 582.02 239.10 239.09 678.76 16.6%
Operating profit 531.96 143.70 379.91 154.74 161.62 472.95 12.5%
57. Key ratios (consolidated)
57
1. Annualised for all interim periods
slide 9
Percent FY2023 Q3-2023 9M-2023 Q2-2024 Q3-2024 9M-2024
Return on equity1
17.3 17.5 16.6 18.9 18.5 18.9
Weighted average EPS1 (₹) 48.9 50.0 46.1 61.9 62.7 62.0
Book value (₹) 307 293 293 331 347 347
58. Balance sheet: liabilities
(₹ billion) Dec 31, 2022 Sep 30, 2023 Dec 31, 2023
Net worth 1,912.69 2,160.49 2,268.37
- Equity capital 13.96 14.01 14.03
- Reserves 1,898.73 2,146.48 2,254.34
Deposits 11,220.49 12,947.42 13,323.15
- Current 1,456.26 1,553.04 1,534.11
- Savings 3,632.16 3,723.26 3,745.84
- Term 6,132.08 7,671.12 8,043.20
Borrowings1
1,305.50 1,167.58 1,268.71
Other liabilities 778.80 932.31 971.99
Total liabilities 15,217.48 17,207.80 17,832.22
• Credit/deposit ratio of 84.6% on the domestic balance sheet at Dec 31,
2023 (Sep 30, 2023: 84.1%; Dec 31, 2022: 84.7%)
1. Including impact of rupee depreciation 58
59. Composition of borrowings
(₹ billion) Dec 31, 2022 Sep 30, 2023 Dec 31, 2023
Domestic 999.65 883.38 947.38
- Capital instruments 82.60 39.66 28.38
- Other borrowings 917.05 843.73 919.00
- Long term infrastructure bonds 459.04 459.09 460.18
- Refinance 292.77 325.81 387.12
Overseas borrowings1
305.85 284.20 321.33
Total borrowings 1,305.50 1,167.58 1,268.71
1. Including impact of rupee depreciation 59
slide 12
60. Consolidated balance sheet
(₹ billion) Dec 31, 2022 Sep 30, 2023 Dec 31, 2023
Cash & bank balances 1,398.80 1,291.02 1,214.49
Investments 6,125.58 7,152.64 7,548.65
Advances 10,380.91 11,821.09 12,291.98
Fixed & other assets 966.80 983.75 1,025.06
Total assets 18,872.09 21,248.50 22,080.18
Net worth 2,045.93 2,318.84 2,438.31
Minority interest 65.73 72.04 74.32
Deposits 11,523.25 13,252.53 13,668.42
Borrowings 1,924.97 1,897.10 2,009.67
Liabilities on policies in force 2,399.75 2,593.50 2,735.64
Other liabilities 912.46 1,114.49 1,153.82
Total liabilities 18,872.09 21,248.50 22,080.18
60
slide 12
61. Branch and ATM network
Branches
Mar 31,
2021
Mar 31,
2022
Mar 31,
2023
Jun 30,
2023
Sep 30,
2023
Dec 31,
2023
% share at
Dec 31,
2023
Metro 1,542 1,567 1,709 1,775 1,838 1,882 29.5%
Urban 1,063 1,074 1,160 1,203 1,250 1,298 20.4%
Semi urban 1,537 1,599 1,712 1,753 1,797 1,814 28.5%
Rural 1,124 1,178 1,319 1,343 1,363 1,377 21.6%
Total branches 5,266 5,418 5,900 6,074 6,248 6,371 100.0%
Total ATMs and
CRMs
16,834 16,609 16,650 16,731 16,927 17,037
61
slide 12
62. Balance sheet: assets
(₹ billion) Dec 31,
2022
Sep 30,
2023
Dec 31,
2023
Cash & bank balances 1,224.71 1,094.62 993.28
Investments 3,370.51 4,132.53 4,366.50
- SLR investments 2,867.42 3,480.84 3,683.42
- Equity investment in subsidiaries1 69.78 69.78 69.78
Advances 9,740.47 11,105.42 11,537.71
Fixed & other assets 881.79 875.23 934.73
- RIDF2 and related 225.67 202.45 211.27
Total assets 15,217.48 17,207.80 17,832.22
1. In addition, the Bank’s equity investment in ICICI Lombard General Insurance Company Limited was ₹ 13.31 billion.
The company ceased to be a subsidiary of the Bank during Q2-2022
2. Rural Infrastructure Development Fund
62
63. Equity investment in subsidiaries
63
slide 13
(₹ billion) Dec 31,
2022
Sep 30,
2023
Dec 31,
2023
ICICI Prudential Life Insurance 32.75 32.75 32.75
ICICI Bank Canada 9.96 9.96 9.96
ICICI Bank UK 9.70 9.70 9.70
ICICI Home Finance 13.62 13.62 13.62
ICICI Securities Limited 1.22 1.22 1.22
ICICI Securities Primary Dealership 1.58 1.58 1.58
ICICI AMC 0.61 0.61 0.61
ICICI Venture Funds Mgmt 0.05 0.05 0.05
Others 0.29 0.29 0.29
Total 69.78 69.78 69.78
64. Portfolio composition
Dec 31, 2022 Sep 30, 2023 Dec 31, 2023
Domestic 92.8% 93.4% 93.4%
International 7.2% 6.6% 6.6%
Total consolidated advances
(₹ billion)
10,381 11,821 12,292
64
slide 13
65. Retail, rural and business banking NPAs
65
slide 28
₹ in billion
Dec 31,
2022
Sep 30,
2023
Dec 31,
2023
Gross retail, rural and business banking NPAs 122.45 128.52 137.88
- as a % of gross advances 1.78% 1.61% 1.65%
Net retail, rural and business banking NPAs 43.51 44.25 48.81
- as a % of net advances 0.64% 0.56% 0.59%
66. Sector-wise exposures
Top 10 sectors1: % of total
exposure of the Bank
Mar 31,
2021
Mar 31,
2022
Mar 31,
2023
Jun 30,
2023
Sep 30,
2023
Dec 31,
2023
Retail finance2
33.9% 36.3% 38.3% 38.8% 39.2% 39.8%
Services – finance 9.9% 8.9% 8.7% 8.9% 8.4% 8.2%
Rural 6.3% 5.8% 6.2% 6.2% 6.1% 6.2%
Wholesale/retail trade 3.4% 3.3% 4.0% 4.2% 4.5% 4.7%
Banks 7.9% 7.9% 6.0% 4.7% 5.5% 4.6%
Electronics & engineering 4.5% 4.2% 4.0% 3.9% 3.8% 3.9%
Crude petroleum/refining &
petrochemicals 4.9% 4.1% 3.8% 3.8% 3.6% 3.6%
Services - non finance 2.8% 3.0% 3.3% 3.5% 3.4% 3.5%
Road, port, telecom, urban
development & other infra 3.5% 3.2% 3.0% 3.1% 3.0% 3.1%
of which: Telecom 1.6% 1.4% 1.4% 1.4% 1.4% 1.4%
Real estate 1.9% 2.2% 2.4% 2.5% 2.5% 2.5%
Construction 2.3% 2.3% 2.3% 2.3% 2.2% 2.3%
Total (₹ billion) 14,223 16,648 20,245 20,985 22,102 22,874
1. Top 10 based on position at Dec 31, 2023
2. From Mar 31, 2022, the Bank has started reporting rural portfolio separately from retail finance. Previous period numbers have been re-
classified
66
slide 40
67. Consolidated capital adequacy
Basel III (%) Sep 30,
20231
Dec 31,
20232
Total capital 15.94% 14.38%
- Tier I 15.23% 13.73%
- of which: CET 1 15.15% 13.73%
- Tier II 0.71% 0.65%
1. Excludes profit for H1-2024
2. Excludes profit for 9M-2024 67
slide 45
• Including profits for 9M-2024, CET 1 ratio was 15.77%, Tier I ratio was 15.77%
and total capital adequacy ratio was 16.42% at Dec 31, 2023
68. Insurance entities
ICICI Life (₹ billion) FY2023 Q3-2023 Q2-2024 Q3-2024
Annualised premium equivalent 86.40 18.21 20.62 19.07
- Of which: protection 15.04 3.40 3.90 3.58
Assets under management 2,511.91 2,518.84 2,719.03 2,866.76
Expense ratio1 21.5% 19.5% 25.0% 23.9%
1. All expenses (including commission) / (Total premium – 90% of single premium)
2. Annualised for all interim periods
ICICI General (₹ billion) FY2023 Q3-2023 Q2-2024 Q3-2024
Gross written premium 217.72 56.00 62.72 64.37
Combined ratio 104.5% 104.4% 103.9% 103.6%
Return on average equity2
17.7% 14.3% 21.1% 15.3%
68
69. ICICI Bank UK
(USD million) FY2023 Q3-2023 9M-2023 Q2-2024 Q3-2024 9M-2024
Net interest income 52.6 13.8 36.7 16.5 16.7 50.6
Operating profit 21.7 7.9 11.9 8.0 10.0 29.1
Loans and advances 997.2 1,021.9 1,021.9 1,056.6 1,070.3 1,070.3
Deposits 1,617.4 1,529.8 1,529.8 1,591.1 1,834.3 1,834.3
- Retail term deposits 650.2 494.9 494.9 663.2 868.6 868.6
Capital adequacy ratio 27.1% 25.4% 25.4% 20.9% 20.1% 20.1%
- Tier I 21.5% 20.1% 20.1% 20.7% 19.9% 19.9%
Net impaired loans 32.4 20.9 20.9 14.9 13.7 13.7
69
70. ICICI Bank UK1
Asset profile Liability profile
Total liabilities: USD 2.35 bn
Total assets: USD 2.35 bn
70
1. At Dec 31, 2023
2. Includes cash & advances to banks and T Bills
2
72. ICICI Bank Canada1
Liability profile
Asset profile
Total liabilities: CAD 6.11 bn
Total assets: CAD 6.11 bn
72
1. At Dec 31, 2023
2. Includes cash & placements with banks and government securities
3. Insured mortgages include CAD 2,236.3 million of securitised mortgages at Dec 31, 2023 (Sep 30, 2023: CAD 2,263.2 million)
4. As per IFRS, proceeds of CAD 2,214.3 million at Dec 31, 2023 (Sep 30, 2023: CAD 2,238.6 million) on securitisation of residential
mortgages are considered a part of borrowings
3
2
4
73. ICICI Home Finance1
(₹ billion) Sep 30, 2023 Dec 31, 2023
Loans and advances 193.66 208.28
Gross impaired loans (stage 3)2
4.83 4.28
Net impaired loans (stage 3) 2.39 2.58
Capital adequacy ratio 21.96% 21.07%
1. As per Ind AS
2. Includes nil commercial real estate loans as at Dec 31, 2023 (Sep 30, 2023: ₹ 0.61 billion) 73
slide 47