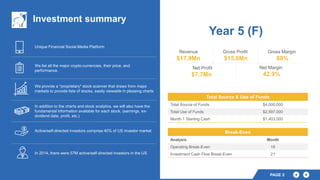
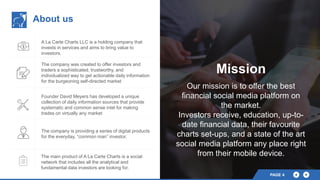
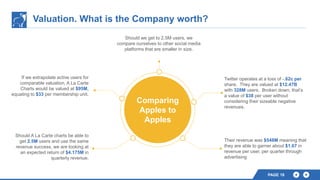
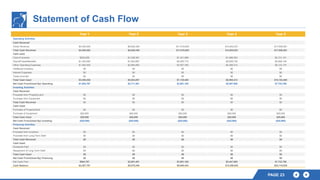
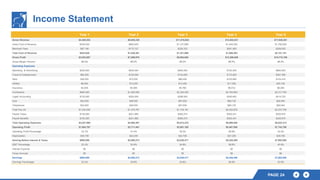
SlideShare a Scribd company logo
A La Carte
Charts LLC
A Social Network for Active Investors
INVESTOR
PRESENTATION
PAGE 2
Revenue
$17.9Mn
Gross Profit
$15.8Mn
Gross Margin
88%
Net Profit
$7.7Mn
Net Margin
42.9%
Year 5 (F)
Total Source & Use of Funds
Total Source of Funds $4,000,000
Total Use of Funds $2,597,000
Month 1 Starting Cash $1,403,000
Break-Even
Analysis Month
Operating Break-Even 19
Investment Cash Flow Break-Even 21
Unique Financial Social Media Platform
We list all the major crypto-currencies, their price, and
performance.
In 2014, there were 57M active/self-directed investors in the US
In addition to the charts and stock analytics, we will also have the
fundamental information available for each stock. (earnings, ex-
dividend date, profit, etc.)
Investment summary
We provide a *proprietary* stock scanner that draws from major
markets to provide lists of stocks, easily viewable in pleasing charts
Active/self-directed investors comprise 40% of US investor market
Company
PAGE 3
About us
A La Carte Charts LLC is a holding company that
invests in services and aims to bring value to
investors.
The company was created to offer investors and
traders a sophisticated, trustworthy, and
individualized way to get actionable daily information
for the burgeoning self-directed market
Founder David Meyers has developed a unique
collection of daily information sources that provide
systematic and common sense intel for making
trades on virtually any market
The company is providing a series of digital products
for the everyday, “common man” investor.
The main product of A La Carte Charts is a social
network that includes all the analytical and
fundamental data investors are looking for.
Mission
Our mission is to offer the best
financial social media platform on
the market.
Investors receive, education, up-to-
date financial data, their favourite
charts set-ups, and a state of the art
social media platform any place right
from their mobile device.
PAGE 4
Technology
Pick your favourite charts, time frame, and build active lists
PAGE 6
Current app developments and new features
PAGE 7
PAGE 8
The Platform’s features:
• Complete Social Network A state of the art social network for anyone
interested in the stock market.
• Intra-day data for stocks. Currently, only the major markets are
tracked on the Company scanners, but eventually every stock in the
US will be available.
• News feed below stock screeners. This way investors can read the
most recent and relevant articles of a given stock and chart.
• “Chart of the Day” pick emailed daily to subscribers of the app. This
keeps them engaged and gives them relevant data to start their
research.
• Investor “Watch List.” In-app alerts based on scans and watch-list
stocks.
• Crypto-Currency – we list over 200 of the top crypto-currencies and
their latest prices.
• Increased Financial Literacy, A safe place to learn about stocks,
crypto-currencies, earnings, charts, with discussions and how-to-
videos.
Market Analysis
What are our user goals?
PAGE 10
Our primary goal is to attain 2.5M
users in the 1st year
We are going after the existing 110M Active investors in the U.S.
Given the overall market size for active investors, the Company
believes that with traditional marketing, guerilla marketing, and the
help of peer-to-peer relationships it can acquire 3%* of the market
by providing all the features available discussed herein.
Industry overview
PAGE 11
USA Investment Advice
14,660
Establishments
$13.04 B
Total Sales
$4.8 B
Annual Payroll
61,409
Paid Employees
$889 K
Sales per
Establishment
$330 K
Payroll
per Establishment
4.2
Employees
per Establishment
37.2%
Payroll as a
Percent of Sales
$79 K
Annual Payroll per
Employee
$212 K
Sales per Employee
Arizona Investment Advice
358
Establishments
$18.5 M
Total Sales
$79.3 M
Annual Payroll
1,444
Paid Employees
$517 K
Sales per
Establishment
$221 K
Payroll
per Establishment
4.0
Employees
per Establishment
42.8%
Payroll as a
Percent of Sales
$54 K
Annual Payroll per
Employee
$128 K
Sales per Employee
Market analysis
PAGE 12
28 36
46
58
39
50
65
85
-10
40
90
2013 2014 2015 2016
$Billion
App Market Productivity Growth
Business & Productivity Consumer Market
Business and Productivity App growth
Global Asset Under Management Grew to a Record $68.7 Trillion in 2013
5.4 5.2
6.2
2007 2012 2013
Japan and Australia
-1 1854.7 60.9 68.7
2007 2012 2013
Global
2 13
27.3 29.4
34
2007 2012 2013
North America
2
16
16.1 18 19.3
2007 2012 2013
Europe
2 7
0.8 1.5 1.7
2007 2012 2013
Latin America
13 8
2.5 3.8 4.4
2007 2012 2013
(excluding Japan and Australia)
149
3 18
1 1.2 1.4
2007 2012 2013
Middle East and Africa
Annual growth, 2007-2012 (%) Annual growth, 2013 (%)
Market analysis contd..
PAGE 13
This map shows
sales per capita for
Investment Advice.
0-9 (12)
10-28 (13)
29-42 (13)
43-395 (13)
Online trading penetration in the US and retail traders' trading device preferences are rapidly
changing
PAGE 14
0
100
200
300
400
500
600
1995 1996 1997 1998 1999 2000 2001 2002 2003 2004 2005 2006 2007 2008 2009 2010 2011 2012 2013
Intdractive Broker TD Ameritrade Schwab Trade Station E- Trade
Historical Change in Daily Average Revenue Trades,
(In thousand of trades per day)
https://aitegroup.com/online-trading-penetration-united-states-and-retail-traders-trading-device-preferences-are-rapidly
Barriers to entry
PAGE 15
• The Company’s proprietary and
protected stock screening code
resides and works on the server
outside the app, providing greater
security for the Company
The Company owns the proprietary
algorithm that creates the screener
• Not only is the app proprietary, most
app developers generally are not
active stock traders, and vice versa,
making it even more difficult to
reverse engineer product features
This app took over two years to perfect,
and will still improve
Competitors
TheStreet.com, Market
Smith, eSignal, etc.
They are all nice
services, but charge
money. A La Carte
Charts is
Free.
PAGE 16
Valuation
PAGE 17
Valuation. What is the Company worth?
PAGE 18
Twitter operates at a loss of -.62c per
share. They are valued at $12.47B
with 328M users. Broken down, that’s
a value of $38 per user without
considering their sizeable negative
revenues.
Should we get to 2.5M users, we
compare ourselves to other social media
platforms that are smaller in size.
Their revenue was $548M meaning that
they are able to garner about $1.67 in
revenue per user, per quarter through
advertising
If we extrapolate active users for
comparable valuation, A La Carte
Charts would be valued at $95M,
equating to $33 per membership unit.
Should A La Carte charts be able to
get 2.5M users and use the same
revenue success, we are looking at
an expected return of $4.175M in
quarterly revenue.
Comparing
Apples to
Apples
PAGE 19
Valuation Comparables
Other examples of
valuation in this space
Robinhood a trading app that has approximately 2M
users has a current valuation of $1.3B
Snapchat has a declining user base, loses -$3 per
share and is valued at just under $18B.
Stock Twits is also a private company, but has currently
raised $14M and been raising money since 2008 that
puts them in the same valuation category as Robinhood
of about $1.5B valuation with a different business model
where they pay writers to create content. In addition,
this is based off of only 300K active users.
PAGE 19PAGE 19
There is no way to
know for sure.
Markets will
ultimately decide
what we deserve as
a valuation.
Can we expect a valuation
in that category?
“If you build it, they will
come.”
All we can do is put
together the best financial
social media platform we
can, and strive to make it
engaging to users.
Put together a great
platform for users.
Make sure you keep up
with their needs.
Users will ultimately create
the valuation we hope to
achieve. They are our biggest
asset, in the long run.
PAGE 20PAGE 20
Buyout goal
PAGE 21
• Should a larger company hope to
acquire the business, the Founders are
not opposed to it.
- As long as it creates value for
shareholders, and it is a good fit for the
company.
- Ultimately, it is all about rewarding
shareholders. If the price is right, of
course we’ll listen.
Not opposed to an acquisition
• There is a particular music streaming
company out there that was hanging
their hat on being bought out. They
have lost ¾ of their value by not
becoming profitable and gaining users.
• Being bought out is NOT a business
plan, but if you do things the right way,
you may find that companies want to
buy out your company.
Being bought out
is not a goal
Financials
Statement of Cash Flow
PAGE 23
Year 1 Year 2 Year 3 Year 4 Year 5
Operating Activities
Cash Received
Gross Revenue $4,355,303 $8,636,339 $11,016,653 $14,053,021 $17,926,261
Total Cash Received $4,355,303 $8,636,339 $11,016,653 $14,053,021 $17,926,261
Cash used
Cost of revenue $522,636 $1,036,361 $1,321,998 $1,686,363 $2,151,151
Payroll/Taxes/Benefits $1,345,500 $1,923,697 $2,255,710 $2,629,738 $2,909,139
Other Operating Expenses $1,482,400 $2,964,800 $3,557,760 $4,269,312 $5,123,174
Additional Inventory $0 $0 $0 $0 $0
Interest Expenses $0 $0 $0 $0 $0
Taxes Accrued $0 $0 $0 $0 $0
Total Cash Used $3,350,536 $5,924,857 $7,135,468 $8,585,413 $10,183,465
Net Cash From/(Used By) Operating $1,004,767 $2,711,481 $3,881,185 $5,467,608 $7,742,796
Investing Activities
Cash Received
Proceeds from Property/Land $0 $0 $0 $0 $0
Purchase from Equipment $0 $0 $0 $0 $0
Total Cash Received $0 $0 $0 $0 $0
Cash Used
Purchase of Property/land $0 $0 $0 $0 $0
Purchase of Equipment $20,000 $20,000 $20,000 $20,000 $20,000
Total Cash Used $20,000 $20,000 $20,000 $20,000 $20,000
Net Cash From/(Used By) Investing ($20,000) ($20,000) ($20,000) ($20,000) ($20,000)
Financing Activities
Cash Received
Proceeds from Investors $0 $0 $0 $0 $0
Proceeds from Long-Term Debt $0 $0 $0 $0 $0
Total Cash Received $0 $0 $0 $0 $0
Cash Used
Dividends Paid $0 $0 $0 $0 $0
Repayment of Long-Term Debt $0 $0 $0 $0 $0
Total Cash Used $0 $0 $0 $0 $0
Net Cash From/(Used By) Financing $0 $0 $0 $0 $0
Net Cash Flow $984,767 $2,691,481 $3,861,185 $5,447,608 $7,722,796
Cash Balance $2,387,767 $5,079,248 $8,940,434 $14,388,042 $22,110,838
Income Statement
PAGE 24
Year 1 Year 2 Year 3 Year 4 Year 5
Gross Revenue $4,355,303 $8,636,339 $11,016,653 $14,053,021 $17,926,261
Direct Cost of Revenue $435,530 $863,634 $1,101,665 $1,405,302 $1,792,626
Merchant Fees $87,106 $172,727 $220,333 $281,060 $358,525
Total Cost of Revenue $522,636 $1,036,361 $1,321,998 $1,686,363 $2,151,151
Gross Profit $3,832,667 $7,599,978 $9,694,655 $12,366,659 $15,775,109
Gross Margin Percent 88.0% 88.0% 88.0% 88.0% 88.0%
Operating Expenses
Marketing & Advertising $250,000 $500,000 $600,000 $720,000 $864,000
Travel & Entertainment $60,000 $120,000 $144,000 $172,800 $207,360
Rent $36,000 $72,000 $86,400 $103,680 $124,416
Utilities $6,000 $12,000 $14,400 $17,280 $20,736
Insurance $2,400 $4,800 $5,760 $6,912 $8,294
Contractors $960,000 $1,920,000 $2,304,000 $2,764,800 $3,317,760
Legal/ Accounting $120,000 $240,000 $288,000 $345,600 $414,720
Auto $24,000 $48,000 $57,600 $69,120 $82,944
Telephones $24,000 $48,000 $57,600 $69,120 $82,944
Total Pay roll $1,035,000 $1,479,767 $1,735,161 $2,022,876 $2,237,799
Payroll Taxes $155,250 $221,965 $260,274 $303,431 $335,670
Payroll Benefits $155,250 $221,965 $260,274 $303,431 $335,670
Total Operating Expenses $2,827,900 $4,888,497 $5,813,470 $6,899,050 $8,032,313
Operating Profit $1,004,767 $2,711,481 $3,881,185 $5,467,608 $7,742,796
Operating Profit Percentage 23.1% 31.4% 35.2% 38.9% 43.2%
Depreciation $39,708 $42,208 $44,708 $47,208 $49,708
Earning Before Interest & Taxes $965,059 $2,669,273 $3,836,477 $5,420,400 $7,693,088
EBIT Percentage 22.2% 30.9% 34.8% 38.6% 42.9%
Interest Expense $0 $0 $0 $0 $0
Taxes Accrued $0 $0 $0 $0 $0
Earnings $965,059 $2,669,273 $3,836,477 $5,420,400 $7,693,088
Earnings Percentage 22.2% 30.9% 34.8% 38.6% 42.9%
Balance Sheet
PAGE 25
Year 1 Year 2 Year 3 Year 4 Year 5
Assets
Current Assets
Cash $2,387,767 $5,079,248 $8,940,434 $14,388,042 $22,110,838
Inventory $0 $0 $0 $0 $0
Other Current Assets $0 $0 $0 $0 $0
Total Current Assets $2,387,767 $5,079,248 $8,940,434 $14,388,042 $22,110,838
Long-Term Assets
Property $0 $0 $0 $0 $0
Equipment $86,000 $106,000 $126,000 $146,000 $166,000
Build-out $250,000 $250,000 $250,000 $250,000 $250,000
Accumulated Depreciation ($39,708) ($81,917) ( $ 1 2 6 , 6 2 5 ) ($173.833) ($223,542)
Total Long-Term Assets $ 2 9 6 , 2 9 2 $274,083 $249,375 $222.167 $192,458
Total Assets $2,684,059 $5,353,332 $9,189.809 $14,610,209 $22,303,296
Liabilities
Current Liabilities
Current Debt $0 $0 $0 $0 $0
Total Current Liabilities $0 $0 $0 $0 $0
Long-Term Liabilities
Long-Term Debt $0 $0 $0 $0 $0
New Long-Term Debt $0 $0 $0 $0 $0
Total Long-Term Liabilities $0 $0 $0 $0 $0
Total Liabilities $0 $0 $0 $0 $0
Shareholders' Equity
Paid-In Capital
Owner $0 $0 $0 $0 $0
Investor $4,000,000 $4,000,000 $4,000,000 $4,000,000 $4,000,000
New Paid-In Capital $0 $0 $0 $0 $0
Total Paid-In Capital $4,000,000 $4,000,000 $4,000,000 $4,000,000 $4,000,000
Retained Earnings
Previous Retained Earnings ($2,281,000) ($1,315,941) $1,353,332 $5,189,809 $10,610,209
Current Earnings $965,059 $2,669,273 $3,836,477 $5,420,400 $7,693,088
Total Retained Earnings ($1,315,941) $1,353,332 $5,189,809 $10,610,209 $18,303,296
Total Shareholders' Equity $2,684,059 $5,353,332 $9,189,809 $14,610,209 $22,303,296
Total Liabilities & Equity $2,684,059 $5,353,332 $9,189,809 $14,610,209 $22,303,296
THANK YOU
CONTACT
Add
Phone
e mail
Web
42211 N. 41st Drive, Phoenix, AZ 85086
(425) 949-9196
davidmeyers@ALaCarteCharts.com
www.ALaCarteCharts.com

More Related Content

Similar to Investor presentation

Company Stock Analysis And Equity Research Report PowerPoint Presentation Slides
Company Stock Analysis And Equity Research Report PowerPoint Presentation SlidesCompany Stock Analysis And Equity Research Report PowerPoint Presentation Slides
Company Stock Analysis And Equity Research Report PowerPoint Presentation Slides
SlideTeam
 
Bare Market: The future of capital formation, Tradestreaming Money Conference...
Bare Market: The future of capital formation, Tradestreaming Money Conference...Bare Market: The future of capital formation, Tradestreaming Money Conference...
Bare Market: The future of capital formation, Tradestreaming Money Conference...
Digiday
 
Leaf Group IR deck_01.03.17v1
Leaf Group IR deck_01.03.17v1Leaf Group IR deck_01.03.17v1
Leaf Group IR deck_01.03.17v1
Leaf Group
 
2018 Global Real Estate Portal Report
2018 Global Real Estate Portal Report2018 Global Real Estate Portal Report
2018 Global Real Estate Portal Report
Mike DelPrete
 
y2uR6ki5QAarkepIuRAGqQ_01854b7d7d56451f8d7f8e8db043fd10_3M-Company-Annual_Rep...
y2uR6ki5QAarkepIuRAGqQ_01854b7d7d56451f8d7f8e8db043fd10_3M-Company-Annual_Rep...y2uR6ki5QAarkepIuRAGqQ_01854b7d7d56451f8d7f8e8db043fd10_3M-Company-Annual_Rep...
y2uR6ki5QAarkepIuRAGqQ_01854b7d7d56451f8d7f8e8db043fd10_3M-Company-Annual_Rep...
GraceKagure1
 
Sandler o'neill conference_-_6-6-131
Sandler o'neill conference_-_6-6-131Sandler o'neill conference_-_6-6-131
Sandler o'neill conference_-_6-6-131investorsamtd
 
Equity Consulting Report PowerPoint Presentation Slides
Equity Consulting Report PowerPoint Presentation SlidesEquity Consulting Report PowerPoint Presentation Slides
Equity Consulting Report PowerPoint Presentation Slides
SlideTeam
 
Leaf Group IR deck_02.27.17
Leaf Group IR deck_02.27.17Leaf Group IR deck_02.27.17
Leaf Group IR deck_02.27.17
Leaf Group
 
2014 Tech M&A Monthly - New World of Buyers
2014 Tech M&A Monthly - New World of Buyers2014 Tech M&A Monthly - New World of Buyers
2014 Tech M&A Monthly - New World of Buyers
Corum Group
 
Child development classTopic Divorce Impact and Conseque
Child development classTopic Divorce Impact and ConsequeChild development classTopic Divorce Impact and Conseque
Child development classTopic Divorce Impact and Conseque
JinElias52
 
Dmd ir q2_2015_v10
Dmd ir q2_2015_v10Dmd ir q2_2015_v10
Dmd ir q2_2015_v10
Leaf Group
 
June Q3 FY13 - Investor Presentation
June Q3 FY13 - Investor PresentationJune Q3 FY13 - Investor Presentation
June Q3 FY13 - Investor Presentationinvestorsamtd
 
Mutual fund monthly review 06 2013
Mutual fund monthly review 06 2013Mutual fund monthly review 06 2013
Mutual fund monthly review 06 2013
jonathangeorges
 
Lg ir deck_11.15.16v2
Lg ir deck_11.15.16v2Lg ir deck_11.15.16v2
Lg ir deck_11.15.16v2
Leaf Group
 
Lg ir deck_update 05082018_for distribution
Lg ir deck_update 05082018_for distributionLg ir deck_update 05082018_for distribution
Lg ir deck_update 05082018_for distribution
Leaf Group
 
iConsumer Investor Deck
iConsumer Investor DeckiConsumer Investor Deck
iConsumer Investor Deck
Sandi Schleicher
 
MARKET_CLAMP_PRESENTATION
MARKET_CLAMP_PRESENTATIONMARKET_CLAMP_PRESENTATION
MARKET_CLAMP_PRESENTATIONMatt Marshall
 
$1FC_MVP for Equity Application.pdf
$1FC_MVP for Equity Application.pdf$1FC_MVP for Equity Application.pdf
$1FC_MVP for Equity Application.pdf
S. M.
 
Management Buyout MBO As Exit Option Powerpoint Presentation Slides
Management Buyout MBO As Exit Option Powerpoint Presentation SlidesManagement Buyout MBO As Exit Option Powerpoint Presentation Slides
Management Buyout MBO As Exit Option Powerpoint Presentation Slides
SlideTeam
 

Similar to Investor presentation (20)

Company Stock Analysis And Equity Research Report PowerPoint Presentation Slides
Company Stock Analysis And Equity Research Report PowerPoint Presentation SlidesCompany Stock Analysis And Equity Research Report PowerPoint Presentation Slides
Company Stock Analysis And Equity Research Report PowerPoint Presentation Slides
 
Bare Market: The future of capital formation, Tradestreaming Money Conference...
Bare Market: The future of capital formation, Tradestreaming Money Conference...Bare Market: The future of capital formation, Tradestreaming Money Conference...
Bare Market: The future of capital formation, Tradestreaming Money Conference...
 
Leaf Group IR deck_01.03.17v1
Leaf Group IR deck_01.03.17v1Leaf Group IR deck_01.03.17v1
Leaf Group IR deck_01.03.17v1
 
2018 Global Real Estate Portal Report
2018 Global Real Estate Portal Report2018 Global Real Estate Portal Report
2018 Global Real Estate Portal Report
 
Global Payments Research Report
Global Payments Research Report Global Payments Research Report
Global Payments Research Report
 
y2uR6ki5QAarkepIuRAGqQ_01854b7d7d56451f8d7f8e8db043fd10_3M-Company-Annual_Rep...
y2uR6ki5QAarkepIuRAGqQ_01854b7d7d56451f8d7f8e8db043fd10_3M-Company-Annual_Rep...y2uR6ki5QAarkepIuRAGqQ_01854b7d7d56451f8d7f8e8db043fd10_3M-Company-Annual_Rep...
y2uR6ki5QAarkepIuRAGqQ_01854b7d7d56451f8d7f8e8db043fd10_3M-Company-Annual_Rep...
 
Sandler o'neill conference_-_6-6-131
Sandler o'neill conference_-_6-6-131Sandler o'neill conference_-_6-6-131
Sandler o'neill conference_-_6-6-131
 
Equity Consulting Report PowerPoint Presentation Slides
Equity Consulting Report PowerPoint Presentation SlidesEquity Consulting Report PowerPoint Presentation Slides
Equity Consulting Report PowerPoint Presentation Slides
 
Leaf Group IR deck_02.27.17
Leaf Group IR deck_02.27.17Leaf Group IR deck_02.27.17
Leaf Group IR deck_02.27.17
 
2014 Tech M&A Monthly - New World of Buyers
2014 Tech M&A Monthly - New World of Buyers2014 Tech M&A Monthly - New World of Buyers
2014 Tech M&A Monthly - New World of Buyers
 
Child development classTopic Divorce Impact and Conseque
Child development classTopic Divorce Impact and ConsequeChild development classTopic Divorce Impact and Conseque
Child development classTopic Divorce Impact and Conseque
 
Dmd ir q2_2015_v10
Dmd ir q2_2015_v10Dmd ir q2_2015_v10
Dmd ir q2_2015_v10
 
June Q3 FY13 - Investor Presentation
June Q3 FY13 - Investor PresentationJune Q3 FY13 - Investor Presentation
June Q3 FY13 - Investor Presentation
 
Mutual fund monthly review 06 2013
Mutual fund monthly review 06 2013Mutual fund monthly review 06 2013
Mutual fund monthly review 06 2013
 
Lg ir deck_11.15.16v2
Lg ir deck_11.15.16v2Lg ir deck_11.15.16v2
Lg ir deck_11.15.16v2
 
Lg ir deck_update 05082018_for distribution
Lg ir deck_update 05082018_for distributionLg ir deck_update 05082018_for distribution
Lg ir deck_update 05082018_for distribution
 
iConsumer Investor Deck
iConsumer Investor DeckiConsumer Investor Deck
iConsumer Investor Deck
 
MARKET_CLAMP_PRESENTATION
MARKET_CLAMP_PRESENTATIONMARKET_CLAMP_PRESENTATION
MARKET_CLAMP_PRESENTATION
 
$1FC_MVP for Equity Application.pdf
$1FC_MVP for Equity Application.pdf$1FC_MVP for Equity Application.pdf
$1FC_MVP for Equity Application.pdf
 
Management Buyout MBO As Exit Option Powerpoint Presentation Slides
Management Buyout MBO As Exit Option Powerpoint Presentation SlidesManagement Buyout MBO As Exit Option Powerpoint Presentation Slides
Management Buyout MBO As Exit Option Powerpoint Presentation Slides
 

Recently uploaded

Corporate Presentation Probe June 2024.pdf
Corporate Presentation Probe June 2024.pdfCorporate Presentation Probe June 2024.pdf
Corporate Presentation Probe June 2024.pdf
Probe Gold
 
cyberagent_For New Investors_EN_240424.pdf
cyberagent_For New Investors_EN_240424.pdfcyberagent_For New Investors_EN_240424.pdf
cyberagent_For New Investors_EN_240424.pdf
CyberAgent, Inc.
 
一比一原版(UW毕业证)华盛顿大学毕业证成绩单专业办理
一比一原版(UW毕业证)华盛顿大学毕业证成绩单专业办理一比一原版(UW毕业证)华盛顿大学毕业证成绩单专业办理
一比一原版(UW毕业证)华盛顿大学毕业证成绩单专业办理
ybout
 
2024-deutsche-bank-global-consumer-conference.pdf
2024-deutsche-bank-global-consumer-conference.pdf2024-deutsche-bank-global-consumer-conference.pdf
2024-deutsche-bank-global-consumer-conference.pdf
Sysco_Investors
 
Collective Mining | Corporate Presentation - May 2024
Collective Mining | Corporate Presentation - May 2024Collective Mining | Corporate Presentation - May 2024
Collective Mining | Corporate Presentation - May 2024
CollectiveMining1
 
Investor Day 2024 Presentation Sysco 2024
Investor Day 2024 Presentation Sysco 2024Investor Day 2024 Presentation Sysco 2024
Investor Day 2024 Presentation Sysco 2024
Sysco_Investors
 
Osisko Development - Investor Presentation - June 24
Osisko Development - Investor Presentation - June 24Osisko Development - Investor Presentation - June 24
Osisko Development - Investor Presentation - June 24
Philip Rabenok
 
Snam 2023-27 Industrial Plan - Financial Presentation
Snam 2023-27 Industrial Plan - Financial PresentationSnam 2023-27 Industrial Plan - Financial Presentation
Snam 2023-27 Industrial Plan - Financial Presentation
Valentina Ottini
 

Recently uploaded (8)

Corporate Presentation Probe June 2024.pdf
Corporate Presentation Probe June 2024.pdfCorporate Presentation Probe June 2024.pdf
Corporate Presentation Probe June 2024.pdf
 
cyberagent_For New Investors_EN_240424.pdf
cyberagent_For New Investors_EN_240424.pdfcyberagent_For New Investors_EN_240424.pdf
cyberagent_For New Investors_EN_240424.pdf
 
一比一原版(UW毕业证)华盛顿大学毕业证成绩单专业办理
一比一原版(UW毕业证)华盛顿大学毕业证成绩单专业办理一比一原版(UW毕业证)华盛顿大学毕业证成绩单专业办理
一比一原版(UW毕业证)华盛顿大学毕业证成绩单专业办理
 
2024-deutsche-bank-global-consumer-conference.pdf
2024-deutsche-bank-global-consumer-conference.pdf2024-deutsche-bank-global-consumer-conference.pdf
2024-deutsche-bank-global-consumer-conference.pdf
 
Collective Mining | Corporate Presentation - May 2024
Collective Mining | Corporate Presentation - May 2024Collective Mining | Corporate Presentation - May 2024
Collective Mining | Corporate Presentation - May 2024
 
Investor Day 2024 Presentation Sysco 2024
Investor Day 2024 Presentation Sysco 2024Investor Day 2024 Presentation Sysco 2024
Investor Day 2024 Presentation Sysco 2024
 
Osisko Development - Investor Presentation - June 24
Osisko Development - Investor Presentation - June 24Osisko Development - Investor Presentation - June 24
Osisko Development - Investor Presentation - June 24
 
Snam 2023-27 Industrial Plan - Financial Presentation
Snam 2023-27 Industrial Plan - Financial PresentationSnam 2023-27 Industrial Plan - Financial Presentation
Snam 2023-27 Industrial Plan - Financial Presentation
 

Investor presentation

  • 1. A La Carte Charts LLC A Social Network for Active Investors INVESTOR PRESENTATION
  • 2. PAGE 2 Revenue $17.9Mn Gross Profit $15.8Mn Gross Margin 88% Net Profit $7.7Mn Net Margin 42.9% Year 5 (F) Total Source & Use of Funds Total Source of Funds $4,000,000 Total Use of Funds $2,597,000 Month 1 Starting Cash $1,403,000 Break-Even Analysis Month Operating Break-Even 19 Investment Cash Flow Break-Even 21 Unique Financial Social Media Platform We list all the major crypto-currencies, their price, and performance. In 2014, there were 57M active/self-directed investors in the US In addition to the charts and stock analytics, we will also have the fundamental information available for each stock. (earnings, ex- dividend date, profit, etc.) Investment summary We provide a *proprietary* stock scanner that draws from major markets to provide lists of stocks, easily viewable in pleasing charts Active/self-directed investors comprise 40% of US investor market
  • 4. About us A La Carte Charts LLC is a holding company that invests in services and aims to bring value to investors. The company was created to offer investors and traders a sophisticated, trustworthy, and individualized way to get actionable daily information for the burgeoning self-directed market Founder David Meyers has developed a unique collection of daily information sources that provide systematic and common sense intel for making trades on virtually any market The company is providing a series of digital products for the everyday, “common man” investor. The main product of A La Carte Charts is a social network that includes all the analytical and fundamental data investors are looking for. Mission Our mission is to offer the best financial social media platform on the market. Investors receive, education, up-to- date financial data, their favourite charts set-ups, and a state of the art social media platform any place right from their mobile device. PAGE 4
  • 6. Pick your favourite charts, time frame, and build active lists PAGE 6
  • 7. Current app developments and new features PAGE 7
  • 8. PAGE 8 The Platform’s features: • Complete Social Network A state of the art social network for anyone interested in the stock market. • Intra-day data for stocks. Currently, only the major markets are tracked on the Company scanners, but eventually every stock in the US will be available. • News feed below stock screeners. This way investors can read the most recent and relevant articles of a given stock and chart. • “Chart of the Day” pick emailed daily to subscribers of the app. This keeps them engaged and gives them relevant data to start their research. • Investor “Watch List.” In-app alerts based on scans and watch-list stocks. • Crypto-Currency – we list over 200 of the top crypto-currencies and their latest prices. • Increased Financial Literacy, A safe place to learn about stocks, crypto-currencies, earnings, charts, with discussions and how-to- videos.
  • 10. What are our user goals? PAGE 10 Our primary goal is to attain 2.5M users in the 1st year We are going after the existing 110M Active investors in the U.S. Given the overall market size for active investors, the Company believes that with traditional marketing, guerilla marketing, and the help of peer-to-peer relationships it can acquire 3%* of the market by providing all the features available discussed herein.
  • 11. Industry overview PAGE 11 USA Investment Advice 14,660 Establishments $13.04 B Total Sales $4.8 B Annual Payroll 61,409 Paid Employees $889 K Sales per Establishment $330 K Payroll per Establishment 4.2 Employees per Establishment 37.2% Payroll as a Percent of Sales $79 K Annual Payroll per Employee $212 K Sales per Employee Arizona Investment Advice 358 Establishments $18.5 M Total Sales $79.3 M Annual Payroll 1,444 Paid Employees $517 K Sales per Establishment $221 K Payroll per Establishment 4.0 Employees per Establishment 42.8% Payroll as a Percent of Sales $54 K Annual Payroll per Employee $128 K Sales per Employee
  • 12. Market analysis PAGE 12 28 36 46 58 39 50 65 85 -10 40 90 2013 2014 2015 2016 $Billion App Market Productivity Growth Business & Productivity Consumer Market Business and Productivity App growth Global Asset Under Management Grew to a Record $68.7 Trillion in 2013 5.4 5.2 6.2 2007 2012 2013 Japan and Australia -1 1854.7 60.9 68.7 2007 2012 2013 Global 2 13 27.3 29.4 34 2007 2012 2013 North America 2 16 16.1 18 19.3 2007 2012 2013 Europe 2 7 0.8 1.5 1.7 2007 2012 2013 Latin America 13 8 2.5 3.8 4.4 2007 2012 2013 (excluding Japan and Australia) 149 3 18 1 1.2 1.4 2007 2012 2013 Middle East and Africa Annual growth, 2007-2012 (%) Annual growth, 2013 (%)
  • 13. Market analysis contd.. PAGE 13 This map shows sales per capita for Investment Advice. 0-9 (12) 10-28 (13) 29-42 (13) 43-395 (13)
  • 14. Online trading penetration in the US and retail traders' trading device preferences are rapidly changing PAGE 14 0 100 200 300 400 500 600 1995 1996 1997 1998 1999 2000 2001 2002 2003 2004 2005 2006 2007 2008 2009 2010 2011 2012 2013 Intdractive Broker TD Ameritrade Schwab Trade Station E- Trade Historical Change in Daily Average Revenue Trades, (In thousand of trades per day) https://aitegroup.com/online-trading-penetration-united-states-and-retail-traders-trading-device-preferences-are-rapidly
  • 15. Barriers to entry PAGE 15 • The Company’s proprietary and protected stock screening code resides and works on the server outside the app, providing greater security for the Company The Company owns the proprietary algorithm that creates the screener • Not only is the app proprietary, most app developers generally are not active stock traders, and vice versa, making it even more difficult to reverse engineer product features This app took over two years to perfect, and will still improve
  • 16. Competitors TheStreet.com, Market Smith, eSignal, etc. They are all nice services, but charge money. A La Carte Charts is Free. PAGE 16
  • 18. Valuation. What is the Company worth? PAGE 18 Twitter operates at a loss of -.62c per share. They are valued at $12.47B with 328M users. Broken down, that’s a value of $38 per user without considering their sizeable negative revenues. Should we get to 2.5M users, we compare ourselves to other social media platforms that are smaller in size. Their revenue was $548M meaning that they are able to garner about $1.67 in revenue per user, per quarter through advertising If we extrapolate active users for comparable valuation, A La Carte Charts would be valued at $95M, equating to $33 per membership unit. Should A La Carte charts be able to get 2.5M users and use the same revenue success, we are looking at an expected return of $4.175M in quarterly revenue. Comparing Apples to Apples
  • 19. PAGE 19 Valuation Comparables Other examples of valuation in this space Robinhood a trading app that has approximately 2M users has a current valuation of $1.3B Snapchat has a declining user base, loses -$3 per share and is valued at just under $18B. Stock Twits is also a private company, but has currently raised $14M and been raising money since 2008 that puts them in the same valuation category as Robinhood of about $1.5B valuation with a different business model where they pay writers to create content. In addition, this is based off of only 300K active users. PAGE 19PAGE 19
  • 20. There is no way to know for sure. Markets will ultimately decide what we deserve as a valuation. Can we expect a valuation in that category? “If you build it, they will come.” All we can do is put together the best financial social media platform we can, and strive to make it engaging to users. Put together a great platform for users. Make sure you keep up with their needs. Users will ultimately create the valuation we hope to achieve. They are our biggest asset, in the long run. PAGE 20PAGE 20
  • 21. Buyout goal PAGE 21 • Should a larger company hope to acquire the business, the Founders are not opposed to it. - As long as it creates value for shareholders, and it is a good fit for the company. - Ultimately, it is all about rewarding shareholders. If the price is right, of course we’ll listen. Not opposed to an acquisition • There is a particular music streaming company out there that was hanging their hat on being bought out. They have lost ¾ of their value by not becoming profitable and gaining users. • Being bought out is NOT a business plan, but if you do things the right way, you may find that companies want to buy out your company. Being bought out is not a goal
  • 23. Statement of Cash Flow PAGE 23 Year 1 Year 2 Year 3 Year 4 Year 5 Operating Activities Cash Received Gross Revenue $4,355,303 $8,636,339 $11,016,653 $14,053,021 $17,926,261 Total Cash Received $4,355,303 $8,636,339 $11,016,653 $14,053,021 $17,926,261 Cash used Cost of revenue $522,636 $1,036,361 $1,321,998 $1,686,363 $2,151,151 Payroll/Taxes/Benefits $1,345,500 $1,923,697 $2,255,710 $2,629,738 $2,909,139 Other Operating Expenses $1,482,400 $2,964,800 $3,557,760 $4,269,312 $5,123,174 Additional Inventory $0 $0 $0 $0 $0 Interest Expenses $0 $0 $0 $0 $0 Taxes Accrued $0 $0 $0 $0 $0 Total Cash Used $3,350,536 $5,924,857 $7,135,468 $8,585,413 $10,183,465 Net Cash From/(Used By) Operating $1,004,767 $2,711,481 $3,881,185 $5,467,608 $7,742,796 Investing Activities Cash Received Proceeds from Property/Land $0 $0 $0 $0 $0 Purchase from Equipment $0 $0 $0 $0 $0 Total Cash Received $0 $0 $0 $0 $0 Cash Used Purchase of Property/land $0 $0 $0 $0 $0 Purchase of Equipment $20,000 $20,000 $20,000 $20,000 $20,000 Total Cash Used $20,000 $20,000 $20,000 $20,000 $20,000 Net Cash From/(Used By) Investing ($20,000) ($20,000) ($20,000) ($20,000) ($20,000) Financing Activities Cash Received Proceeds from Investors $0 $0 $0 $0 $0 Proceeds from Long-Term Debt $0 $0 $0 $0 $0 Total Cash Received $0 $0 $0 $0 $0 Cash Used Dividends Paid $0 $0 $0 $0 $0 Repayment of Long-Term Debt $0 $0 $0 $0 $0 Total Cash Used $0 $0 $0 $0 $0 Net Cash From/(Used By) Financing $0 $0 $0 $0 $0 Net Cash Flow $984,767 $2,691,481 $3,861,185 $5,447,608 $7,722,796 Cash Balance $2,387,767 $5,079,248 $8,940,434 $14,388,042 $22,110,838
  • 24. Income Statement PAGE 24 Year 1 Year 2 Year 3 Year 4 Year 5 Gross Revenue $4,355,303 $8,636,339 $11,016,653 $14,053,021 $17,926,261 Direct Cost of Revenue $435,530 $863,634 $1,101,665 $1,405,302 $1,792,626 Merchant Fees $87,106 $172,727 $220,333 $281,060 $358,525 Total Cost of Revenue $522,636 $1,036,361 $1,321,998 $1,686,363 $2,151,151 Gross Profit $3,832,667 $7,599,978 $9,694,655 $12,366,659 $15,775,109 Gross Margin Percent 88.0% 88.0% 88.0% 88.0% 88.0% Operating Expenses Marketing & Advertising $250,000 $500,000 $600,000 $720,000 $864,000 Travel & Entertainment $60,000 $120,000 $144,000 $172,800 $207,360 Rent $36,000 $72,000 $86,400 $103,680 $124,416 Utilities $6,000 $12,000 $14,400 $17,280 $20,736 Insurance $2,400 $4,800 $5,760 $6,912 $8,294 Contractors $960,000 $1,920,000 $2,304,000 $2,764,800 $3,317,760 Legal/ Accounting $120,000 $240,000 $288,000 $345,600 $414,720 Auto $24,000 $48,000 $57,600 $69,120 $82,944 Telephones $24,000 $48,000 $57,600 $69,120 $82,944 Total Pay roll $1,035,000 $1,479,767 $1,735,161 $2,022,876 $2,237,799 Payroll Taxes $155,250 $221,965 $260,274 $303,431 $335,670 Payroll Benefits $155,250 $221,965 $260,274 $303,431 $335,670 Total Operating Expenses $2,827,900 $4,888,497 $5,813,470 $6,899,050 $8,032,313 Operating Profit $1,004,767 $2,711,481 $3,881,185 $5,467,608 $7,742,796 Operating Profit Percentage 23.1% 31.4% 35.2% 38.9% 43.2% Depreciation $39,708 $42,208 $44,708 $47,208 $49,708 Earning Before Interest & Taxes $965,059 $2,669,273 $3,836,477 $5,420,400 $7,693,088 EBIT Percentage 22.2% 30.9% 34.8% 38.6% 42.9% Interest Expense $0 $0 $0 $0 $0 Taxes Accrued $0 $0 $0 $0 $0 Earnings $965,059 $2,669,273 $3,836,477 $5,420,400 $7,693,088 Earnings Percentage 22.2% 30.9% 34.8% 38.6% 42.9%
  • 25. Balance Sheet PAGE 25 Year 1 Year 2 Year 3 Year 4 Year 5 Assets Current Assets Cash $2,387,767 $5,079,248 $8,940,434 $14,388,042 $22,110,838 Inventory $0 $0 $0 $0 $0 Other Current Assets $0 $0 $0 $0 $0 Total Current Assets $2,387,767 $5,079,248 $8,940,434 $14,388,042 $22,110,838 Long-Term Assets Property $0 $0 $0 $0 $0 Equipment $86,000 $106,000 $126,000 $146,000 $166,000 Build-out $250,000 $250,000 $250,000 $250,000 $250,000 Accumulated Depreciation ($39,708) ($81,917) ( $ 1 2 6 , 6 2 5 ) ($173.833) ($223,542) Total Long-Term Assets $ 2 9 6 , 2 9 2 $274,083 $249,375 $222.167 $192,458 Total Assets $2,684,059 $5,353,332 $9,189.809 $14,610,209 $22,303,296 Liabilities Current Liabilities Current Debt $0 $0 $0 $0 $0 Total Current Liabilities $0 $0 $0 $0 $0 Long-Term Liabilities Long-Term Debt $0 $0 $0 $0 $0 New Long-Term Debt $0 $0 $0 $0 $0 Total Long-Term Liabilities $0 $0 $0 $0 $0 Total Liabilities $0 $0 $0 $0 $0 Shareholders' Equity Paid-In Capital Owner $0 $0 $0 $0 $0 Investor $4,000,000 $4,000,000 $4,000,000 $4,000,000 $4,000,000 New Paid-In Capital $0 $0 $0 $0 $0 Total Paid-In Capital $4,000,000 $4,000,000 $4,000,000 $4,000,000 $4,000,000 Retained Earnings Previous Retained Earnings ($2,281,000) ($1,315,941) $1,353,332 $5,189,809 $10,610,209 Current Earnings $965,059 $2,669,273 $3,836,477 $5,420,400 $7,693,088 Total Retained Earnings ($1,315,941) $1,353,332 $5,189,809 $10,610,209 $18,303,296 Total Shareholders' Equity $2,684,059 $5,353,332 $9,189,809 $14,610,209 $22,303,296 Total Liabilities & Equity $2,684,059 $5,353,332 $9,189,809 $14,610,209 $22,303,296
  • 26. THANK YOU CONTACT Add Phone e mail Web 42211 N. 41st Drive, Phoenix, AZ 85086 (425) 949-9196 davidmeyers@ALaCarteCharts.com www.ALaCarteCharts.com