The document discusses key concepts in probability, including:
1. Probability is a numerical statement between 0 and 1 that indicates the likelihood of an event occurring.
2. The probabilities of all possible outcomes of an activity must sum to 1.
3. Probability can be determined objectively using relative frequency from historical data or subjectively based on expert judgment.
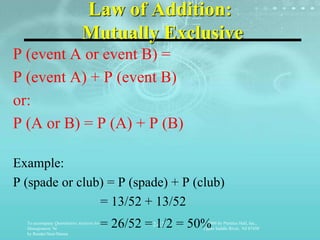
4. Events are mutually exclusive if only one can occur, and collectively exhaustive if their probabilities include all possible outcomes.