Database Searching
• KeywordSearching Database entries,
that contain a keyword specified.
(IRX, SRS, ….)
• Sequence Searching Similar sequences,
and their alignment with the
query sequence.
(FastA, Blast, ….)
3.
Sequence Searching
• Thecomparison of a sequence against a database ….
• The comparison of a pattern, a profile, or a HMM against a
database ….
In order to find similar sequences
In order to find weaker similarities.
Search
strategies:
4.
Sequence Searching
• Sensitivesearching using rigorous searching algorithms:
• Extremely fast searching using heuristic searching algorithms:
- Smith - Waterman search: accurate comparison
computing time !
special hardware (Bioccelerator)
- Approximations in comparison: insertions and
deletions are widely ignored
reduced computing time!
Search
algorithms:
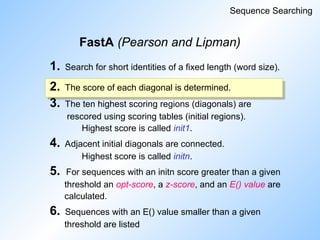
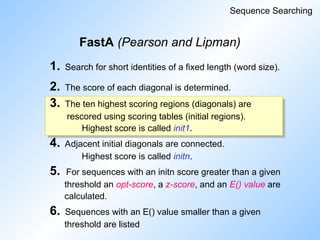
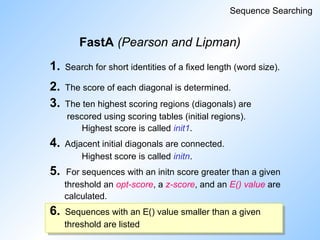
FastA (Pearson andLipman)
Sequence Searching
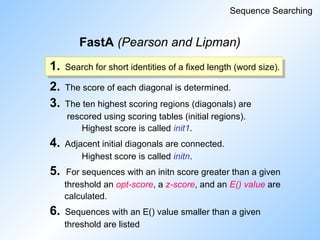
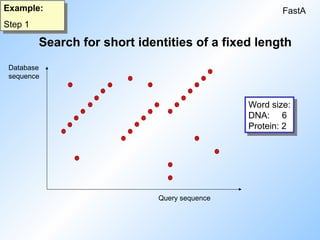
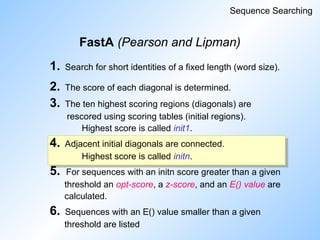
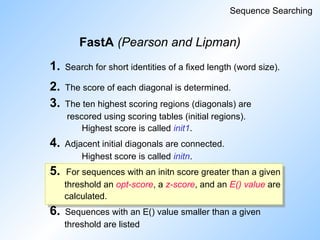
1. Search for short identities of a fixed length (word size).
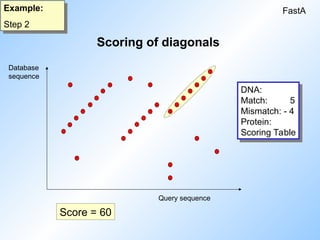
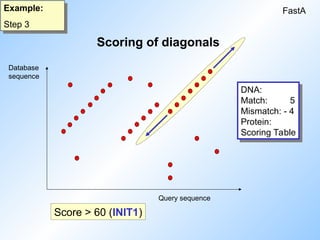
2. The score of each diagonal is determined.
3. The ten highest scoring regions (diagonals) are
rescored using scoring tables (initial regions).
Highest score is called init1.
4. Adjacent initial diagonals are connected.
Highest score is called initn.
5. For sequences with an initn score greater than a given
threshold an opt-score, a z-score, and an E() value are
calculated.
6. Sequences with an E() value smaller than a given
threshold are listed
7.
Search for shortidentities of a fixed length
FastA
Example:
Step 1
Database
sequence
Query sequence
Word size:
DNA: 6
Protein: 2
8.
FastA (Pearson andLipman)
Sequence Searching
1. Search for short identities of a fixed length (word size).
2. The score of each diagonal is determined.
3. The ten highest scoring regions (diagonals) are
rescored using scoring tables (initial regions).
Highest score is called init1.
4. Adjacent initial diagonals are connected.
Highest score is called initn.
5. For sequences with an initn score greater than a given
threshold an opt-score, a z-score, and an E() value are
calculated.
6. Sequences with an E() value smaller than a given
threshold are listed
13.
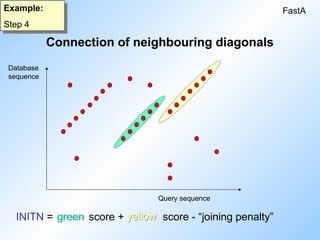
Connection of neighbouringdiagonals
FastA
Example:
Step 4
INITN = score + score - “joining penalty”
Database
sequence
Query sequence
yellow
green
14.
FastA (Pearson andLipman)
Sequence Searching
1. Search for short identities of a fixed length (word size).
2. The score of each diagonal is determined.
3. The ten highest scoring regions (diagonals) are
rescored using scoring tables (initial regions).
Highest score is called init1.
4. Adjacent initial diagonals are connected.
Highest score is called initn.
5. For sequences with an initn score greater than a given
threshold an opt-score, a z-score, and an E() value are
calculated.
6. Sequences with an E() value smaller than a given
threshold are listed
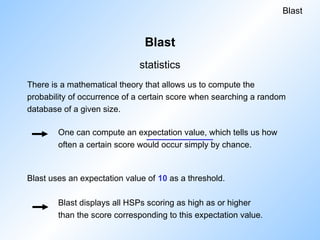
17.
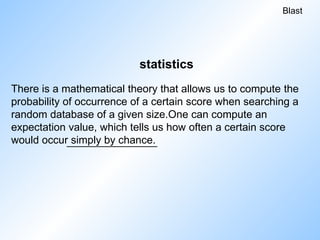
There is amathematical theory that allows us to compute the
probability of occurrence of a certain score when searching a
random database of a given size.One can compute an
expectation value, which tells us how often a certain score
would occur simply by chance.
Blast
statistics
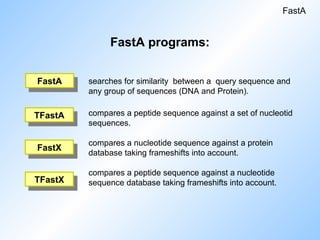
FastA programs:
searches forsimilarity between a query sequence and
any group of sequences (DNA and Protein).
compares a peptide sequence against a set of nucleotid
sequences.
compares a nucleotide sequence against a protein
database taking frameshifts into account.
compares a peptide sequence against a nucleotide
sequence database taking frameshifts into account.
FastA
TFastX
FastX
TFastA
FastA
22.
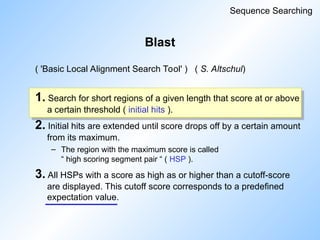
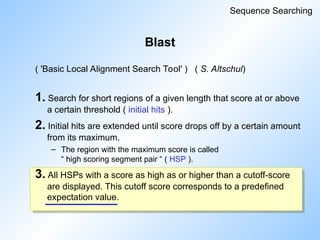
Blast
( 'Basic LocalAlignment Search Tool' ) ( S. Altschul)
1. Search for short regions of a given length that score at or above
a certain threshold ( initial hits ).
2. Initial hits are extended until score drops off by a certain amount
from its maximum.
– The region with the maximum score is called
“ high scoring segment pair “ ( HSP ).
3. All HSPs with a score as high as or higher than a cutoff-score
are displayed. This cutoff score corresponds to a predefined
expectation value.
Sequence Searching
26.
Blast
Example:
Step 2
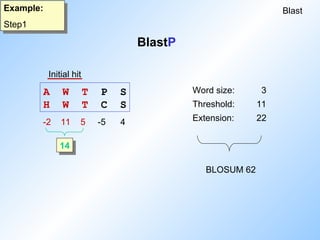
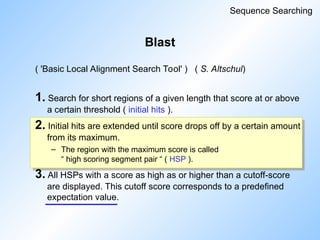
Word size:3
Threshold: 11
Extension: 22
BLOSUM 62
A W T P S
H W T C S
-2 11 5 -5 4
14
9
13
Initial hit
BlastP
Blast
Example:
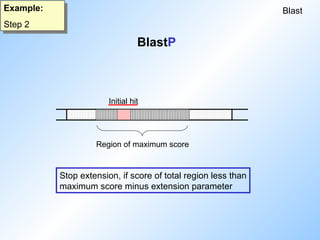
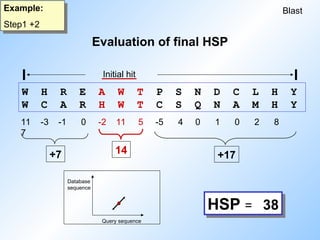
Step1 +2
W HR E A W T P S N D C L H Y
W C A R H W T C S Q N A M H Y
11 -3 -1 0 -2 11 5 -5 4 0 1 0 2 8
7
Initial hit
14
+7 +17
Database
sequence
Query sequence
HSP = 38
Evaluation of final HSP
29.
Blast
( 'Basic LocalAlignment Search Tool' ) ( S. Altschul)
1. Search for short regions of a given length that score at or above
a certain threshold ( initial hits ).
2. Initial hits are extended until score drops off by a certain amount
from its maximum.
– The region with the maximum score is called
“ high scoring segment pair “ ( HSP ).
3. All HSPs with a score as high as or higher than a cutoff-score
are displayed. This cutoff score corresponds to a predefined
expectation value.
Sequence Searching
30.
Blast
There is amathematical theory that allows us to compute the
probability of occurrence of a certain score when searching a random
database of a given size.
One can compute an expectation value, which tells us how
often a certain score would occur simply by chance.
Blast uses an expectation value of 10 as a threshold.
Blast displays all HSPs scoring as high as or higher
than the score corresponding to this expectation value.
Blast
statistics
31.
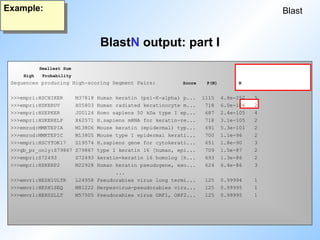
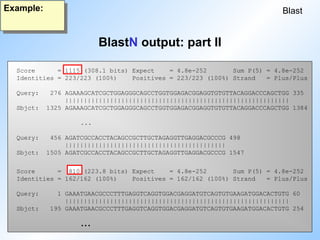
BlastN output: partI
Blast
Example:
Smallest Sum
High Probability
Sequences producing High-scoring Segment Pairs: Score P(N) N
>>>empri:HSCHIKER M37818 Human keratin (psi-K-alpha) p... 1115 4.8e-252 5
>>>empri:HSKERUV X05803 Human radiated keratinocyte m... 718 6.0e-106 2
>>>empri:HSEPKER J00124 Homo sapiens 50 kDa type I ep... 687 2.4e-105 4
>>>empri:HSKERELP X62571 H.sapiens mRNA for keratin-re... 718 3.1e-105 2
>>>emrod:MMKTEPIA M13806 Mouse keratin (epidermal) typ... 691 5.3e-101 2
>>>emrod:MMKTEPIC M13805 Mouse type I epidermal kerati... 700 1.1e-96 2
>>>empri:HSCYTOK17 Z19574 H.sapiens gene for cytokerati... 651 1.8e-90 3
>>>gb_pr_only:S79867 S79867 type I keratin 16 [human, epi... 709 1.5e-87 2
>>>empri:S72493 S72493 keratin=keratin 16 homolog [h... 693 1.3e-86 2
>>>empri:HSKERP2 M22928 Human keratin pseudogene, exo... 624 6.4e-86 3
...
>>>emvrl:HESH1ULTR L24958 Pseudorabies virus long termi... 125 0.99994 1
>>>emvrl:HESH1SEQ M81222 Herpesvirus-pseudorabies viru... 125 0.99995 1
>>>emvrl:HEHSSLLT M57505 Pseudorabies virus ORF1, ORF2... 125 0.99995 1
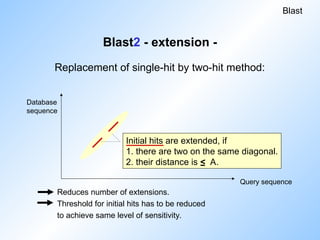
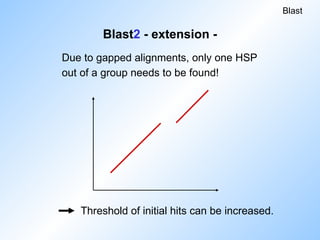
Blast2 - extension-
Reduces number of extensions.
Threshold for initial hits has to be reduced
to achieve same level of sensitivity.
Blast
Database
sequence
Query sequence
Initial hits are extended, if
1. there are two on the same diagonal.
2. their distance is < A.
Replacement of single-hit by two-hit method:
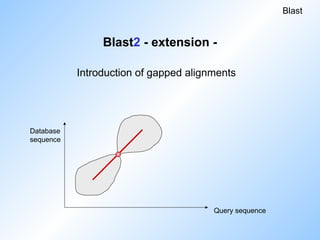
Blast2 - extension-
Due to gapped alignments, only one HSP
out of a group needs to be found!
Blast
Threshold of initial hits can be increased.
38.
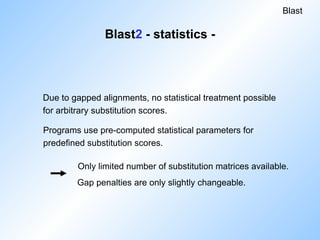
Programs use pre-computedstatistical parameters for
predefined substitution scores.
Only limited number of substitution matrices available.
Gap penalties are only slightly changeable.
Blast
Due to gapped alignments, no statistical treatment possible
for arbitrary substitution scores.
Blast2 - statistics -
39.
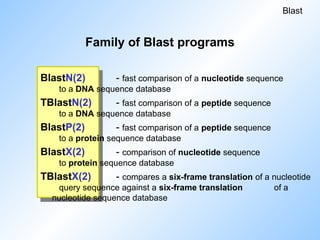
Family of Blastprograms
BlastN(2) - fast comparison of a nucleotide sequence
to a DNA sequence database
TBlastN(2) - fast comparison of a peptide sequence
to a DNA sequence database
BlastP(2) - fast comparison of a peptide sequence
to a protein sequence database
BlastX(2) - comparison of nucleotide sequence
to protein sequence database
TBlastX(2) - compares a six-frame translation of a nucleotide
query sequence against a six-frame translation of a
nucleotide sequence database
Blast
40.
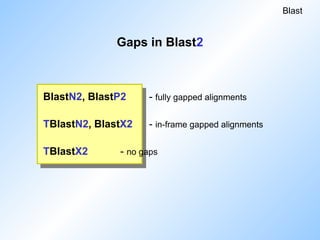
Gaps in Blast2
BlastN2,BlastP2 - fully gapped alignments
TBlastN2, BlastX2 - in-frame gapped alignments
TBlastX2 - no gaps
Blast
41.
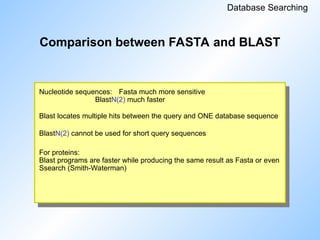
Nucleotide sequences: Fastamuch more sensitive
BlastN(2) much faster
Blast locates multiple hits between the query and ONE database sequence
BlastN(2) cannot be used for short query sequences
For proteins:
Blast programs are faster while producing the same result as Fasta or even
Ssearch (Smith-Waterman)
Comparison between FASTA and BLAST
Database Searching
42.
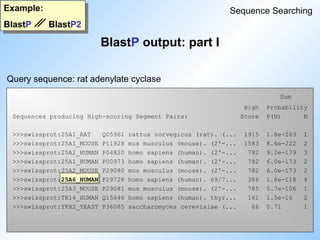
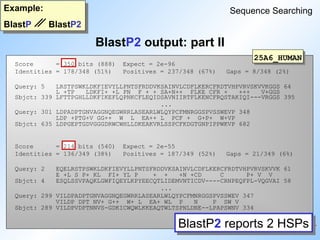
Sum
High Probability
Sequences producingHigh-scoring Segment Pairs: Score P(N) N
>>>swissprot:25A1_RAT Q05961 rattus norvegicus (rat). (... 1915 1.8e-263 1
>>>swissprot:25A1_MOUSE P11928 mus musculus (mouse). (2'-... 1583 8.6e-222 2
>>>swissprot:25A2_HUMAN P04820 homo sapiens (human). (2'-... 782 9.2e-179 3
>>>swissprot:25A1_HUMAN P00973 homo sapiens (human). (2'-... 782 6.0e-173 2
>>>swissprot:25A2_MOUSE P29080 mus musculus (mouse). (2'-... 782 6.0e-173 2
>>>swissprot:25A6_HUMAN P29728 homo sapiens (human). 69/7... 386 1.8e-118 4
>>>swissprot:25A3_MOUSE P29081 mus musculus (mouse). (2'-... 785 5.7e-106 1
>>>swissprot:TR14_HUMAN Q15646 homo sapiens (human). thyr... 161 1.5e-16 2
>>>swissprot:YKH2_YEAST P36085 saccharomyces cerevisiae (... 66 0.71 1
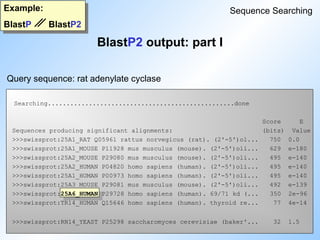
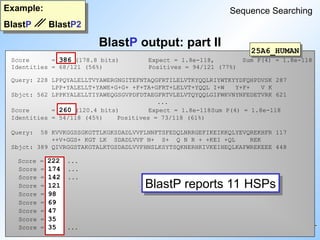
BlastP output: part I
Example:
BlastP BlastP2
Sequence Searching
Query sequence: rat adenylate cyclase
Sequence Searching
• Thecomparison of a sequence against a database ….
• The comparison of a pattern, a profile, or a HMM against a
database ….
In order to find similar sequences
In order to find weaker similarities.
Search
strategies:
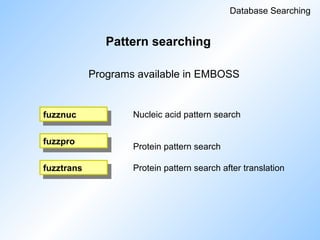
Pattern searching
Database Searching
Nucleicacid pattern search
Protein pattern search
Protein pattern search after translation
Programs available in EMBOSS
fuzznuc
fuzztrans
fuzzpro
57.
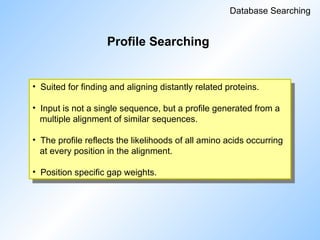
Profile Searching
Database Searching
•Suited for finding and aligning distantly related proteins.
• Input is not a single sequence, but a profile generated from a
multiple alignment of similar sequences.
• The profile reflects the likelihoods of all amino acids occurring
at every position in the alignment.
• Position specific gap weights.
58.
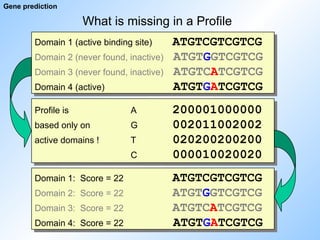
What is missingin a Profile
Domain 1 (active binding site) ATGTCGTCGTCG
Domain 2 (never found, inactive) ATGTGGTCGTCG
Domain 3 (never found, inactive) ATGTCATCGTCG
Domain 4 (active) ATGTGATCGTCG
Gene prediction
Profile is A 200001000000
based only on G 002011002002
active domains ! T 020200200200
C 000010020020
Domain 1: Score = 22 ATGTCGTCGTCG
Domain 2: Score = 22 ATGTGGTCGTCG
Domain 3: Score = 22 ATGTCATCGTCG
Domain 4: Score = 22 ATGTGATCGTCG
59.
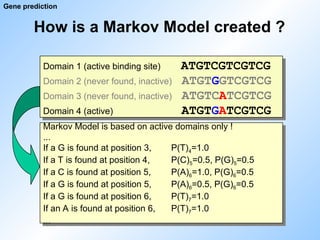
How is aMarkov Model created ?
Gene prediction
Markov Model is based on active domains only !
...
If a G is found at position 3, P(T)4=1.0
If a T is found at position 4, P(C)5=0.5, P(G)5=0.5
If a C is found at position 5, P(A)6=1.0, P(G)6=0.5
If a G is found at position 5, P(A)6=0.5, P(G)6=0.5
If a G is found at position 6, P(T)7=1.0
If an A is found at position 6, P(T)7=1.0
...
Domain 1 (active binding site) ATGTCGTCGTCG
Domain 2 (never found, inactive) ATGTGGTCGTCG
Domain 3 (never found, inactive) ATGTCATCGTCG
Domain 4 (active) ATGTGATCGTCG
60.
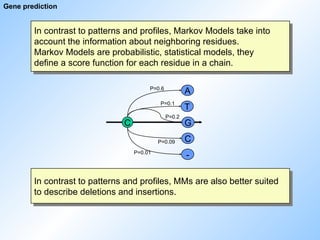
Gene prediction
In contrastto patterns and profiles, Markov Models take into
account the information about neighboring residues.
Markov Models are probabilistic, statistical models, they
define a score function for each residue in a chain.
In contrast to patterns and profiles, MMs are also better suited
to describe deletions and insertions.
C G
C
-
T
A
P=0.6
P=0.1
P=0.2
P=0.09
P=0.01
61.
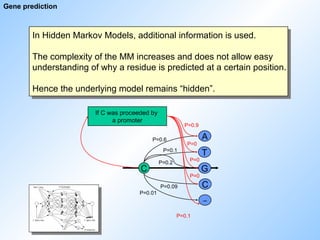
Gene prediction
In HiddenMarkov Models, additional information is used.
The complexity of the MM increases and does not allow easy
understanding of why a residue is predicted at a certain position.
Hence the underlying model remains “hidden”.
P=0.6
P=0.1
P=0.2
P=0.09
P=0.01
If C was proceeded by
a promoter
P=0.1
P=0.9
P=0
P=0
P=0
G
C
-
T
A
C
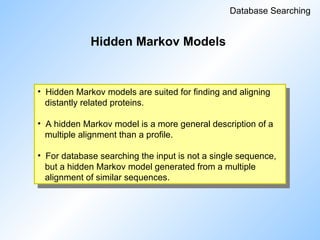
Hidden Markov Models
DatabaseSearching
• Hidden Markov models are suited for finding and aligning
distantly related proteins.
• A hidden Markov model is a more general description of a
multiple alignment than a profile.
• For database searching the input is not a single sequence,
but a hidden Markov model generated from a multiple
alignment of similar sequences.
64.
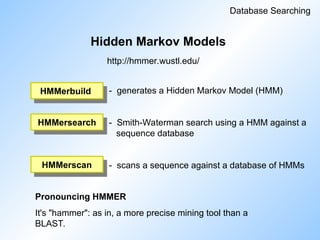
Hidden Markov Models
DatabaseSearching
- generates a Hidden Markov Model (HMM)
- Smith-Waterman search using a HMM against a
sequence database
- scans a sequence against a database of HMMs
HMMerbuild
HMMersearch
HMMerscan
Pronouncing HMMER
It's "hammer": as in, a more precise mining tool than a
BLAST.
http://hmmer.wustl.edu/
65.
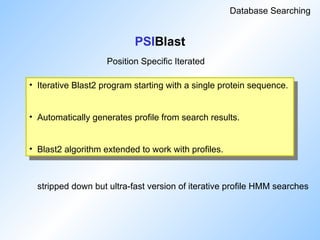
PSIBlast
Database Searching
• IterativeBlast2 program starting with a single protein sequence.
• Automatically generates profile from search results.
• Blast2 algorithm extended to work with profiles.
stripped down but ultra-fast version of iterative profile HMM searches
Position Specific Iterated
66.
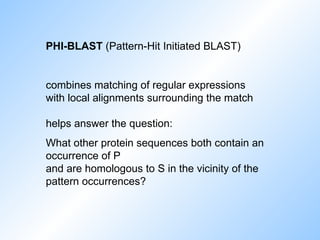
PHI-BLAST (Pattern-Hit InitiatedBLAST)
combines matching of regular expressions
with local alignments surrounding the match
helps answer the question:
What other protein sequences both contain an
occurrence of P
and are homologous to S in the vicinity of the
pattern occurrences?
67.
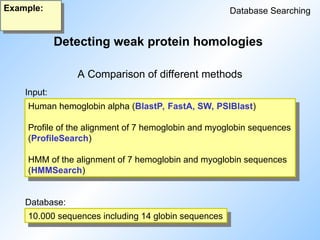
Detecting weak proteinhomologies
Database Searching
Example:
A Comparison of different methods
Human hemoglobin alpha (BlastP, FastA, SW, PSIBlast)
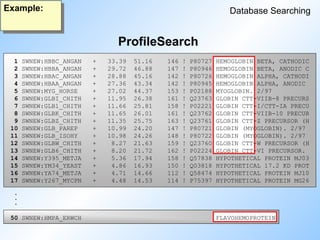
Profile of the alignment of 7 hemoglobin and myoglobin sequences
(ProfileSearch)
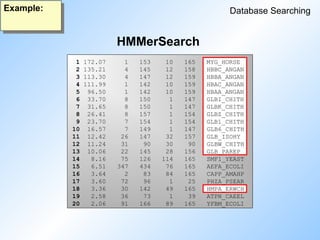
HMM of the alignment of 7 hemoglobin and myoglobin sequences
(HMMSearch)
Input:
Database:
10.000 sequences including 14 globin sequences
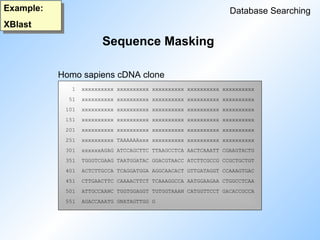
Sequence Masking
Database Searching
Example:
HighSmallest Sum
Sequences producing High-scoring Segment Pairs: Score Probability P(N) N
emhum1:HS367641 U36764 Human TGF-beta receptor interac.. 470 1.6e-53
3
emhum2:HSU39067 U39067 Human translation initiation fa.. 461 1.1e-52
3
emhum1:AC004161 Ac004161 Homo sapiens BAC clone RG208K.. 249 1.4e-23
3
empln:AT36765 U36765 Arabidopsis thaliana TGF-beta r.. 189 2.3e-05
1
eminv:DMU90930 U90930 Drosophila melanogaster TRIP-1 .. 189 2.3e-05
1
emfun:SPD187 D89187 Schizosaccharomyces pombe mRNA,.. 150 0.045
1
emfun:SPSUM1 Y09529 S.pombe mRNA for SUM1 protein. .. 150 0.046
1
emnew:SPSUM1 Y09529 S.pombe mRNA for SUM1 protein. .. 150 0.046
1
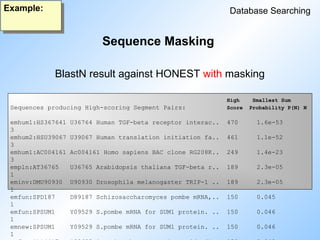
BlastN result against HONEST with masking
79.
Database Searching
Example:
WARNING: Descriptionsof 30,108 database sequences
were not reported due to the limiting value
of parameter -LIST=500.
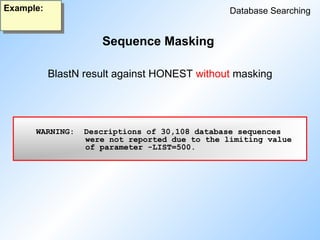
BlastN result against HONEST without masking
Sequence Masking
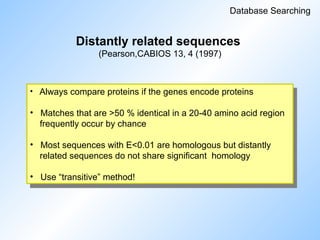
Distantly related sequences
(Pearson,CABIOS13, 4 (1997)
Database Searching
• Always compare proteins if the genes encode proteins
• Matches that are >50 % identical in a 20-40 amino acid region
frequently occur by chance
• Most sequences with E<0.01 are homologous but distantly
related sequences do not share significant homology
• Use “transitive” method!
Editor's Notes
#1 Database searching course part of the HUSAR advanced course.
Time: 2 * 45 minutes with a break at an appropriate point (before Blast2-part).
Make cross-references to pairwise and multiple alignment parts. But do not repeat this theory.
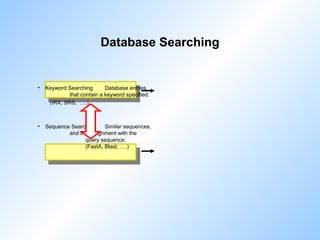
#2 What we want to achieve with database searching is to find sequences that are similar to our query.
Databases can be searched by keyword or by sequence.
Keyword searches check the database for the appearance of the keyword in the entries. This is a simple ‘string‘ search. Programs doing this are SRS or IRX.
Sequence searches look for sequences that are similar to the query sequence and show the alignment between the query and the hit.
This asks for a pairwise sequence alignment program.
#3 Two strategies can be followed when comparing a sequence to a database.
One can compare the whole sequence against a database, in order to find similar sequences.
One can compare a pattern, profile or hidden Markov model derived from the sequence against a database, in order to detect weaker similarities.
This often reflects the more biological situation in which sequences only share homologous domains or regions.
#4 Sequence searching is in principle a repeated pairwise alignment.
The SW-algorithm looks for local alignments and is therefore ideal for db-searching.
The disadvantage is that it is too slow (12*106 entries in EMBL)
Therefore we need heuristic methods.
#5 Heuristic algorithms available are:
FastA, Pearson, University of Virginia
Blast, Altschul, NCBI
#6 We will go through the FastA algorithm in a step-by-step manner.
The first thing FastA does is to look for short identities of a fixed length (word size). There has to be an EXACT match!
--
In the first step of this search, the comparison can be viewed as a set of dot plots, with the query as the vertical sequence and the group of sequences to which the query is being compared as the different horizontal sequences. This first step finds the registers of comparison (diagonals) having the largest number of short perfect matches (words) for each comparison.
#7 A dotplot is built up of the query sequence against every single database sequence.
Every time the wordsize condition is fulfilled a dot appears (in the middle of the wordsize) For DNA the wordsize is usually 6, for proteins it is 2.
A diagonal of several dots means that upon shifting by one base/residue the condition is still fulfilled. Example: diagonal of seven spots: 6+1+1+1+1+1+1=12 matches.
The wordsize has influence on the running time. The smaller it is the longer it takes, especially for DNA.
#8 In the second step the score of each diagonal is determined
--
In the first step of this search, the comparison can be viewed as a set of dot plots, with the query as the vertical sequence and the group of sequences to which the query is being compared as the different horizontal sequences. This first step finds the registers of comparison (diagonals) having the largest number of short perfect matches (words) for each comparison.
#9 The score for each diagonal is determined, using a scoring table.
For DNA this is a simple one, for proteins more complex tables are used, containing score values for ecery possible amino acid pair.
When talking about DNA the score of the indicatied diagonal would be :
6 * 5 = 30 for the first dot + 5 for every next dot = 60.
#10 Then the ten highest scoring diagonals are rescored using a scoring matrix that allows conservative replacements, ambiguity symbols, and runs of identities shorter than the size of a word.
The highest score is called init1
#11 The highest scoring diagonals are rescored and extended. Now also mismatches are scored. And other matsches below the wordsize of 6 that might be on the diagonal are also taken into account.
The score of each diagonal is calculated. The best score is called init1.
#12 Now the program checks to see if some of these initial highest-scoring diagonals can be joined together.
The highest scoring joint construction is initn
#13 Connection of diagonals of course means the introduction of a gap. The best of all the combined diagonal scores is called initn.
In the example: green + yellow - some penalty for joining.
#14 Points 1-4 are performed for every sequence in the database. So you have a whole collection of initn scores.
All that have an initn score above a certain threshold are are taken. The program sets the threshold. There is a parameter for it, but it is not easy to use this.
With the selected sequences a SW alignment is performed and an opt-score, z-score and E() value is calculated.
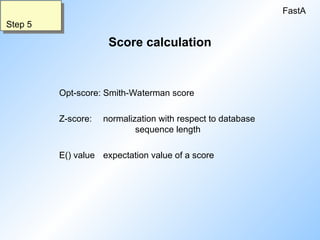
#15 Opt-score:
Optimized score: SW score calculated from BLOSUM/PAM matrices. This score is length dependent.
Z-score:
normalization according to length.
E() value:
Erwartungswert, includes statistics.
How often do I find sequence x in this database by chance.
E=10 => no significance
E=10-48 => very likely a real similarity (homology).
#16 Sequences with an E() value smaller than a given threshold are listed. The standard is: E() < 2.
#17 Go through sheet.
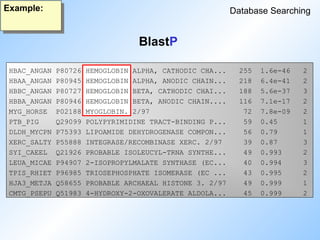
Blast displays the sequences with a score higher than the threshold and an expectation value lower than the threshold.
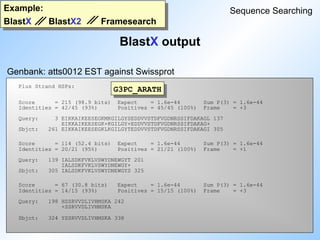
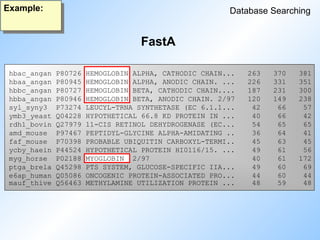
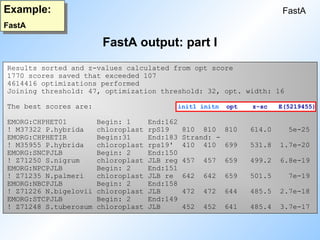
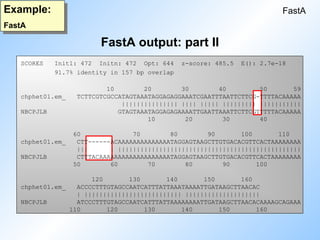
#18 Here is an example of a fastA output. Showing the values discussed in the sheet before (init1, initn, opt-score, z-score and E() value).
N.B:
Explain the notation: 5e-25.
A higher E() value does not always mean biologically irrelevant.
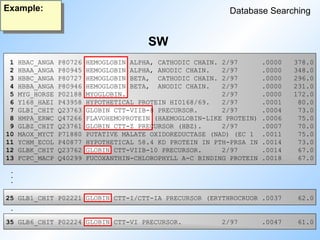
#19 Here we see the alignments.
We see the original three hits, two gaps.
The smaller gap was closed, the second one was too big.
Draw situation on blackboard!
| x
| x
| x
| x
| x
| x 472 init1 / initn
| x
| x
| x
| x
| x
| x
| x
|_______________________________________
#20 Some programs in HUSAR that use the FastA algorithm.
#22 Now we will look at the details of the Blast algorithm
Blast stands for: Basic Local Alignment Search Tool
In the first step the Blast algorithm looks for short stretches of a given length that score above a certain threshold (window stringency).
These are called initial hits.
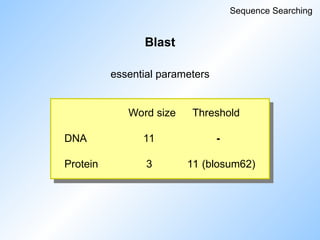
#23 Here are the essential parameters of Blast.
Of course the threshold for proteins is dependent on the comparison table used (here: blosum62).
#24 This shows one possible alignment of two sequences. All other possible alignments of these two sequences are also checked!
The initial hit with wordsize 3 has a score of 14, which is above the threshold.
#25 Initial hits are now extended.
The region with the maximum score is called an HSP.
#26 This shows how the extension works. The alignment gets extended until the score drops off by a certain amount from its maximum.
14 - 5 = 9 ; 9 > 14 - 22 = 8, so extension continues.
9 + 4 = 13 ; 13 > 9 - 22 = -13, so extension continues.
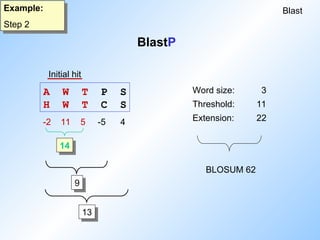
#27 Extension is stopped by either the extension rule, or the end of the sequence.
What is taken as the alignment? When the extension rule applies, the alignment is already bad!
What is taken is the maximal score. This is not necessarily the last score; mostly not.
#28 So if we look at our example again we see that the maximum score is 38, obtained by this region. This is called the high scoring segment pair (HSP).
It corresponds to a diagonal in the dotplot (without gaps!!).
#29 All HSPs with a score as high as or higher than the cutoff score are displayed.
The cutoff score corresponds to a predefined expectation value.
#30 Go through sheet.
Blast displays the sequences with a score higher than the threshold and an expectation value lower than the threshold.
#31 An example of a blast output showing the parameters discussed before.
N gives the number of HSPs within one sequence that were significant (differnce to FastA!!).
The high score is the highest score of one of the N hits in the sequence.
P(N) is the probability (Wahrscheinlichkeit). This is just an other way of expressing the expectation value, if the size of the database is known.
#32 Here we see the alignment output for two of the hits in the first sequence of the list (N=5).
Note that there are no gaps!
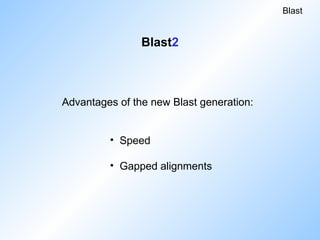
#33 The main problems of Blast are the fact that it is not fast enough and that it does not deal with gaps.
#35 80-85 procent of the calculation time in blast is consumed by initial hit extension.
So, in Blast2 extension is only done if two initial hits are on one diagonal with a distans <= A.
This reduces the number of extensions, but sensitivity gets lost.
So in fact the threshold should be brought down, which puts you back to the beginning again.
But the introduction of gaps gets us out of this impasse.
#36 How can we deal with gaps?
FastA does a SW with the best hits.
In Blast this would take too much time in comparison to the rest of the program.
Therefore the SW matrix is only calculated around the HSP.
Starting from a fixed point in the HSP, a pair of amino acids or bases within the highest scoring region of the HSP, two 'clouds' of the SW matrix are calculated.
#37 In this way 'lost HSPs' can be picked up againg by the SW / gap search.
Therefore only one of the two diagonals shown has to be found. The other one will be picked up by the SW / gap search.
#38 Read slide.
Due to the gapped alignments no real statistics can be performed with Blast2.
Precomputed statistical parameters are used.
#39 Blast programs available in HUSAR.
Go through slide.
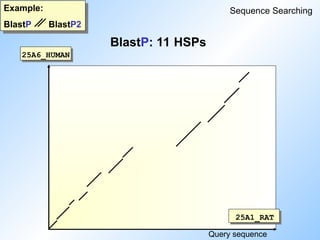
#42 Now some examples of comparisons between different programs will be presented.
First BlastP will be compared to BlastP2.
Searching with rat adenylate cyclase we find a hit for Human sequence:
25A6_HUMAN.
#46 Looking at the 'dotplot' we see that BlastP picked up all the eleven single diagonals.
Whereas BlastP2 combined seven and four diagonals into two gapped algnments. The gap between these two diagonals was to big to be bridged.
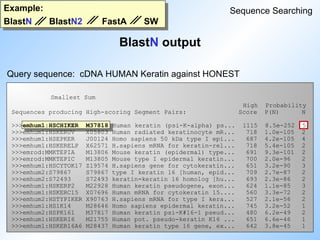
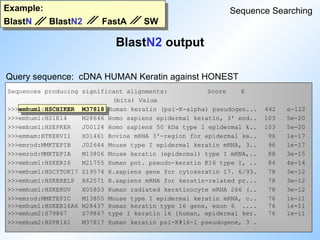
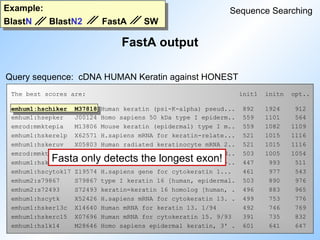
#47 Comparison of BlastN, BlastN2, FastA and SW.
The query sequence is Human Keratin cDNA and the database is HONEST (= GeAll minus ESTs, STSs, HTGs, GSSs).
BlastN picks up HSCIKER M37818. N=5, so all exons are picked up.
#51 With BlastX you will have to compbine yourself. And sometimes the different hits are not nicely grouped together like here, but interspersed with many other hits.
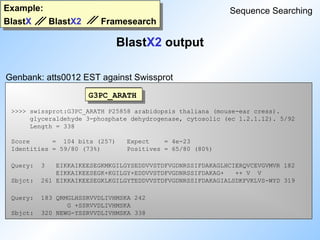
#52 In BlastX2 gapped alignments mix things up. The middle part is now completely unclear.
#53 The second strategy for sequence searching is comparing a pattern, profile or hidden Markov model of the sequence against a database, in order to detect weaker similarities.
N.B: This part can be presented relatively quick.
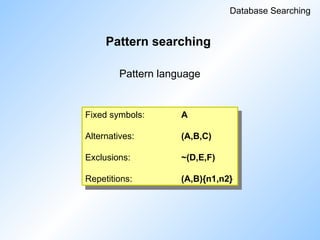
#54 In pattern searching a certain language is used to define patterns in a sequence.
Explain table.
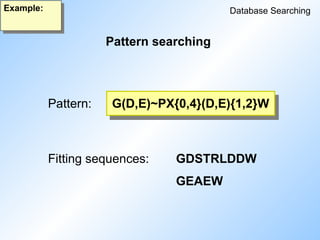
#55 This is an example of a pattern.
Sequences fitting the pattern should contain: a G, a D or an E, not a P, 0-4 residues of any kind, a D or an E and 1-2 Ws.
Both sequences below fit to the pattern.
#56 Programs in HUSAR for pattern searching.
Read slide.
#57 Profile searching: read slide.
Explain on blackboard how a prfile is generated from a multiple alignment.
The search algorithm is a modified Smith Waterman. The score of a certain pair is multplied by the relative occurance of a residue in the multiple alignment.
#58 Lets presume we have a sequence which can bind, a transcription factor: domain 1 is thus ‚active‘
If we make a single point mutation, we end up with either domain 2 or 3, which can not bind a transcription factor anymore, and which are thus inactive (therefore grey)
However, if we have both these point mutations, we get reactivation, the transcription factor can bind again, and domain 4 is active. Situations like this can be found in many cases.
to great a profile, only active domains are used (black). Inactive domains are ignored (grey).
We end up with the profile as shown in the middle panel. Explain the numbers.
Now we use this profile to calculate a score for the 4 domains. Bad surprise ! Although domain 2 and 3 are completely inactive, they receive the same score as domain 1 and 4 !
Conclusion: a profile is not sufficient to describe this situation.
How can we solve this ?
To build a profile just count the occurence of nucleotides in active domains.
#59 We can create a better ‚profile‘, named a markov model.
Again, the markov model is only based on the active, black domains.
Now explain the frequecies depicted in the yellow box. This is sometimes difficult for the audience, careful ! Be sure that you understand this completely
It´s always: If a nucleotide is found at a certain position, then the probability for the next position being filled in by a certain nucleotide is ...
#60 This is the conclusion of the preceeding five slides.
#61 If the markov model has identified a promoter, the application will know that an exon starting with an ATG has to be found next. Naturally, the program will not start looking for a poly adenylation site at this point, that wouldn‘t make any sense. This knowledge is used to choose a different set of frequencies, namely those specific for finding a start codon.
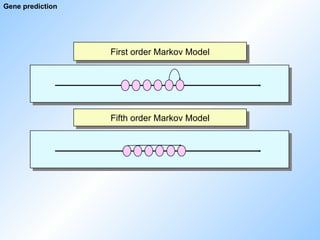
#62 first order - 1 relation
5th order - 5 relationen
up to 18th order,
computing power becomes limiting if we increase the order.
model can use preceeding, succeeding or surrounding residues. In theory, the relationship between a base and five bases 100 residues upstream could also be used (don‘t know any examples for this though). The developers try several models naturally to figure out what is the best method.
#64 Programs in HUSAR for HMM searching.
Read slide.
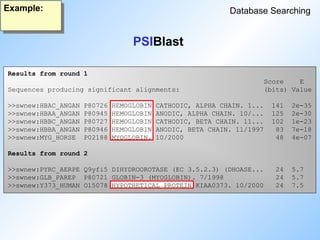
#65 Psi Blast: read slide.
Psi Blast starts with a single protein sequence, creates a profile from the results, and searches a database with this profile. Then it creates a new profile and runs another round. Until no more new sequences are found.
#67 A comparison of different methods for the detection of weak protein homologies.
Read slide.
The database used was Swissnew.
#68 BlastP finds four hemoglobins and one myoglobin.
#69 FatA also finds four hemoglobins and one myoglobin. The same ones as BlastP.
#70 SW finds 11 out from 14 globins.
But two of them are far down in the list.
#71 Psiblast finds five globins in the first round, and one more in the next round.
#72 ProfileSearch finds all 14 globins, but one is far down in the list.
#73 HMMerSearch finds all 14 and all in the top of the list.
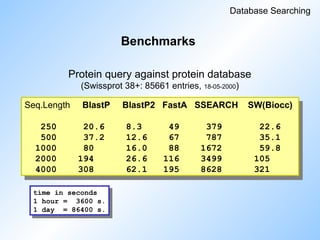
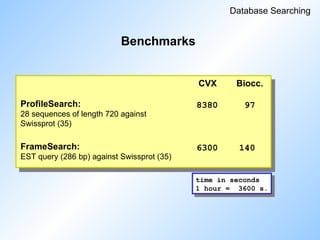
#74 Now some benchmarks for different programs.
'Protein to protein'.
Read slide.
Ssearch is the SW of the GCG package.
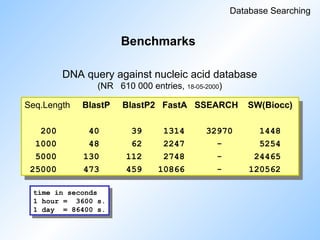
#75 Some more benchmarks.
'Nucleic acid to nucleic acid'.
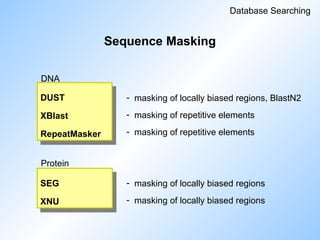
#77 Sequence masking is important for database searching in order to get rid of repeats and regions of low complexity that would otherwise cause loads of hits.
Blast uses DUST and SEG.
Read slide.
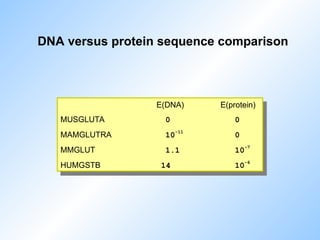
#81 Is it better to compare sequences on the DNA level or on the protein level?
Here are some E() values.
Conclusion is that comparing on the protein level is better.


![Example:
BlastN BlastN2 FastA SW
SW output
Sequence Searching
Query sequence: cDNA HUMAN Keratin against HONEST
Sequence Strd Orig ZScore EScore Len ! Documentation
emhum1:HSKERUV + 280.40 1079.43 0.000000e2147483647 956 ! X05803
Human radiated keratinocyte mRNA 266 (keratin-related protein). 7/95
emhum1:HSKERELP + 280.40 1076.40 0.000000e2147483647 1512 ! X62571
H.sapiens mRNA for keratin-related protein. 11/92
em_ro:MMKTEPIA + 278.80 1071.56 0.000000e2147483647 1224 ! M13806
Mouse keratin (epidermal) type I mRNA, clone p52, partial 4/90
em_ro:MMKTEPIC + 265.20 1021.34 0.000000e2147483647 801 ! M13805
Mouse type I epidermal keratin mRNA, clone pkSCC-50, partial cds.4/90
emhum2:S79867 + 248.40 952.05 0.000000e2147483647 1422 ! S79867
type I keratin 16 [epidermal keratinocytes, mRNA Partial, 1422 nt]. 2
emhum2:S72493 + 245.80 944.40 0.000000e2147483647 976 ! S72493
keratin [human, tracheobronchial epithelial cells, mRNA P
emhum1:HSCHIKER + 223.00 840.34 0.000000e2147483647 9697 ! M37818
Human keratin (psi-K-alpha) pseudogene, exons 4,5,6,7,8,
SW detects only the longest exon!](https://image.slidesharecdn.com/dbsearchtdr20041-250905071604-1c564a51/85/Introduction_to_Bioinformatics_Database_Search-ppt-50-320.jpg)