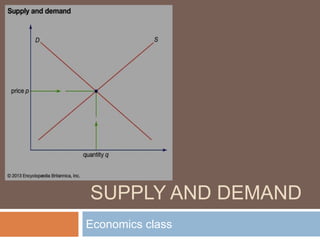
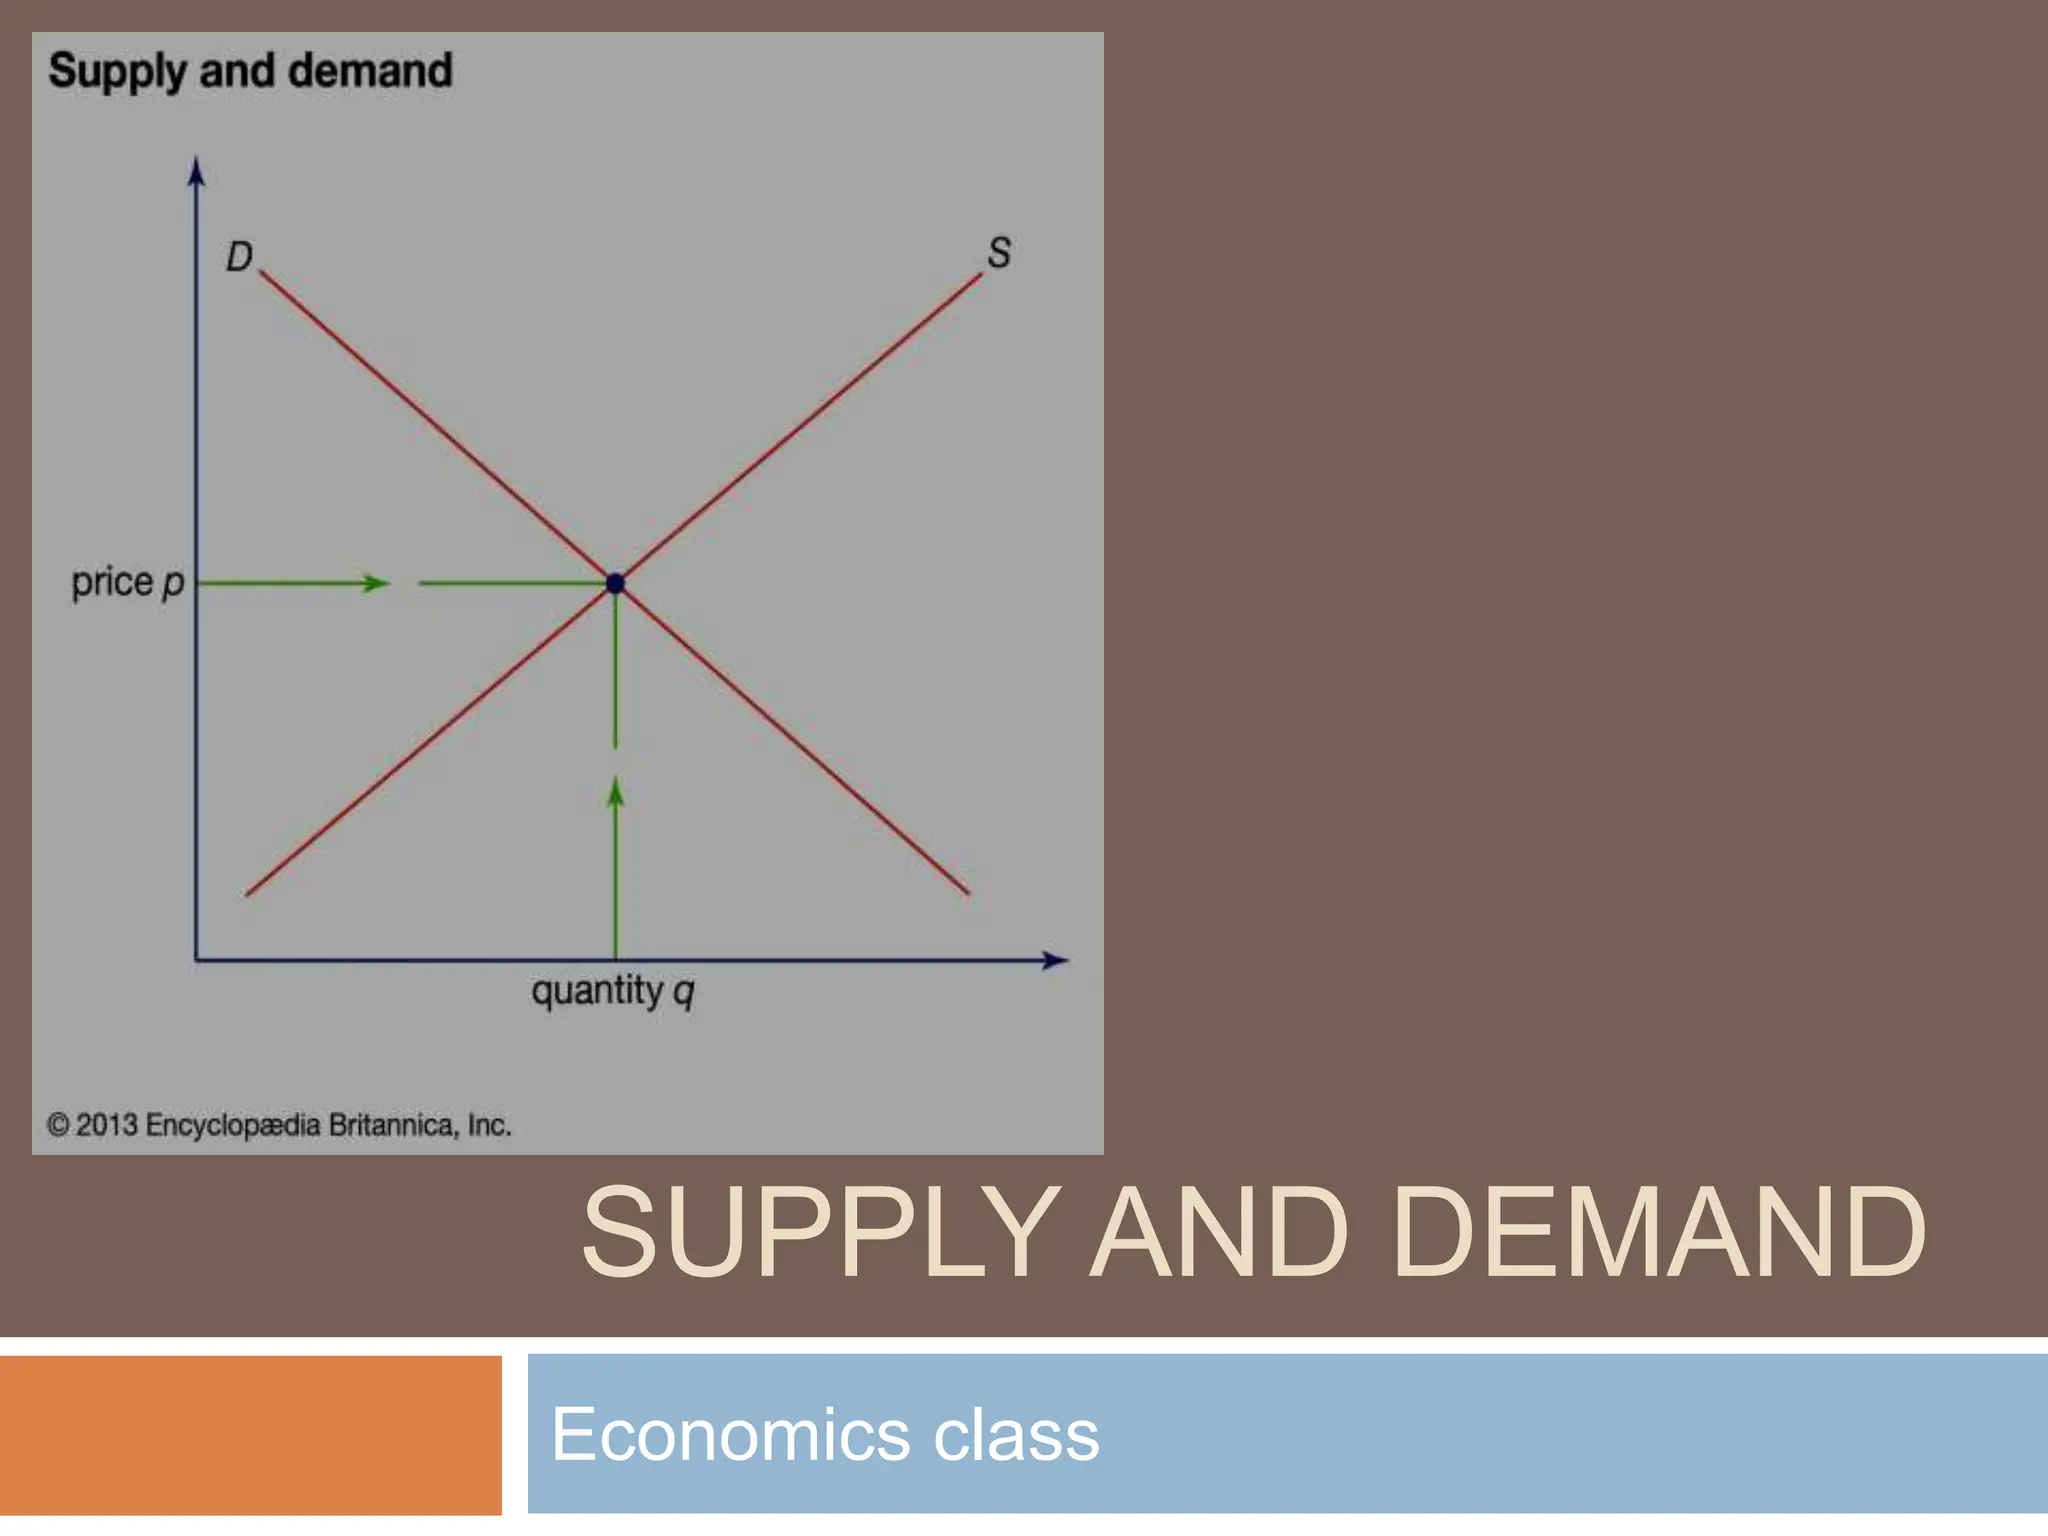
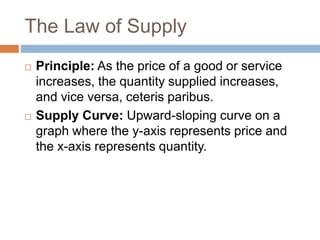
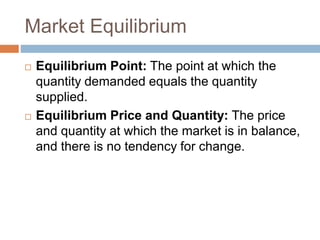
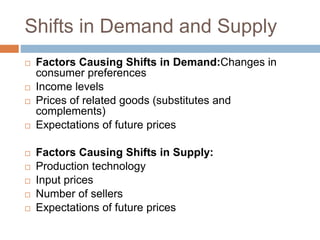
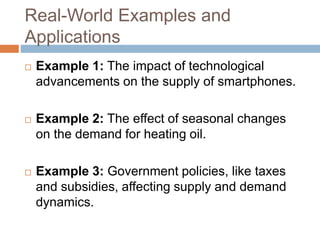
SUPPLY AND DEMAND
Economics class
Introduction to Supply and
Demand
Understanding Supply and Demand in
Economics
 Definition of Supply and Demand:
 Supply: The quantity of a good or service that
producers are willing and able to sell at various
prices over a period of time.
 Demand: The quantity of a good or service that
consumers are willing and able to purchase at
various prices over a period of time.
The Law of Demand
 Principle: As the price of a good or service
decreases, the quantity demanded increases,
and vice versa, ceteris paribus (all else being
equal).
 Demand Curve: Downward-sloping curve on
a graph where the y-axis represents price and
the x-axis represents quantity.
The Law of Supply
 Principle: As the price of a good or service
increases, the quantity supplied increases,
and vice versa, ceteris paribus.
 Supply Curve: Upward-sloping curve on a
graph where the y-axis represents price and
the x-axis represents quantity.
Market Equilibrium
 Equilibrium Point: The point at which the
quantity demanded equals the quantity
supplied.
 Equilibrium Price and Quantity: The price
and quantity at which the market is in balance,
and there is no tendency for change.
Shifts in Demand and Supply
 Factors Causing Shifts in Demand:Changes in
consumer preferences
 Income levels
 Prices of related goods (substitutes and
complements)
 Expectations of future prices
 Factors Causing Shifts in Supply:
 Production technology
 Input prices
 Number of sellers
 Expectations of future prices
Real-World Examples and
Applications
 Example 1: The impact of technological
advancements on the supply of smartphones.
 Example 2: The effect of seasonal changes
on the demand for heating oil.
 Example 3: Government policies, like taxes
and subsidies, affecting supply and demand
dynamics.

Introduction to Supply and Demand...pptx

  • 1.
  • 2.
    Introduction to Supplyand Demand Understanding Supply and Demand in Economics  Definition of Supply and Demand:  Supply: The quantity of a good or service that producers are willing and able to sell at various prices over a period of time.  Demand: The quantity of a good or service that consumers are willing and able to purchase at various prices over a period of time.
  • 3.
    The Law ofDemand  Principle: As the price of a good or service decreases, the quantity demanded increases, and vice versa, ceteris paribus (all else being equal).  Demand Curve: Downward-sloping curve on a graph where the y-axis represents price and the x-axis represents quantity.
  • 4.
    The Law ofSupply  Principle: As the price of a good or service increases, the quantity supplied increases, and vice versa, ceteris paribus.  Supply Curve: Upward-sloping curve on a graph where the y-axis represents price and the x-axis represents quantity.
  • 5.
    Market Equilibrium  EquilibriumPoint: The point at which the quantity demanded equals the quantity supplied.  Equilibrium Price and Quantity: The price and quantity at which the market is in balance, and there is no tendency for change.
  • 6.
    Shifts in Demandand Supply  Factors Causing Shifts in Demand:Changes in consumer preferences  Income levels  Prices of related goods (substitutes and complements)  Expectations of future prices  Factors Causing Shifts in Supply:  Production technology  Input prices  Number of sellers  Expectations of future prices
  • 7.
    Real-World Examples and Applications Example 1: The impact of technological advancements on the supply of smartphones.  Example 2: The effect of seasonal changes on the demand for heating oil.  Example 3: Government policies, like taxes and subsidies, affecting supply and demand dynamics.