1
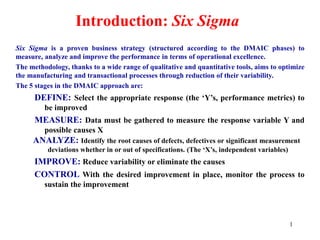
Introduction: Six Sigma
SixSigma is a proven business strategy (structured according to the DMAIC phases) to
measure, analyze and improve the performance in terms of operational excellence.
The methodology, thanks to a wide range of qualitative and quantitative tools, aims to optimize
the manufacturing and transactional processes through reduction of their variability.
The 5 stages in the DMAIC approach are:
DEFINE: Select the appropriate response (the ‘Y’s, performance metrics) to
be improved
MEASURE: Data must be gathered to measure the response variable Y and
possible causes X
ANALYZE: Identify the root causes of defects, defectives or significant measurement
deviations whether in or out of specifications. (The ‘X’s, independent variables)
IMPROVE: Reduce variability or eliminate the causes
CONTROL With the desired improvement in place, monitor the process to
sustain the improvement
2.
2
)
X
,...,
X
,
X
,
X
(
f
=
Y k
3
2
1
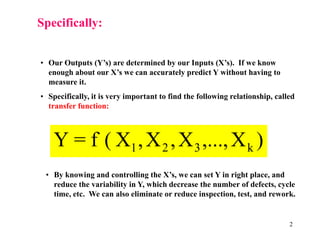
• OurOutputs (Y’s) are determined by our Inputs (X’s). If we know
enough about our X’s we can accurately predict Y without having to
measure it.
• Specifically, it is very important to find the following relationship, called
transfer function:
• By knowing and controlling the X’s, we can set Y in right place, and
reduce the variability in Y, which decrease the number of defects, cycle
time, etc. We can also eliminate or reduce inspection, test, and rework.
Specifically:
3.
3
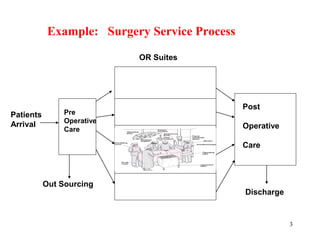
Example: Surgery ServiceProcess
Patients
Arrival
Pre
Operative
Care
OR Suites
Post
Operative
Care
Out Sourcing
Discharge
4.
4
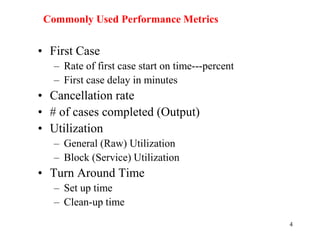
Most Often UsedMetrics
• First Case
– Rate of first case start on time---percent
– First case delay in minutes
• Cancellation rate
• # of cases completed (Output)
• Utilization
– General (Raw) Utilization
– Block (Service) Utilization
• Turn Around Time
– Set up time
– Clean-up time
Commonly Used Performance Metrics
5.
5
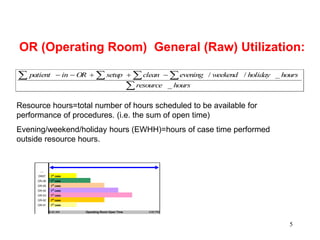
OR (Raw) Utilization
OR(Operating Room) General (Raw) Utilization:
…
OR07 1
st
case
OR-06 1
st
case
OR-05 1
st
case
OR-04 1
st
case
OR-03 1
st
case
OR-02 1
st
case
OR-01 1st
case
8:00 AM 4:00 PM
Operating Room Open Time
Resource hours=total number of hours scheduled to be available for
performance of procedures. (i.e. the sum of open time)
Evening/weekend/holiday hours (EWHH)=hours of case time performed
outside resource hours.
∑
∑
∑ ∑ ∑ −
+
+
−
−
hours
resource
hours
holiday
weekend
evening
clean
setup
OR
in
patient
_
_
/
/
6.
6
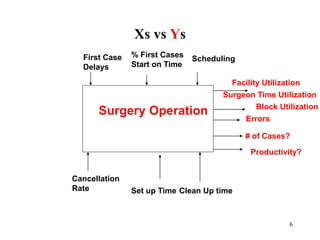
Xs vs Ys
SurgeryOperation
Facility Utilization
Surgeon Time Utilization
Errors
First Case
Delays
Productivity?
Set up Time Clean Up time
Cancellation
Rate
% First Cases
Start on Time
# of Cases?
Block Utilization
Scheduling
7.
7
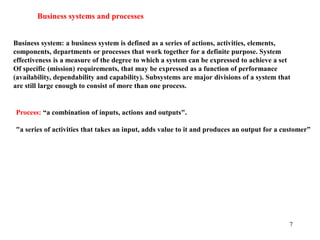
Business systems andprocesses
Business system: a business system is defined as a series of actions, activities, elements,
components, departments or processes that work together for a definite purpose. System
effectiveness is a measure of the degree to which a system can be expressed to achieve a set
Of specific (mission) requirements, that may be expressed as a function of performance
(availability, dependability and capability). Subsystems are major divisions of a system that
are still large enough to consist of more than one process.
Process: “a combination of inputs, actions and outputs".
"a series of activities that takes an input, adds value to it and produces an output for a customer”
9
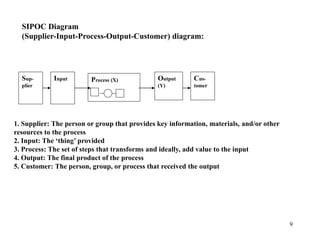
SIPOC Diagram
(Supplier-Input-Process-Output-Customer) diagram:
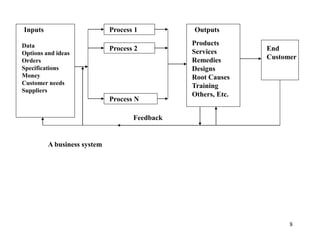
Process(X) Output
(Y)
Input Cus-
tomer
Sup-
plier
1. Supplier: The person or group that provides key information, materials, and/or other
resources to the process
2. Input: The ‘thing’ provided
3. Process: The set of steps that transforms and ideally, add value to the input
4. Output: The final product of the process
5. Customer: The person, group, or process that received the output
10.
10
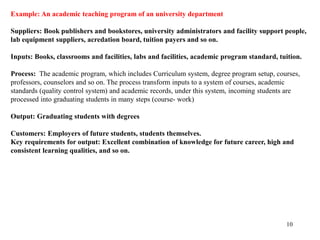
Example: An academicteaching program of an university department
Suppliers: Book publishers and bookstores, university administrators and facility support people,
lab equipment suppliers, acredation board, tuition payers and so on.
Inputs: Books, classrooms and facilities, labs and facilities, academic program standard, tuition.
Process: The academic program, which includes Curriculum system, degree program setup, courses,
professors, counselors and so on. The process transform inputs to a system of courses, academic
standards (quality control system) and academic records, under this system, incoming students are
processed into graduating students in many steps (course- work)
Output: Graduating students with degrees
Customers: Employers of future students, students themselves.
Key requirements for output: Excellent combination of knowledge for future career, high and
consistent learning qualities, and so on.
11.
11
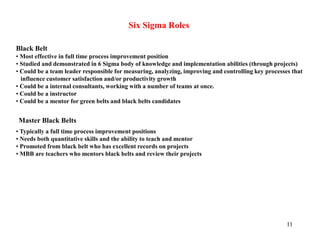
Six Sigma Roles
BlackBelt
• Most effective in full time process improvement position
• Studied and demonstrated in 6 Sigma body of knowledge and implementation abilities (through projects)
• Could be a team leader responsible for measuring, analyzing, improving and controlling key processes that
influence customer satisfaction and/or productivity growth
• Could be a internal consultants, working with a number of teams at once.
• Could be a instructor
• Could be a mentor for green belts and black belts candidates
Master Black Belts
• Typically a full time process improvement positions
• Needs both quantitative skills and the ability to teach and mentor
• Promoted from black belt who has excellent records on projects
• MBB are teachers who mentors black belts and review their projects
12.
12
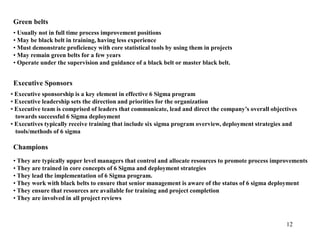
Green belts
• Usuallynot in full time process improvement positions
• May be black belt in training, having less experience
• Must demonstrate proficiency with core statistical tools by using them in projects
• May remain green belts for a few years
• Operate under the supervision and guidance of a black belt or master black belt.
Executive Sponsors
• Executive sponsorship is a key element in effective 6 Sigma program
• Executive leadership sets the direction and priorities for the organization
• Executive team is comprised of leaders that communicate, lead and direct the company’s overall objectives
towards successful 6 Sigma deployment
• Executives typically receive training that include six sigma program overview, deployment strategies and
tools/methods of 6 sigma
Champions
• They are typically upper level managers that control and allocate resources to promote process improvements
• They are trained in core concepts of 6 Sigma and deployment strategies
• They lead the implementation of 6 Sigma program.
• They work with black belts to ensure that senior management is aware of the status of 6 sigma deployment
• They ensure that resources are available for training and project completion
• They are involved in all project reviews
13.
13
Process Owners
• Keyprocesses should have a process owner
• A process owner coordinates process improvement activities and monitors progress on a regular basis
• Process owners work with black belts to improve the processes for which they are responsible
• Process owners should have basic training in core statistical tools
• In some organizations, process owners may be Six Sigma Champions
14.
14
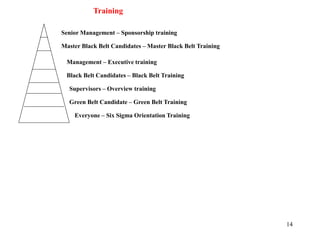
Training
Senior Management –Sponsorship training
Master Black Belt Candidates – Master Black Belt Training
Management – Executive training
Black Belt Candidates – Black Belt Training
Supervisors – Overview training
Green Belt Candidate – Green Belt Training
Everyone – Six Sigma Orientation Training
15.
15
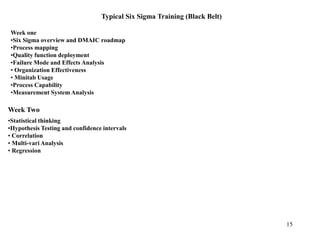
Typical Six SigmaTraining (Black Belt)
Week one
•Six Sigma overview and DMAIC roadmap
•Process mapping
•Quality function deployment
•Failure Mode and Effects Analysis
• Organization Effectiveness
• Minitab Usage
•Process Capability
•Measurement System Analysis
Week Two
•Statistical thinking
•Hypothesis Testing and confidence intervals
• Correlation
• Multi-vari Analysis
• Regression
16.
16
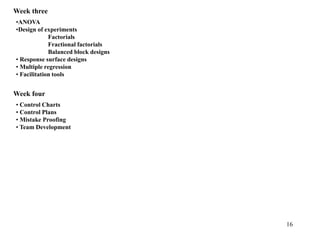
Week three
•ANOVA
•Design ofexperiments
Factorials
Fractional factorials
Balanced block designs
• Response surface designs
• Multiple regression
• Facilitation tools
Week four
• Control Charts
• Control Plans
• Mistake Proofing
• Team Development
17.
17
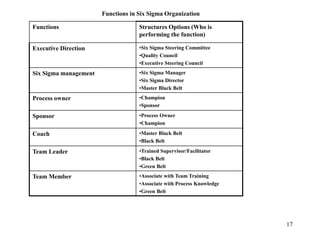
Functions in SixSigma Organization
Functions Structures Options (Who is
performing the function)
Executive Direction •Six Sigma Steering Committee
•Quality Council
•Executive Steering Council
Six Sigma management •Six Sigma Manager
•Six Sigma Director
•Master Black Belt
Process owner •Champion
•Sponsor
Sponsor •Process Owner
•Champion
Coach •Master Black Belt
•Black Belt
Team Leader •Trained Supervisor/Facilitator
•Black Belt
•Green Belt
Team Member •Associate with Team Training
•Associate with Process Knowledge
•Green Belt
18.
18
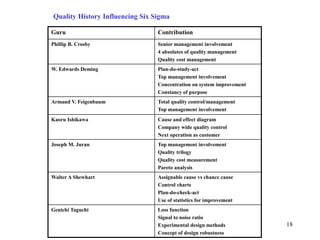
Quality History InfluencingSix Sigma
Guru Contribution
Phillip B. Crosby Senior management involvement
4 absolutes of quality management
Quality cost management
W. Edwards Deming Plan-do-study-act
Top management involvement
Concentration on system improvement
Constancy of purpose
Armand V. Feigenbaum Total quality control/management
Top management involvement
Kaoru Ishikawa Cause and effect diagram
Company wide quality control
Next operation as customer
Joseph M. Juran Top management involvement
Quality trilogy
Quality cost measurement
Pareto analysis
Walter A Shewhart Assignable cause vs chance cause
Control charts
Plan-do-check-act
Use of statistics for improvement
Genichi Taguchi Loss function
Signal to noise ratio
Experimental design methods
Concept of design robustness
19.
19
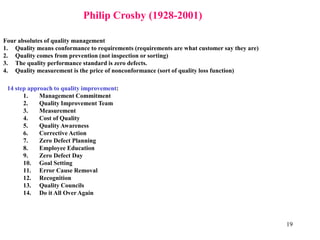
Philip Crosby (1928-2001)
Fourabsolutes of quality management
1. Quality means conformance to requirements (requirements are what customer say they are)
2. Quality comes from prevention (not inspection or sorting)
3. The quality performance standard is zero defects.
4. Quality measurement is the price of nonconformance (sort of quality loss function)
14 step approach to quality improvement:
1. Management Commitment
2. Quality Improvement Team
3. Measurement
4. Cost of Quality
5. Quality Awareness
6. Corrective Action
7. Zero Defect Planning
8. Employee Education
9. Zero Defect Day
10. Goal Setting
11. Error Cause Removal
12. Recognition
13. Quality Councils
14. Do it All Over Again
20.
20
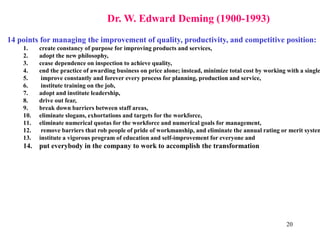
Dr. W. EdwardDeming (1900-1993)
14 points for managing the improvement of quality, productivity, and competitive position:
1. create constancy of purpose for improving products and services,
2. adopt the new philosophy,
3. cease dependence on inspection to achieve quality,
4. end the practice of awarding business on price alone; instead, minimize total cost by working with a single
5. improve constantly and forever every process for planning, production and service,
6. institute training on the job,
7. adopt and institute leadership,
8. drive out fear,
9. break down barriers between staff areas,
10. eliminate slogans, exhortations and targets for the workforce,
11. eliminate numerical quotas for the workforce and numerical goals for management,
12. remove barriers that rob people of pride of workmanship, and eliminate the annual rating or merit system
13. institute a vigorous program of education and self-improvement for everyone and
14. put everybody in the company to work to accomplish the transformation
21.
21
Seven Deadly Diseasesthat management Must cure
1. lack of constancy of purpose to plan a marketable product and service to keep the company in business
and provide jobs
2. Emphasis on short term profit
3. Personal evaluation appraisal
4. Mobility of management: job hopping
5. Use of visible figures for management
6. Excessive medical costs
7. Excessive costs of warranty, fueled by lawyers that work on contingency fees
22.
22
Dr. Kaoru Ishikawa(1915-1989)
11 points:
• Quality begins with education and ends with education.
• The first step in quality is to know the requirements of the customer.
• The ideal state of quality control is when quality inspection is no longer necessary.
• Remove the root cause, not symptoms.
• Quality control is the responsibility of all workers and all divisions.
• Do not confuse means with objectives.
• Put quality first and set your sights on long-term objectives.
• Marketing is the entrance and exit of quality.
• Top management must not show anger when facts are presented to subordinates.
• Ninety-five percent of the problem in a company can be solved by seven tools of
quality.
• Data without dispersion information are false data.
Seven tools of quality:
Tools that help organizations understand their processes
to improve them. The tools are:
1. the cause and effect diagram,
2. check sheet, 3. control chart, 4. flowchart, 5. histogram, 6. Pareto chart , 7. scatter diagram
23.
23
Dr. Joseph Juran(1904-)
Juran Trilogy
• Quality planning
• Quality control
• Quality improvement
Juran’s basics for success
• Top management must commit the time and resource for success
• Specific quality improvement goals must be in the business plan and include:
• The means to measure quality results against goals
• A review of results against goals
• A reward for superior quality performance
•The responsibility for improvement must be assigned to individuals
• People must be trained for quality management and improvement
• The workforce must be empowered to participate in the improvement process
24.
24
Dr. Genichi Taguchi
1.Evaluation of Quality : Quality Loss Function
2. Quality Through Design
System Design
Parameter Design
Tolerance Design
By using Quality Function Deployment (QFD), S/N ratio, Design of Experiment
3. Online Quality Control
25.
25
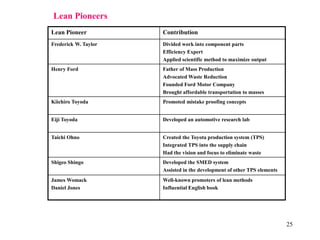
Lean Pioneers
Lean PioneerContribution
Frederick W. Taylor Divided work into component parts
Efficiency Expert
Applied scientific method to maximize output
Henry Ford Father of Mass Production
Advocated Waste Reduction
Founded Ford Motor Company
Brought affordable transportation to masses
Kiichiro Toyoda Promoted mistake proofing concepts
Eiji Toyoda Developed an automotive research lab
Taichi Ohno Created the Toyota production system (TPS)
Integrated TPS into the supply chain
Had the vision and focus to eliminate waste
Shigeo Shingo Developed the SMED system
Assisted in the development of other TPS elements
James Womack
Daniel Jones
Well-known promoters of lean methods
Influential English book
26.
26
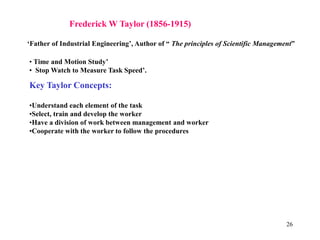
Frederick W Taylor(1856-1915)
‘Father of Industrial Engineering’, Author of “ The principles of Scientific Management”
• Time and Motion Study’
• Stop Watch to Measure Task Speed’.
Key Taylor Concepts:
•Understand each element of the task
•Select, train and develop the worker
•Have a division of work between management and worker
•Cooperate with the worker to follow the procedures
27.
27
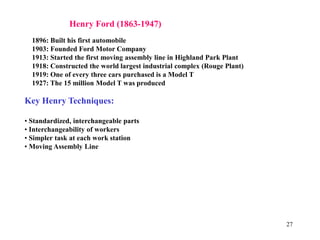
Henry Ford (1863-1947)
KeyHenry Techniques:
• Standardized, interchangeable parts
• Interchangeability of workers
• Simpler task at each work station
• Moving Assembly Line
1896: Built his first automobile
1903: Founded Ford Motor Company
1913: Started the first moving assembly line in Highland Park Plant
1918: Constructed the world largest industrial complex (Rouge Plant)
1919: One of every three cars purchased is a Model T
1927: The 15 million Model T was produced
28.
28
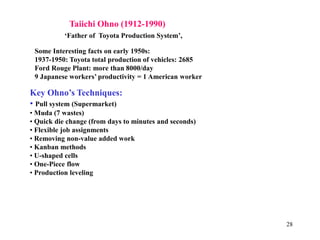
Taiichi Ohno (1912-1990)
‘Fatherof Toyota Production System’,
Key Ohno’s Techniques:
• Pull system (Supermarket)
• Muda (7 wastes)
• Quick die change (from days to minutes and seconds)
• Flexible job assignments
• Removing non-value added work
• Kanban methods
• U-shaped cells
• One-Piece flow
• Production leveling
Some Interesting facts on early 1950s:
1937-1950: Toyota total production of vehicles: 2685
Ford Rouge Plant: more than 8000/day
9 Japanese workers’ productivity = 1 American worker
29.
29
Shigeo Shingo (1909- 1990)
Key Books:
• Revolution in Manufacturing: The SMED System
• Zero Quality Control: Source Inspection and Poka-Yoke System
• Non-stock Production
• The Toyota Production System from an Industrial Engineering Viewpoint
James Womack and Daniel Jones
Key Books:
•The Machine that changed the world
•Lean Thinking
30.
30
Introduction: Lean methodology
Leanmethodology aims to relentlessly identify and eliminate waste in order to maximize speed
and flexibility of business processes in order to deliver what is needed, when needed and the
quantity needed by the Customer.
Terms like "Lean Manufacturing" or "Lean Production" are deliberately not used, as the Lean
method can be widely used in a variety of processes such as production processes and
transactional processes, for example:
• Lean Production or Manufacturing for production processes
• Lean Office for service/support processes
• Lean Design inside the Research & Development process
31.
31
Introduction to “Waste”
Whatis the meaning of "waste"?
It is the use of resources (time, material, labor, etc.). for doing something that customers are
not willing to pay for, and so it does not add value to the product or service provided.
Eliminating waste improves the value of products and services.
The Lean “philosophy” highlights 8 macro-categories of waste:
• Over-production
• Transportation
• Defects
• Inventory
• Waiting
• Over-processing
• Motion
• Underutilized people
32.
32
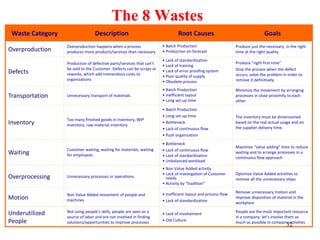
The 8 Wastes
WasteCategory Description Root Causes Goals
Overproduction
Overproduction happens when a process
produces more products/services than necessary
• Batch Production
• Production on forecast
Produce just the necessary, in the right
time at the right quality
Defects
Production of defective parts/services that can’t
be sold to the Customer. Defects can be scraps or
reworks, which add tremendous costs to
organizations
• Lack of standardization
• Lack of training
• Lack of error proofing system
• Poor quality of supply
• Obsolete process
Produce “right first time”
Stop the process when the defect
occurs, solve the problem in order to
remove it definitively
Transportation Unnecessary transport of materials
• Batch Production
• Inefficient layout
• Long set-up time
Minimize the movement by arranging
processes in close proximity to each
other.
Inventory
Too many finished goods in inventory, WIP
inventory, raw material inventory
• Batch Production
• Long set-up time
• Bottleneck
• Lack of continuous flow
• Push organization
The inventory must be dimensioned
based on the real actual usage and on
the supplier delivery time.
Waiting
Customer waiting, waiting for materials, waiting
for employees
• Bottleneck
• Lack of continuous flow
• Lack of standardization
• Unbalanced workload
Maximise "value adding" time to reduce
waiting and to arrange processes in a
continuous flow approach
Overprocessing Unnecessary processes or operations
• Non Value Added activity
• Lack of investigation of Customer
needs
• Activity by “tradition”
Optimize Value Added activities to
remove all the unnecessary steps
Motion
Non Value Added movement of people and
machines
• Inefficient layout and process flow
• Lack of standardization
Remove unnecessary motion and
improve disposition of material in the
workplace
Underutilized
People
Not using people’s skills, people are seen as a
source of labor and are not involved in finding
solutions/opportunities to improve processes
• Lack of involvement
• Old Culture
People are the most important resource
in a company: let’s involve them as
much as possible in company activities
33.
33
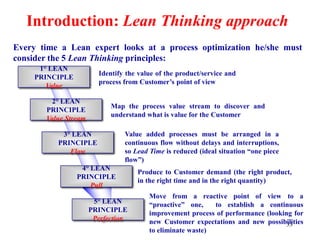
Introduction: Lean Thinkingapproach
1° LEAN
PRINCIPLE
Value
Identify the value of the product/service and
process from Customer’s point of view
2° LEAN
PRINCIPLE
Value Stream
Map the process value stream to discover and
understand what is value for the Customer
3° LEAN
PRINCIPLE
Flow
Value added processes must be arranged in a
continuous flow without delays and interruptions,
so Lead Time is reduced (ideal situation “one piece
flow”)
4° LEAN
PRINCIPLE
Pull
Produce to Customer demand (the right product,
in the right time and in the right quantity)
5° LEAN
PRINCIPLE
Perfection
Move from a reactive point of view to a
“proactive” one, to establish a continuous
improvement process of performance (looking for
new Customer expectations and new possibilities
to eliminate waste)
Every time a Lean expert looks at a process optimization he/she must
consider the 5 Lean Thinking principles:
34.
34
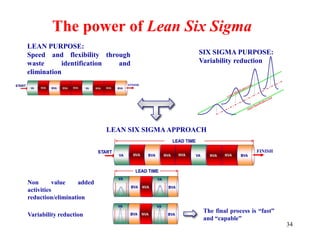
The power ofLean Six Sigma
LEAN PURPOSE:
Speed and flexibility through
waste identification and
elimination
LEAN SIX SIGMA APPROACH
SIX SIGMA PURPOSE:
Variability reduction
Non value added
activities
reduction/elimination
Variability reduction
The final process is “fast”
and “capable”
FINISH
FINISH
35.
35
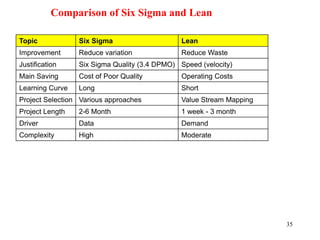
Comparison of SixSigma and Lean
Topic Six Sigma Lean
Improvement Reduce variation Reduce Waste
Justification Six Sigma Quality (3.4 DPMO) Speed (velocity)
Main Saving Cost of Poor Quality Operating Costs
Learning Curve Long Short
Project Selection Various approaches Value Stream Mapping
Project Length 2-6 Month 1 week - 3 month
Driver Data Demand
Complexity High Moderate
36.
36
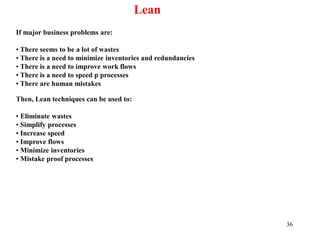
Lean
If major businessproblems are:
• There seems to be a lot of wastes
• There is a need to minimize inventories and redundancies
• There is a need to improve work flows
• There is a need to speed p processes
• There are human mistakes
Then, Lean techniques can be used to:
• Eliminate wastes
• Simplify processes
• Increase speed
• Improve flows
• Minimize inventories
• Mistake proof processes
37.
37
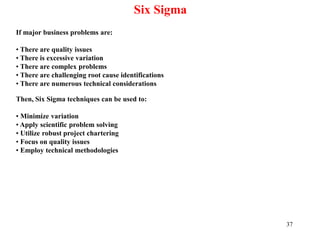
Six Sigma
If majorbusiness problems are:
• There are quality issues
• There is excessive variation
• There are complex problems
• There are challenging root cause identifications
• There are numerous technical considerations
Then, Six Sigma techniques can be used to:
• Minimize variation
• Apply scientific problem solving
• Utilize robust project chartering
• Focus on quality issues
• Employ technical methodologies
38.
38
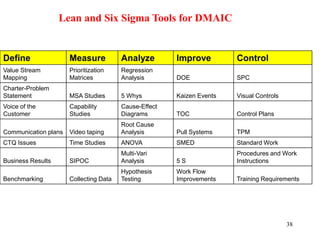
Lean and SixSigma Tools for DMAIC
Define Measure Analyze Improve Control
Value Stream
Mapping
Prioritization
Matrices
Regression
Analysis DOE SPC
Charter-Problem
Statement MSA Studies 5 Whys Kaizen Events Visual Controls
Voice of the
Customer
Capability
Studies
Cause-Effect
Diagrams TOC Control Plans
Communication plans Video taping
Root Cause
Analysis Pull Systems TPM
CTQ Issues Time Studies ANOVA SMED Standard Work
Business Results SIPOC
Multi-Vari
Analysis 5 S
Procedures and Work
Instructions
Benchmarking Collecting Data
Hypothesis
Testing
Work Flow
Improvements Training Requirements
39.
39
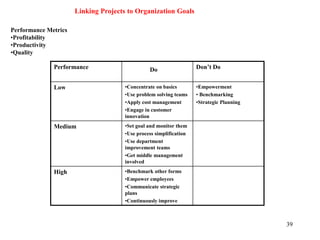
Linking Projects toOrganization Goals
Performance Metrics
•Profitability
•Productivity
•Quality
Performance Don’t Do
Low •Concentrate on basics
•Use problem solving teams
•Apply cost management
•Engage in customer
innovation
•Empowerment
• Benchmarking
•Strategic Planning
Medium •Set goal and monitor them
•Use process simplification
•Use department
improvement teams
•Get middle management
involved
High •Benchmark other forms
•Empower employees
•Communicate strategic
plans
•Continuously improve
Do
40.
40
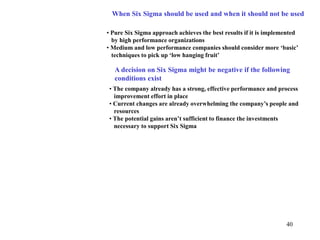
When Six Sigmashould be used and when it should not be used
• Pure Six Sigma approach achieves the best results if it is implemented
by high performance organizations
• Medium and low performance companies should consider more ‘basic’
techniques to pick up ‘low hanging fruit’
A decision on Six Sigma might be negative if the following
conditions exist
• The company already has a strong, effective performance and process
improvement effort in place
• Current changes are already overwhelming the company’s people and
resources
• The potential gains aren’t sufficient to finance the investments
necessary to support Six Sigma
41.
41
Six Sigma projectfocus areas
• Focus on project cost savings
•Focus on customer satisfaction deliverables
•Focus on processes
•Focus on problems
•Focus on a targeted locations (a good way to introduce Six Sigma)
• Focus on design
•Focus on supplier processes
42.
42
Risk Analysis
SWOT (Strength,Weakness, Opportunity, Threat) Analysis
• Basis for strategic planning
• Different SWOTs will come up with different strategies
• Copy other company’s success without analyzing SWOT of your
own company will likely lead to failure
• Strength: Something a company is good at, e.g., engineering expertise, skilled workforce,
solid financial position etc
• Weakness: Something that the firm lacks or is a condition that put it at a disadvantage, e.g.
poor cash flow, outdated technology, high overhead expenses etc
• Opportunity: Something external that the firm can take advantage of, e.g., overseas connection
•Threat: Something external that could harm the firm, e.g. law suits
43.
43
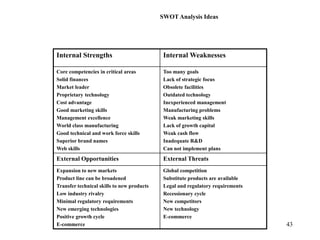
SWOT Analysis Ideas
InternalStrengths Internal Weaknesses
Core competencies in critical areas
Solid finances
Market leader
Proprietary technology
Cost advantage
Good marketing skills
Management excellence
World class manufacturing
Good technical and work force skills
Superior brand names
Web skills
Too many goals
Lack of strategic focus
Obsolete facilities
Outdated technology
Inexperienced management
Manufacturing problems
Weak marketing skills
Lack of growth capital
Weak cash flow
Inadequate R&D
Can not implement plans
External Opportunities External Threats
Expansion to new markets
Product line can be broadened
Transfer technical skills to new products
Low industry rivalry
Minimal regulatory requirements
New emerging technologies
Positive growth cycle
E-commerce
Global competition
Substitute products are available
Legal and regulatory requirements
Recessionary cycle
New competitors
New technology
E-commerce
44.
44
SWOT Analysis Deployment
•SWOT requires management to develop an objective view of firm
• However, top management tends to be consists of the same type of person, come up with
same kind of analysis and judgment and it is often not accurate or impartial
• It is recommended that different kind of people, such as new employee, low ranking employee
and outsiders, be brought into the analysis process