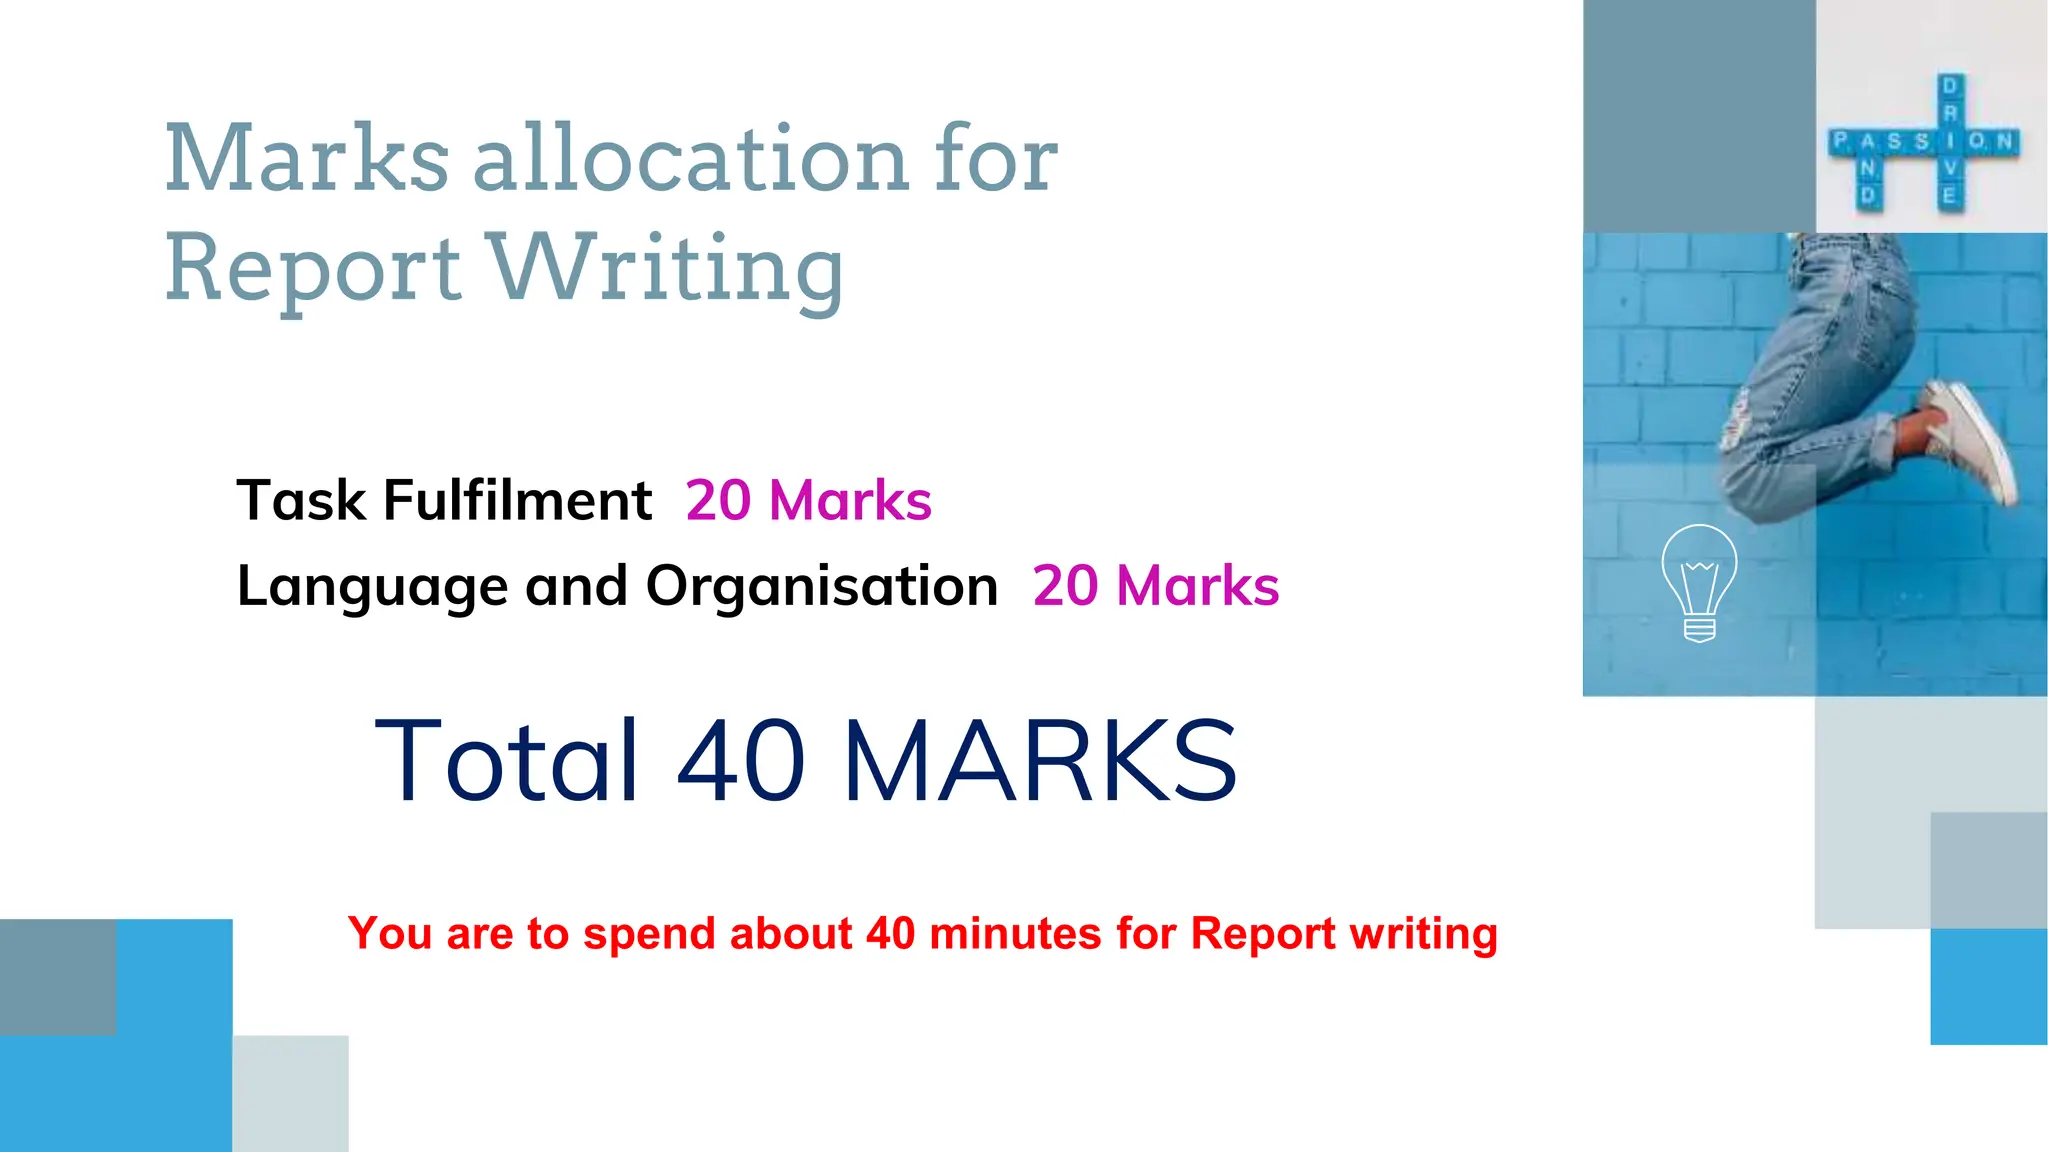
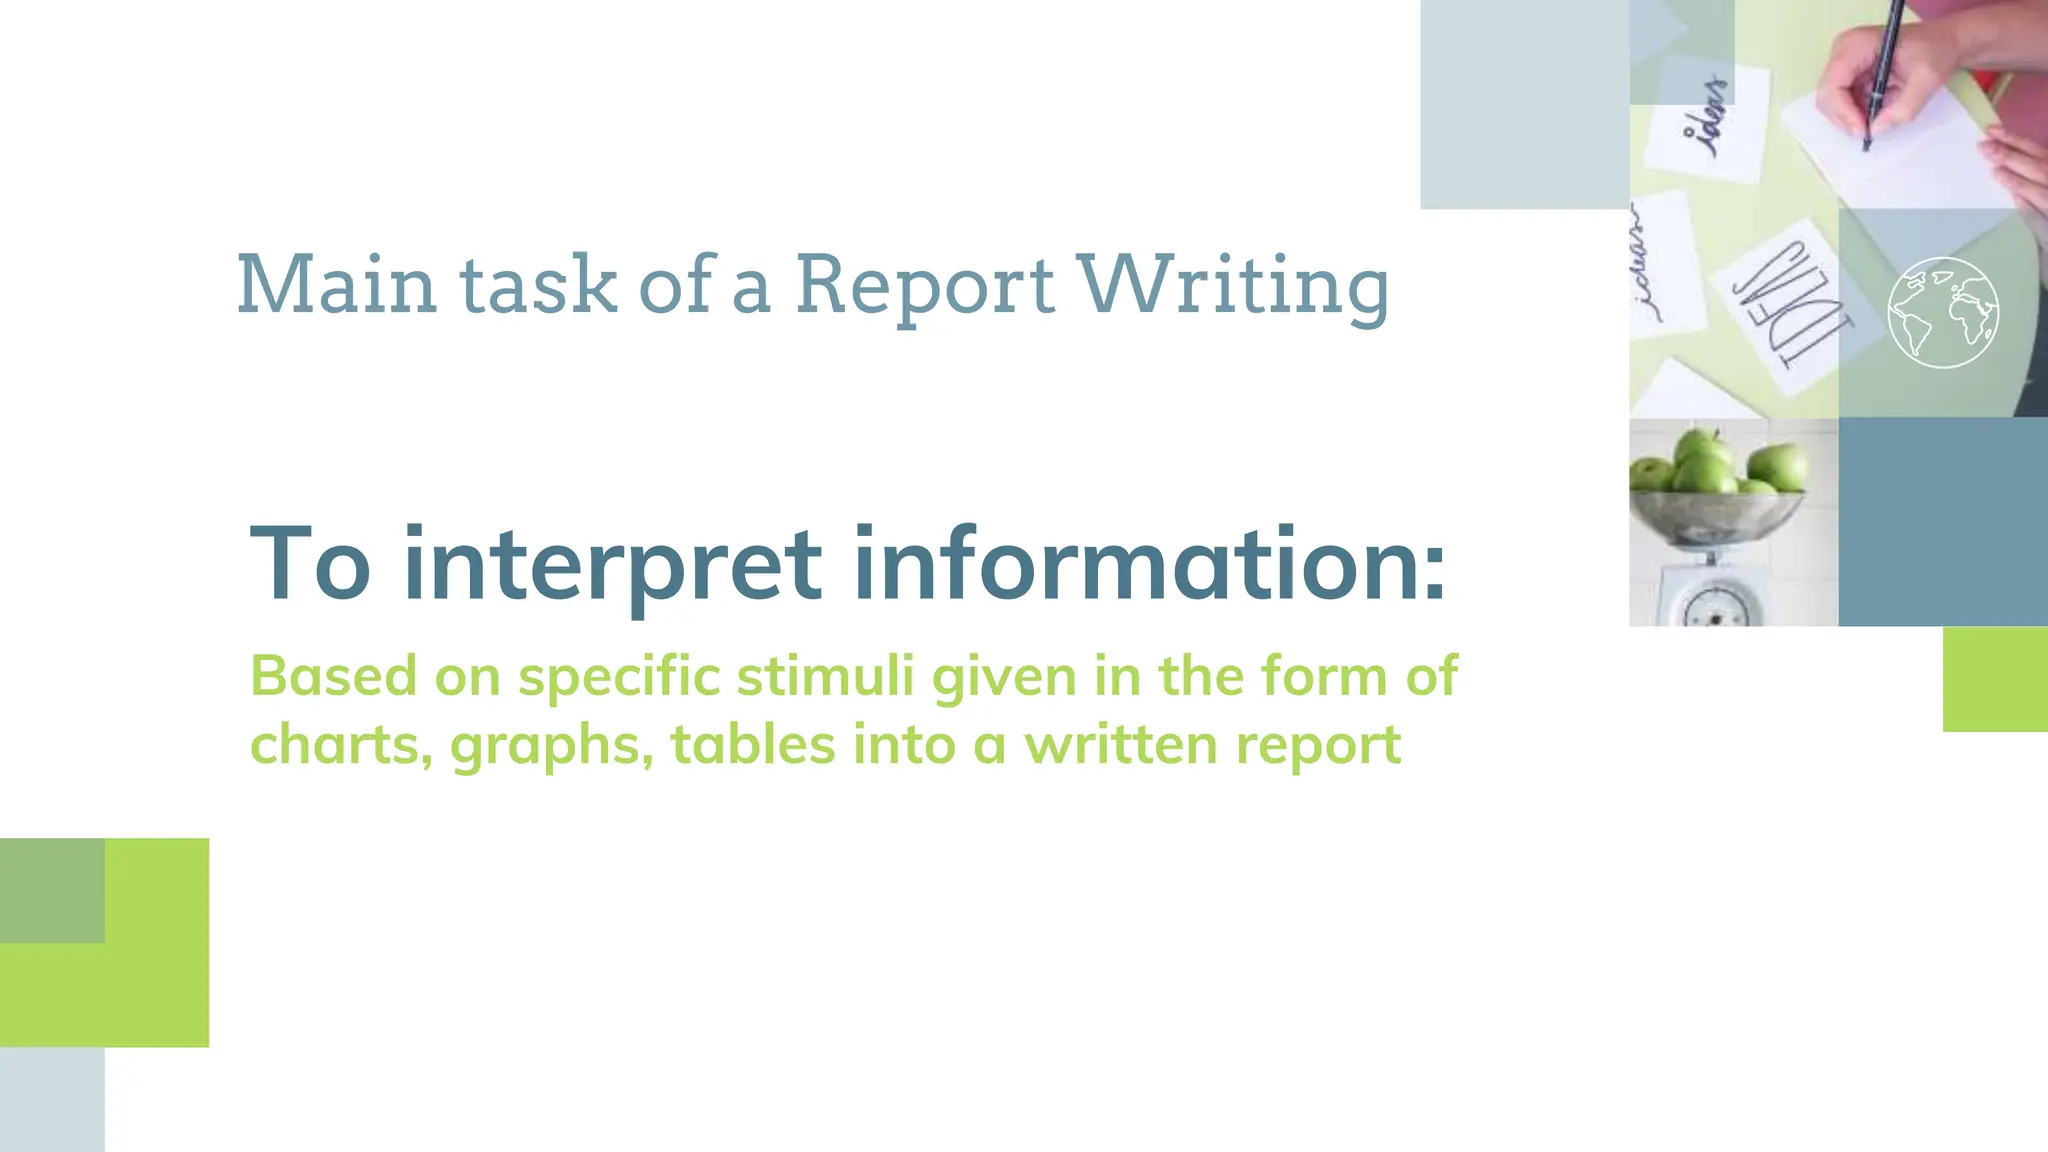
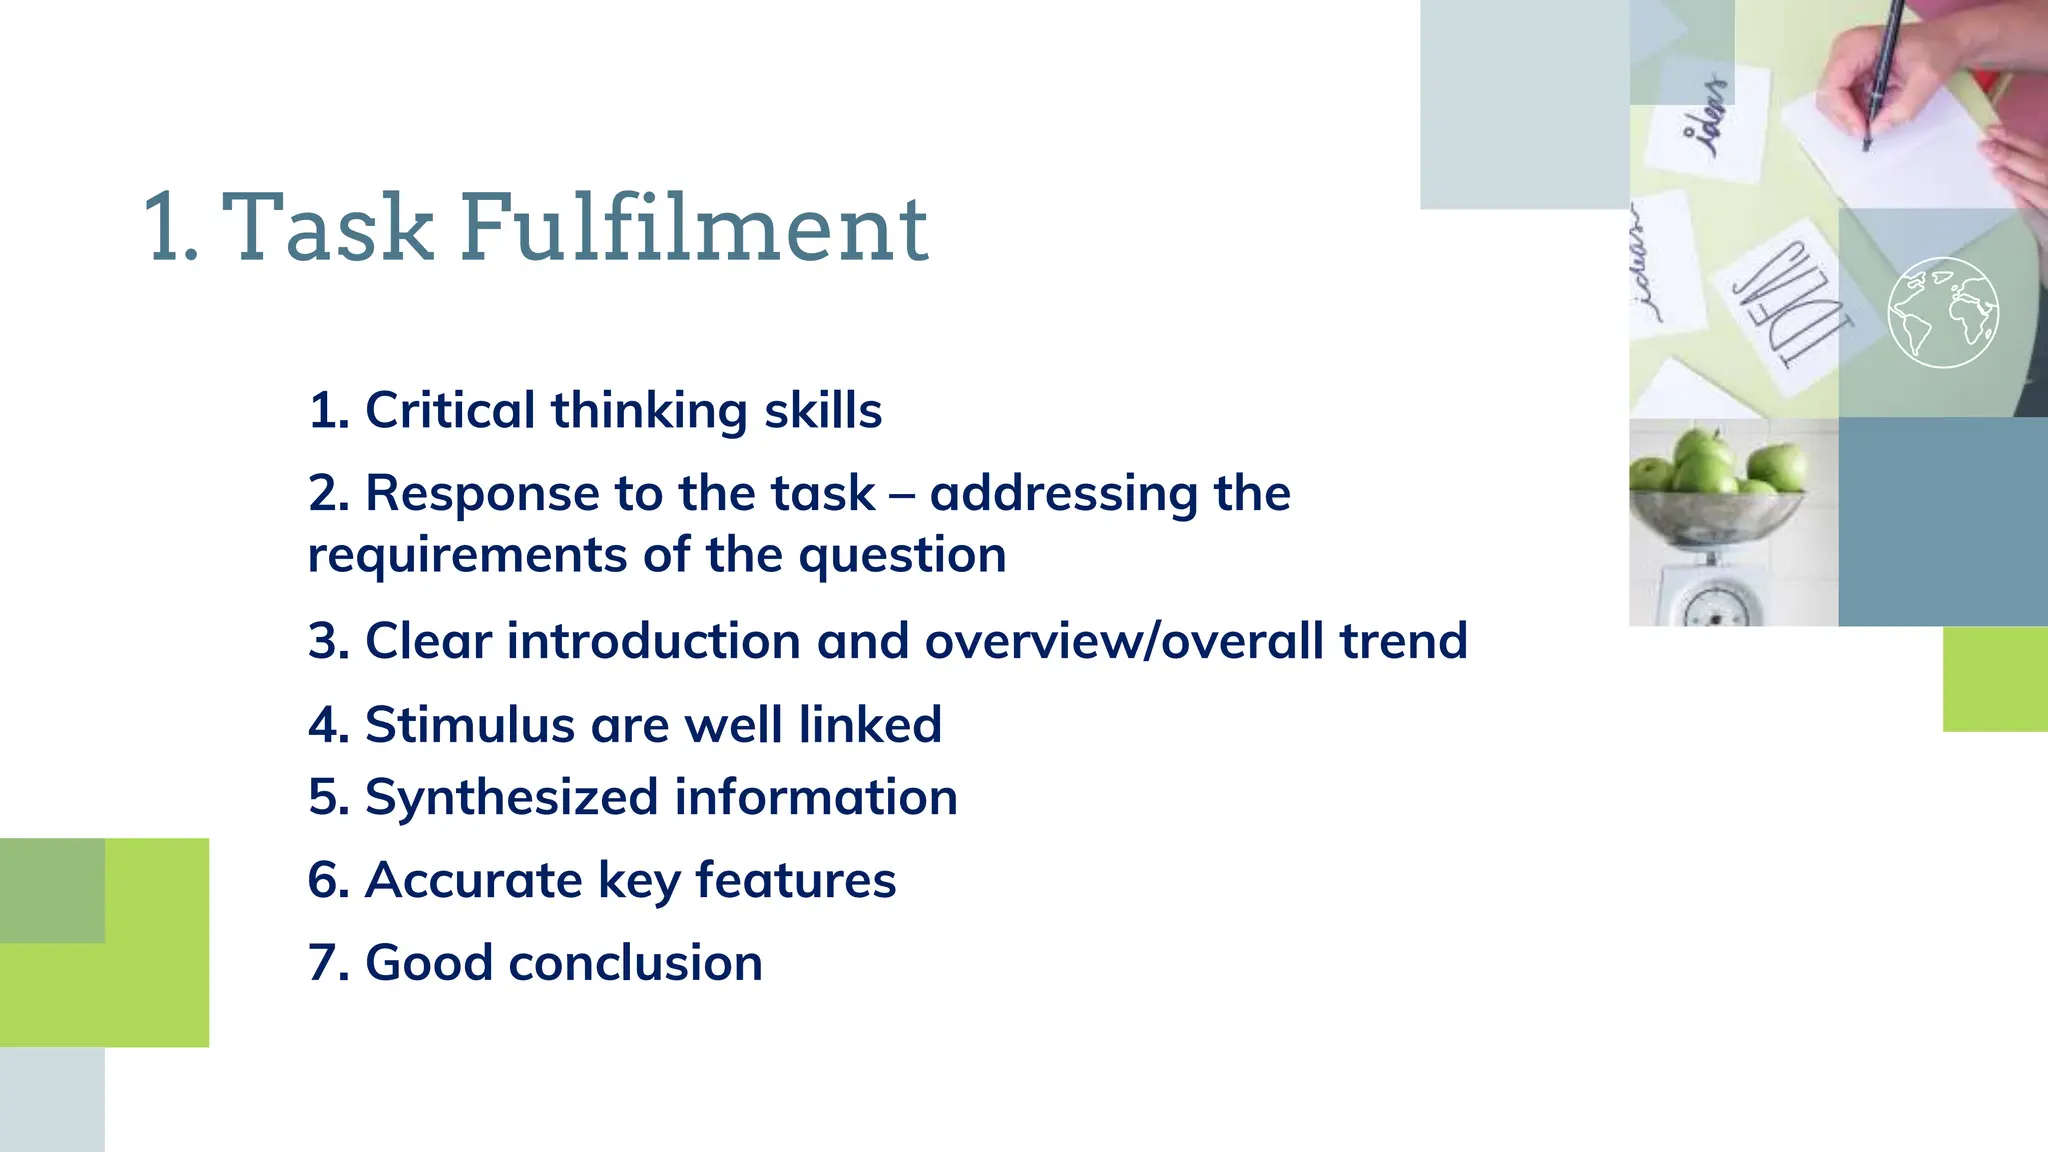
REPORT
WRITING
(FAX1003)
BEFORE WE BEGIN
LETS TAKE A LOOK AT THE TEST
FORMAT FOR REPORT WRITING
Marks allocation for
Report Writing
Task Fulfilment 20 Marks
Language and Organisation 20 Marks
Total 40 MARKS
You are to spend about 40 minutes for Report writing
Main task of a Report Writing
To interpret information:
Based on specific stimuli given in the form of
charts, graphs, tables into a written report
What are the criteria
assessed?
1. Task Fulfilment
2. Language and Organisation
1. Task Fulfilment
4. Stimulus are well linked
2. Response to the task – addressing the
requirements of the question
1. Critical thinking skills
6. Accurate key features
3. Clear introduction and overview/overall trend
5. Synthesized information
7. Good conclusion
2. Language & Organisation
1. Grammar accuracy
2. Varied and suitable use of vocabulary
3. Relevant phrases
4. Good flow of the report format
5. Writing within the word count
Layout of the Report
1.TITLE
2.INTRODUCTION
3.OVERVIEW / GENERAL TREND
4.KEY FEATURES (ANALYSIS & SYNTHESIS)
5.Conclusion
.
Only 3 or 4 paragraphs for Report
writing.
Your report must be at least 150 to 200
words (maximum) only (excluding the
title). Any words beyond the word
count limit will not be included in the
marks.
You must also write the total number
of words in (bracket) at the end of the
report.
Example of Informative Presentation
Structure of Question 1
Conclusion
Summarize the report by reiterating the overall trend or the overview and
also mention any opinion or statement given in the visual.
Body
Pick relevant details,analyze,synthesize,compare and contrast and explain
information given
Introduction
Present an overview of the visual(s) and what the general trend is.
Example of question : Report Writing
2 Visuals:
Line graph and
Table
Question requires
you to :
1.Analyse
2.Link information
found in the 2 visual
(synthesizing)
2 visuals:
Bar chart and Table
“Failure is the opportunity to
begin again more
intelligently”
Henry Ford
2 visuals:
Combination of Bar
graph and line graph
Question
requires you to
compare
between the
two visuals.
Is there a
difference
between
comparing and
linking?
150 to 200
words
SUMMARY
Report Writing:
1. Task Fulfilment
2. Language and
organisation
3. 40 marks
Interpretation and
linking data
between 1 or more
visuals.
Must have:
Title
Introduction
Overview
Analysis/Synthesis
Conclusion

Introduction to MUET Writing Question 1.pptx

  • 1.
  • 2.
    BEFORE WE BEGIN LETSTAKE A LOOK AT THE TEST FORMAT FOR REPORT WRITING
  • 3.
    Marks allocation for ReportWriting Task Fulfilment 20 Marks Language and Organisation 20 Marks Total 40 MARKS You are to spend about 40 minutes for Report writing
  • 4.
    Main task ofa Report Writing To interpret information: Based on specific stimuli given in the form of charts, graphs, tables into a written report
  • 5.
    What are thecriteria assessed? 1. Task Fulfilment 2. Language and Organisation
  • 6.
    1. Task Fulfilment 4.Stimulus are well linked 2. Response to the task – addressing the requirements of the question 1. Critical thinking skills 6. Accurate key features 3. Clear introduction and overview/overall trend 5. Synthesized information 7. Good conclusion
  • 7.
    2. Language &Organisation 1. Grammar accuracy 2. Varied and suitable use of vocabulary 3. Relevant phrases 4. Good flow of the report format 5. Writing within the word count
  • 8.
    Layout of theReport 1.TITLE 2.INTRODUCTION 3.OVERVIEW / GENERAL TREND 4.KEY FEATURES (ANALYSIS & SYNTHESIS) 5.Conclusion .
  • 9.
    Only 3 or4 paragraphs for Report writing. Your report must be at least 150 to 200 words (maximum) only (excluding the title). Any words beyond the word count limit will not be included in the marks. You must also write the total number of words in (bracket) at the end of the report. Example of Informative Presentation
  • 10.
    Structure of Question1 Conclusion Summarize the report by reiterating the overall trend or the overview and also mention any opinion or statement given in the visual. Body Pick relevant details,analyze,synthesize,compare and contrast and explain information given Introduction Present an overview of the visual(s) and what the general trend is.
  • 11.
    Example of question: Report Writing 2 Visuals: Line graph and Table Question requires you to : 1.Analyse 2.Link information found in the 2 visual (synthesizing)
  • 12.
  • 13.
    “Failure is theopportunity to begin again more intelligently” Henry Ford
  • 14.
    2 visuals: Combination ofBar graph and line graph Question requires you to compare between the two visuals. Is there a difference between comparing and linking?
  • 15.
    150 to 200 words SUMMARY ReportWriting: 1. Task Fulfilment 2. Language and organisation 3. 40 marks Interpretation and linking data between 1 or more visuals. Must have: Title Introduction Overview Analysis/Synthesis Conclusion