Economic Risk Factor Update: May 2024 [SlideShare]
Global mkts wklyrpt_trustsecurities_july1_12
1. 02/07/2012
Sunday July 01, 2012
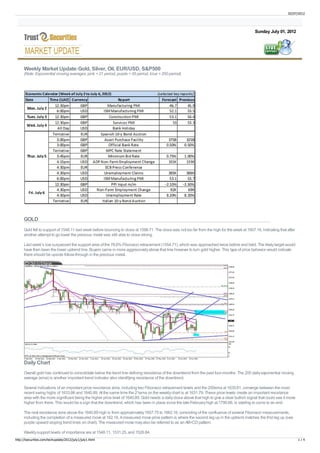
Weekly Market Update:Gold, Silver, Oil, EUR/USD, S&P500
(Note: Exponential moving averages: pink = 21 period, purple = 55 period, blue = 200 period)
GOLD
Gold fell to support of 1548.11 last week before bouncing to close at 1598.71. The close was not too far from the high for the week at 1607.16, indicating that after
another attempt to go lower the precious metal was still able to close strong.
Last week’s low surpassed the support area of the 78.6% Fibonacci retracement (1554.71), which was approached twice before and held. The likely target would
have then been the lower uptrend line. Buyers came in more aggressively above that line however to turn gold higher. This type of price behavior would indicate
there should be upside follow-through in the precious metal.
Daily Chart
Overall gold has continued to consolidate below the trend line defining resistance of the downtrend from the past four-months. The 200 daily exponential moving
average (ema) is another important trend indicator also identifying resistance of the downtrend.
Several indications of an important price resistance zone, including two Fibonacci retracement levels and the 200ema at 1635.61, converge between the most
recent swing highs of 1633.86 and 1640.89. At the same time the 21ema on the weekly chart is at 1631.79. These price levels create an important resistance
area with the more significant being the higher price level of 1640.89. Gold needs a daily close above that high to give a clear bullish signal that could see it move
higher from there. This would be a sign that the downtrend, which has been in place since the late-February high at 1790.66, is starting to come to an end.
The next resistance zone above the 1640.89 high is from approximately 1657.75 to 1662.16, consisting of the confluence of several Fibonacci measurements,
including the completion of a measured move at 162.16. A measured move price pattern is where the second leg up in the uptrend matches the first leg up (see
purple upward sloping trend lines on chart). The measured move may also be referred to as an AB=CD pattern.
Weekly support levels of importance are at 1548.11, 1531.25, and 1526.84.
http://tsecurities.com/techupdate/2012/july1/july1.html 1/4
2. 02/07/2012
Silver
Silver bounced off an important long-term support zone for the fourth time in one-and-a-half years last week. The low for the week was $26.11. Last week’s price
action also completed a test of resistance at the bottom trend line of the bearish flag pattern discussed last week. If the flag pattern follows through as it might,
then a continuation of the four-month downtrend is likely. This would then increase the odds of silver breaking below long-term support of $26.02 and thereby
triggering a downside breakout of the large descending triangle, which was also discussed in last week’s report.
Daily Chart
It’s possible that the significance of the long-term support zone may be enough to counter the bearish flag. Downside risk diminishes if silver can first close
above its downtrend line, and further still on a close above the 55ema, now at $28.71. Most significant would be a close above the swing high at $29.89. At that
point the downtrend pattern structure of lower swing highs will be broken.
Higher resistance zones include $30.46 to $30.55, consisting of the confluence of two Fibonacci measurements, followed by the 200ema at $31.04.
Crude Oil
Some obvious signs of strength were apparent in crude oil last week after it found support at $77.26 and rallied strong. That low is now important long-term
support.
Crude closed at $84.88, near the high for the period, after having briefly surpassing the previous week’s high for the first time in eight-weeks, a sign of strength.
Friday’s strong rally put’s crude well above its 21ema and above its downtrend line. Bullish RSI divergence was one of the clues indicating we might have been
close to a bottom.
Daily Chart
The above bullish signals point to crude heading higher. This could happen relatively fast or over time. In the very short-term crude is extended. Watch for
declines towards short-term support levels at this point for potential entries at lower prices. The 21ema is around $82.74, and a support zone runs from around
$81.20 to $80.80.
The next upside target would be around $88.27/40, where the 55ema matches the 38.2% Fibonacci retracement of the shorter internal downtrend. Just above
there is resistance from approximately $89.60 to $90.00, consisting of prior support and resistance areas and the 38.2% Fibonacci retracement of the full
downtrend. Each of these two price areas look to have a high probability of being reached eventually, at a minimum.
Higher still is a resistance zone from $91.84 to $92.70, consisting of a 50% retracement level and previous support and resistance.
EUR/USD
After breaking down from a bearish flag pattern the EUR/USD retraced back towards resistance (previous support) of the lower parallel line at the bottom of the
flag last week. The 1.2658 close was near the top quarter of the weekly range, while the high was at 1.2695, very close to resistance of the 55ema (1.2699).
http://tsecurities.com/techupdate/2012/july1/july1.html 2/4
3. 02/07/2012
Daily Chart
Once again the 55ema on the daily chart has been tested as resistance and has held. Over the past couple of weeks the 55ema has been hit several times with
trading contained below it. Therefore, the 55ema should be watched closely as trade above it will be the first signs of strengthening, and could lead to the
EUR/USD moving higher. The 55ema is dynamic resistance of the two-month downtrend.
The recent swing high hit selling pressure at 1.2748, which turned the EUR/USD lower. Although trade above the 55ema is a sign of strengthening, the pair
would need to trade above and close above 1.2748 for signs that the downtrend is reversing, at least in the near-term. The pair would then target a Fibonacci
resistance zone from around 1.2886 to 1.2903.
Daily Chart
A move below weekly support of 1.2407, last week’s low, would give a bearish signal and increase the odds the EUR/USD will test the 1.2286 low and probably
surpass it.
S&P500 Index
Although technically there is still a bullish inverse head and shoulders reversal pattern (H&S) in the S&P500 Index chart, I’m going to ignore it for now given the
very steep angle of the upward sloping neckline. The neckline had to be redrawn to take into account last week’s swing high, making the angle very steep and
therefore less reliable for a signal. Anyone who would like more details on this can get in touch with me directly.
Daily Chart
The S&P500 Index closed at 1356, just below resistance of the prior swing high at 1356.75. A close above that level is needed for the next bullish signal - an
uptrend continuation signal. Given the strong momentum seen last week it looks like there’s a very good chance the index will get above that level.
http://tsecurities.com/techupdate/2012/july1/july1.html 3/4
4. 02/07/2012
There are two price zones to watch for resistance above 1356.75. First, watch for resistance around 1379.30, which is the 78.6% Fibonacci retracement of the
downtrend off the right shoulder swing high. Next, resistance could be seen around 1397.25, which is a completion of a measured move, where the second leg
up matches the price appreciation of the first leg up (noted on chart with upward sloping purple lines). The measured move is reflective of price symmetry that
shows up many times in price charts. It’s also called an AB=CD pattern.
Important support is last week’s low at 1302.50, followed by 1297.25, and then 1287.50. Each level is a prior swing low where support from buyers was seen
previously.
Bruce Powers, CMT
Head of Research & Analysis
T: +971 4 4405902
F: +971 4 4405901
E: bp@tsecurities.com
W: www.tsecurities.com
DISCLAIMER
The information contained in this publication is not intended as an offer or solicitation for the purchase or sale of any financial instrument. Any opinion offered herein reflects TRUST SECURITIES current judgment
and may change without notice. Users acknowledge and agree to the fact that, by its very nature, any investment in any TRUST SECURITIES products is characterised by a certain degree of uncertainty and that,
consequently, any investment of this nature involves risks for which the user is solely responsible and liable.
This message is intended for recipient only and not for further distribution without the consent of TRUST SECURITIES . Although TRUST SECURITIES attempts to sweep e-mail and attachments for viruses, it does not
guarantee that either are virus-free and accepts no liability for any damage sustained as a result of viruses.
TRUST SECURITIES provide you with research materials. Any recommendation, opinion or advice contained in such material does not reflect the views of TRUST SECURITIES and does not verify any information
included in such material. TRUST SECURITIES assumes no responsibility for any fact, recommendation, opinion or advice contained in any such research material and expressly disclaims any responsibility for any
decisions or for the suitability of any security or transaction based on it.
Specifically any decisions you may make to buy sell or hold a security based on such research will be entirely your own and not in any way deemed to be endorsed or influenced by or attributed to TRUST
, ,
SECURITIES . It is understood that, without exception, any order based on such research that is placed with TRUST SECURITIES for execution is and will be treated as an UNRECOMMENDED AND UNSOLICITED ORDER.
Further, TRUST SECURITIES assumes no responsibility for the accuracy completeness or timeliness of any such research or for updating such research, which is subject to change without notice at any time. TRUST
,
SECURITIES does not provide investment, tax or legal advice. Under no circumstance is the information contained within such third party research to be used or considered as an offer to sell or a solicitation of an
offer to buy any particular investment.
Office No. Al- Reef Towes, Jumeirah Lake Towers, Dubai, United Arab Emirates. UAE PO Box 12169
Tel: 04440 5902 Fax +9714440 5901 W: www.tsecurities.com E: info@tsecurities.com
http://tsecurities.com/techupdate/2012/july1/july1.html 4/4