Download to read offline


![ABG components
1. pH: indicates H+ ion concentration pH = - log[H+]
2. pO2: O2 that is dissolved in the blood , it reflects the body’s ability
to pick up oxygen from the lungs
3. pCO2 : CO2 that is carried by the blood for excretion through the
lungs - Respiratory parameter
4. HCO3 : Metabolic parameter. It reflects the kidney’s ability to
retain and excrete HCO3
DR. SARAN A K 9](https://image.slidesharecdn.com/interpretationofabgtopresent-231110041913-a455090c/75/Interpretation-of-ABG-pptx-9-2048.jpg)


![B. Acid Base Status
• pH = -log [H+] : Sorensen formula
DR. SARAN A K 17](https://image.slidesharecdn.com/interpretationofabgtopresent-231110041913-a455090c/75/Interpretation-of-ABG-pptx-17-2048.jpg)


![Response to metabolic acid-base disorder
∆minute ventilation – mediated by peripheral chemoreceptors
Fast response = 30-120 min.
Metabolic acidosis
• ↑ 𝑀𝑉 - ↑ 𝐶𝑂2 washout
• Winter’s formula : 𝑬𝒙𝒑𝒆𝒄𝒕𝒆𝒅 PCO2 = 1.5 X [HCO3] + 8±2
Metabolic alkalosis
• ↓ 𝑀𝑉 - ↓ CO2 washout = ↑ PCO2
• E𝒙𝒑𝒆𝒄𝒕𝒆𝒅 PCO2 = 0.7 X HCO3 + 20 ± 5
DR. SARAN A K 36](https://image.slidesharecdn.com/interpretationofabgtopresent-231110041913-a455090c/75/Interpretation-of-ABG-pptx-36-2048.jpg)
![Winter’s formula :
𝐸𝑥𝑝𝑒𝑐𝑡𝑒𝑑 PCO2 = 1.5 X [HCO3] + 8±2
Expected PCO2 = 1.5 x 3.2 + 8±2
Expected PCO2 = 4.8 + 8±2
Expected PCO2 = 12.8 ±2
= 10.8- 14.8
DR. SARAN A K 37](https://image.slidesharecdn.com/interpretationofabgtopresent-231110041913-a455090c/75/Interpretation-of-ABG-pptx-37-2048.jpg)


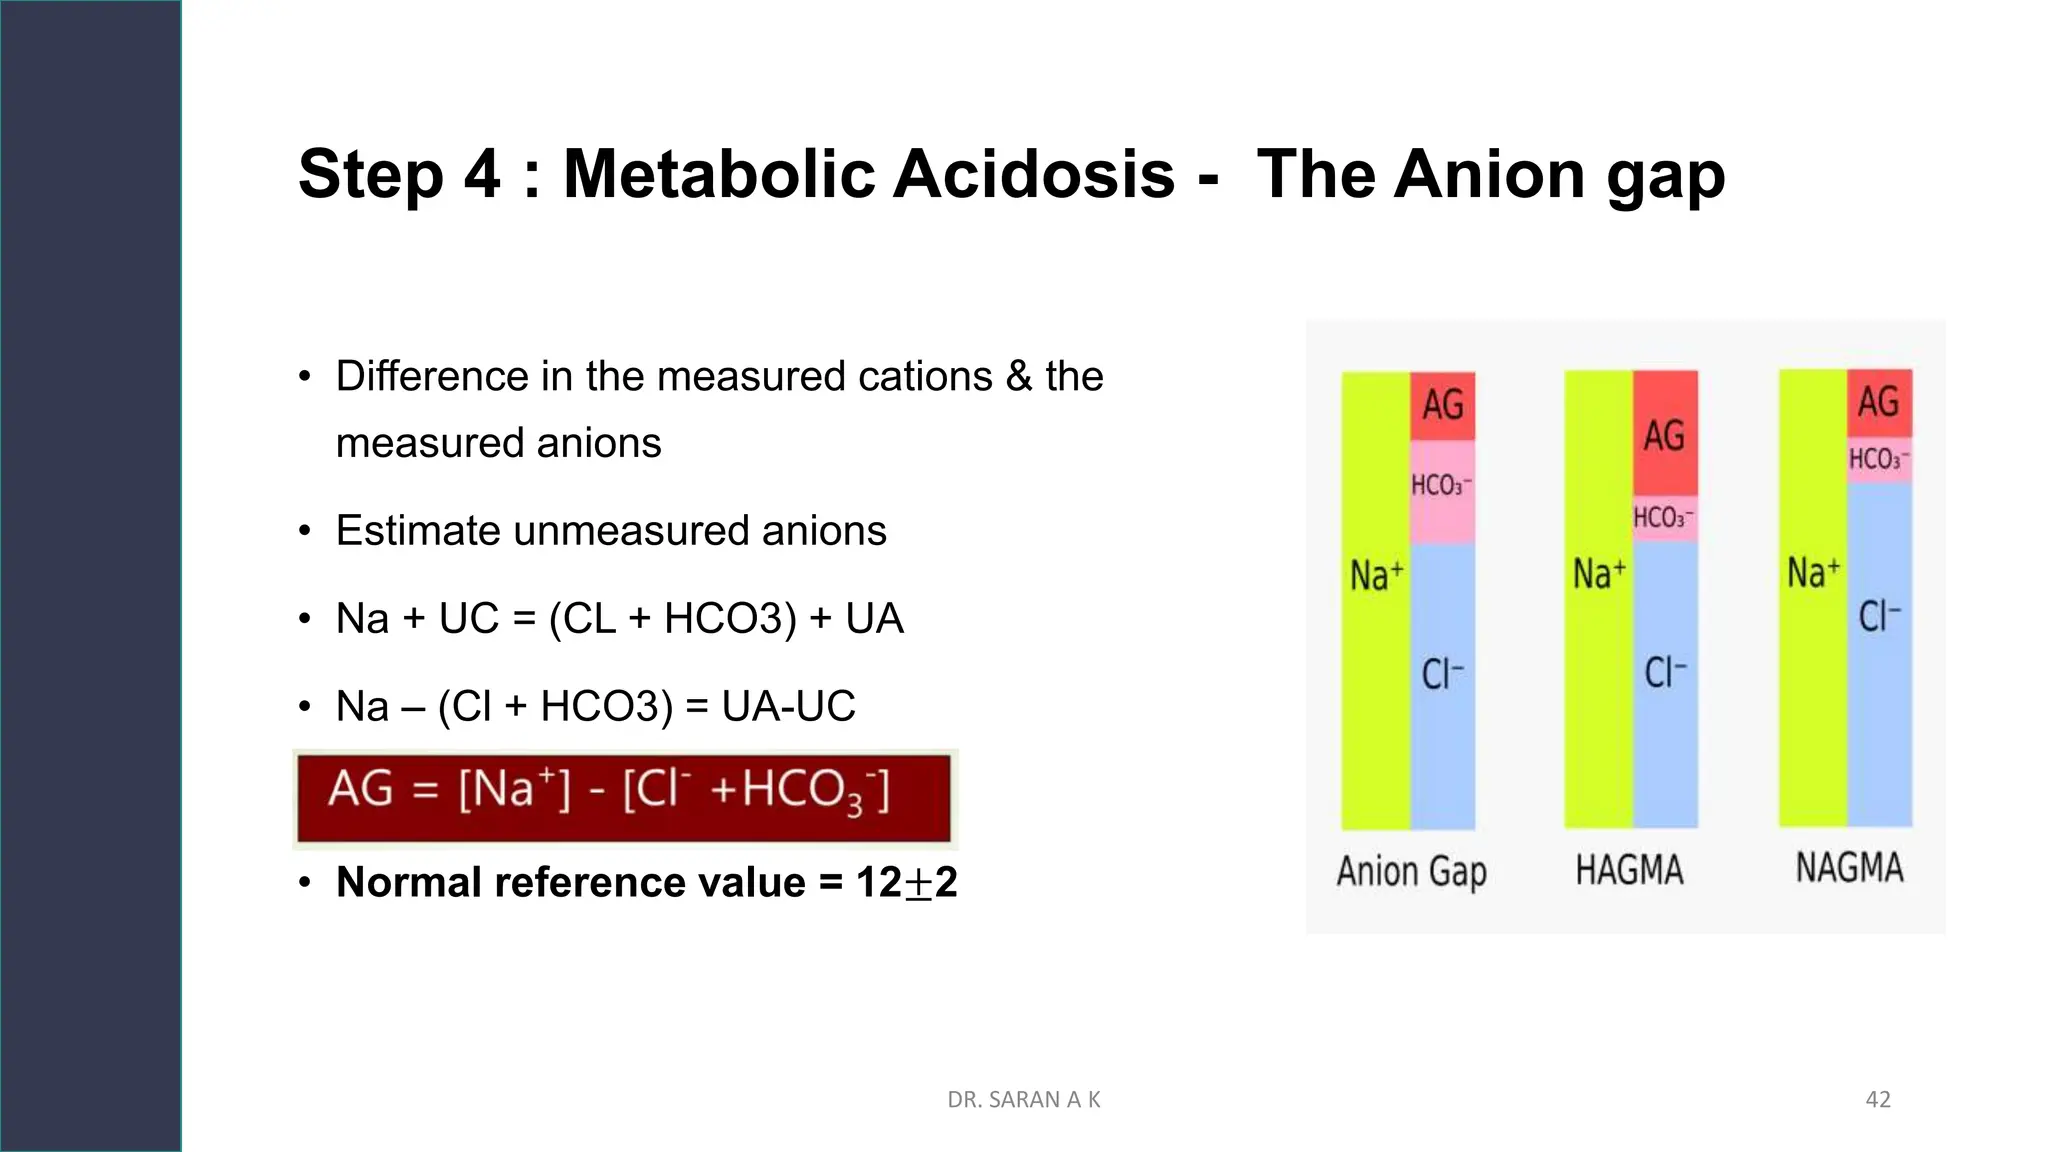


![Influence of albumin
• Principal determinant of AG
• Low albumin lowers AG-mask the presence of UA
• AGc = AG + 2.5 ( 4.5 - [albumin in g/dL])
DR. SARAN A K 45](https://image.slidesharecdn.com/interpretationofabgtopresent-231110041913-a455090c/75/Interpretation-of-ABG-pptx-45-2048.jpg)


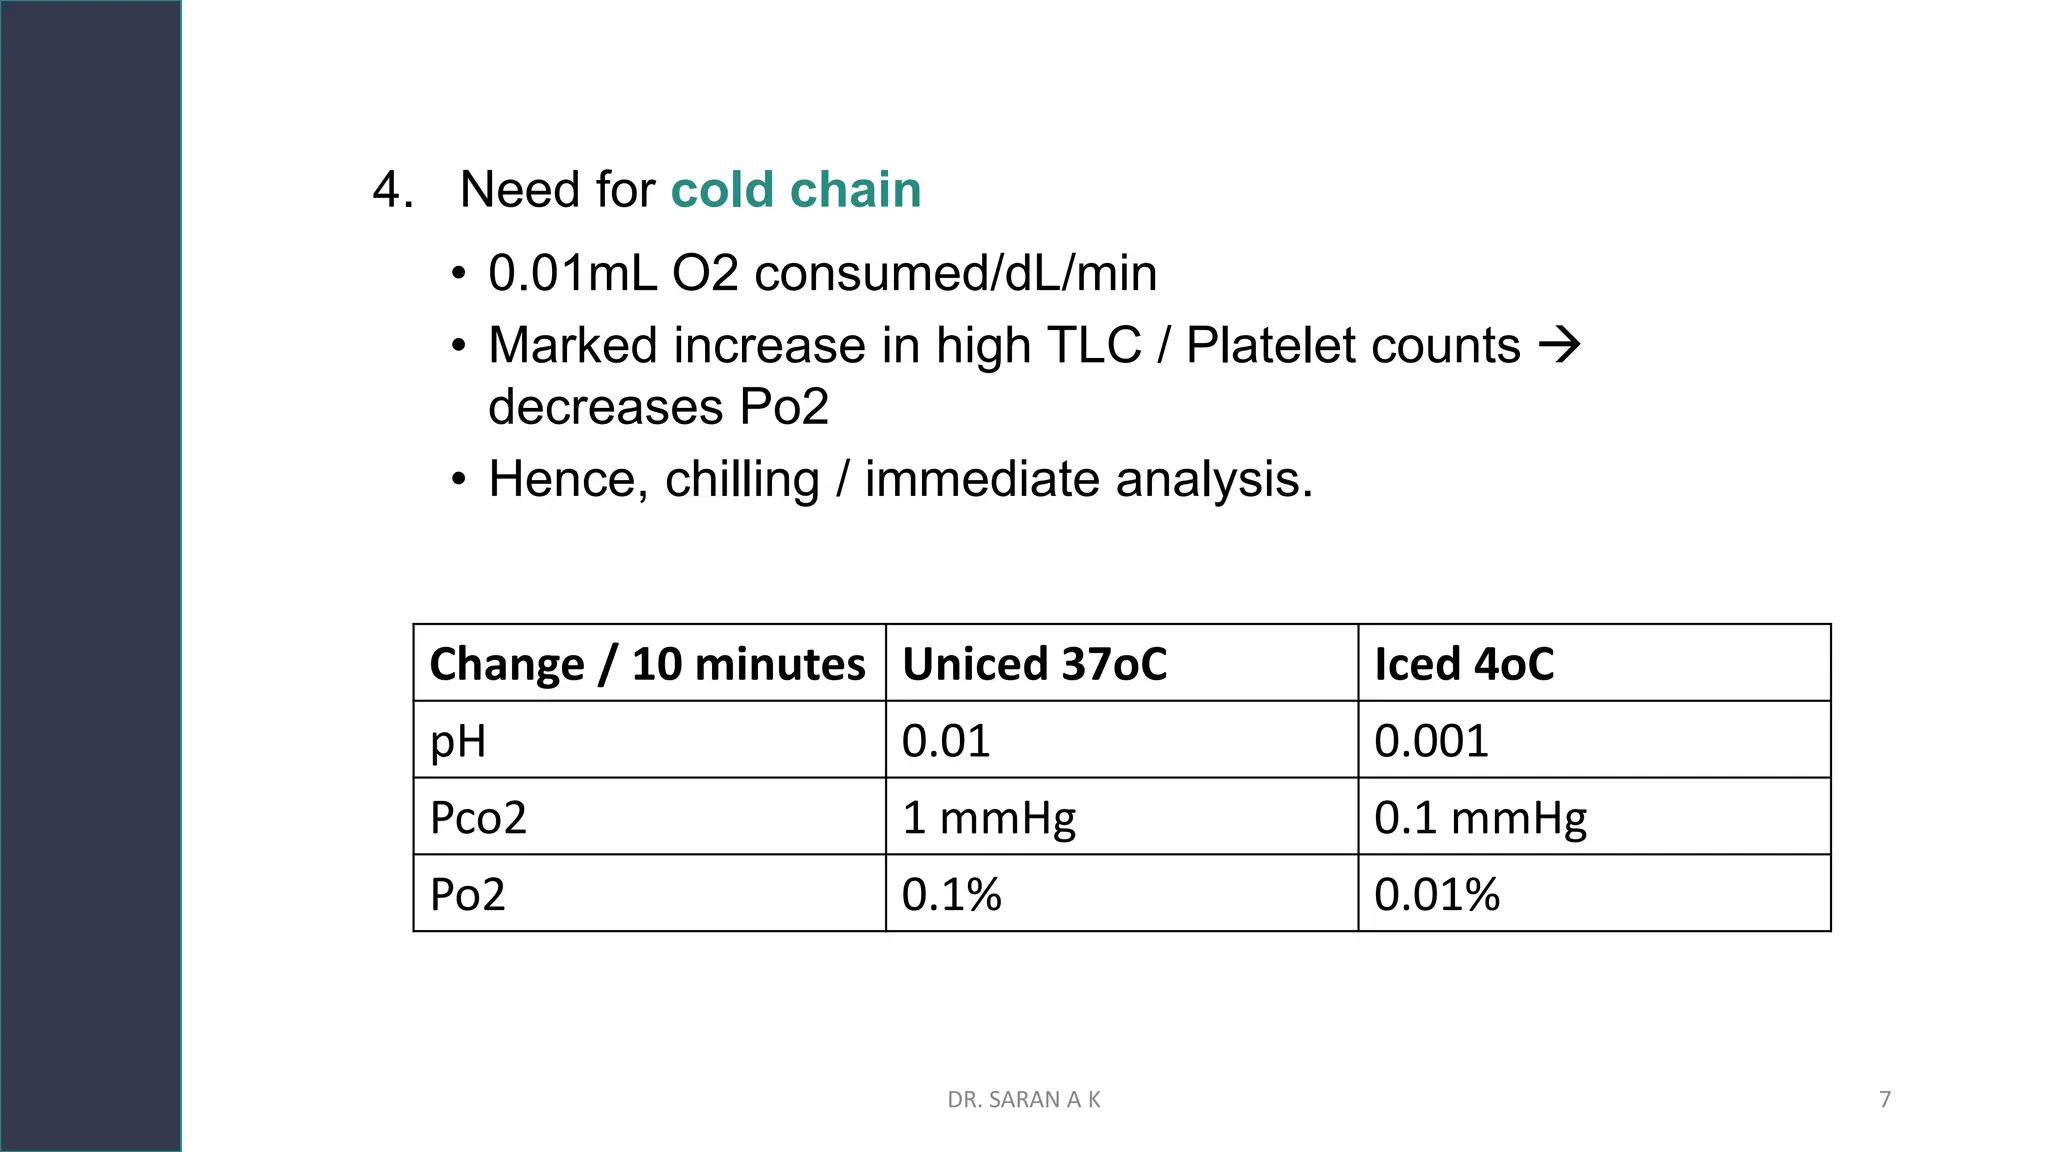
This document discusses arterial blood gas (ABG) analysis and interpretation. It begins by describing how ABGs are obtained and their indications for assessing ventilation, oxygenation, and acid-base balance. It then covers sampling techniques and potential errors. The main components of an ABG are defined and methods for interpreting gas exchange and acid-base status are presented. A step-wise approach to ABG analysis involving assessing the primary disorder, compensation, and mixed disorders is also outlined.


