2. 46 T. Weigel et al. / Journal of Virological Methods 207 (2014) 45–53
processes as shown by Opitz et al. (2009). Here, the losses in the cap-
ture step were most likely due to changes in binding epitopes. As a
result, process robustness need to be carefully evaluated by testing
different influenza strains during process development. In addi-
tion, process modifications during production campaigns might be
required.
The consequent use of chromatographic flow-through process
units would avoid some of the problems addressed above. As elu-
tion steps with e.g. high amounts of salts can be omitted, the risk
for reduction of immunogenicity and aggregation of the virus is
also reduced. In particular for virus harvest with moderate DNA
and protein contamination levels non-capture processes seem to
be highly suitable for efficient virus purification.
So far, only one process for cell cultured-derived influenza virus
purification was published which was able to reach the dose limits
regarding DNA (10 ng) and protein (100 g per strain) as required
by the European Pharmacopoeia (2012) and the US Food and Drug
Administration (FDA) (2012). This process comprised four chro-
matography unit operations involving a virus capture step, and
was operated at 4 ◦C (He et al., 2011). Unfortunately, however, no
information regarding the robustness in terms of batch-to-batch
variation and the impact of changes in influenza A and B virus
strains on yield was provided.
In addition, Iyer et al. (2012) proposed a process train based
on two flow-through steps. However, due to missing information
regarding the level of contamination per dose of vaccine, and the
fact that one of the chromatographic materials used (primary amine
membrane adsorber: ChromaSorb®) is no longer available from
the manufacturer stated, evaluation and use of this process option
is difficult. Nevertheless, comparable results might be achieved
using similar materials from other suppliers. A purification scheme
described by Kalbfuss et al. (2007b) using anion exchange chro-
matography (AEC) and size-exclusion chromatography (SEC) also
avoided capture steps. However, as the authors discussed, further
optimization of this approach is required as the DNA contamina-
tion level (10 ng) for manufacturing of human influenza vaccines
according to the European Pharmacopeia was still exceeded by far.
Similarly, a continuous SEC-based simulated-moving-bed process
proposed by Kroeber et al. (2013), also failed to reach the required
DNA limits for human vaccines while showing improved produc-
tivity.
Therefore, in addition to chromatographic methods, nucle-
ase treatment seems indispensable to achieve reliably accepted
DNA contamination levels in downstream processing of human
influenza vaccines. In fact, the majority of industrial vaccine pro-
duction processes include a nuclease treatment step (Wolff and
Reichl, 2008). The aim is not only to meet the required levels
of residual DNA, but also to reduce viscosity of virus-containing
material and to provide an additional safety step regarding virus
inactivation (US Food and Drug Administration, 2012). With the
expiration of patents for Benzonase® and the availability of new
nuclease products such an enzymatic digestion step is now even
more attractive for downstream processing of virus broths. How-
ever, the disadvantage is that the removal of nucleases can add to
the complexity of downstream processing.
Recently, ligand-activated core chromatography (LCC) resin
types have been made available that offer several advantages over
conventional chromatographic media (GE Healthcare, 2012b). With
an unfunctionalized outer shell and a strong and multi-modal
ligand in the bead core, such resins are ideal for depletion of
host cell proteins and removal of nuclease in one single step. Due
to the spatial exclusion of virus particles from the binding sites
(resin pore size: ∼700 kDa; influenza virus particle size: 75–120 nm
(Lange et al., 1999)), high virus recoveries can be achieved. More-
over, this resin type does not suffer from typical SEC drawbacks
such as low productivity due to limited loading capacity and could
possibly replace a typical SEC step at the end of a purification
train.
In this study, the use of a flow-through process involving three
unit operations for the purification of two influenza A strains and
one influenza B virus strain with the focus on process robustness
is described. As a first step, focusing on the removal of DNA, an
anion exchange stationary phase (HiTrapTM CaptoTM Q) was used,
followed by a DNA digestion step using Benzonase®. In a third step,
a novel LCC stationary phase (CaptoTM Core 700) was chosen for the
depletion of contaminating proteins and the removal of the added
nuclease.
2. Materials and methods
2.1. Virus production
Three human influenza strains have been selected: A/Puerto
Rico/8/34, H1N1 (A/PR) (Robert Koch Institute, Berlin, Germany),
A/Wisconsin/67/2005, H3N2 (A/Wis) (#06/112, National Insti-
tute for Biological Standards and Control, London; UK), and
B/Malaysia/2506/2004 (B/Mal) (#06/104, National Institute for Bio-
logical Standards and Control, London; UK). As host cells, adherent
MDCK cells (#841211903, European Collection of Cell Cultures,
Salisbury, UK) cultivated in serum containing GMEM medium
(#22100-093, Life Technologies, Carlsbad, USA; FCS, #F7524,
Sigma–Aldrich, St. Louis, USA) have been used as described by
Genzel et al. (2004) and Opitz et al. (2009). Before addition of
virus seed, the medium was replaced by serum-free GMEM medium
(#22100-093, Life Technologies, Carlsbad, USA).
2.2. Virus harvest and preprocessing
Culture broths were harvested with a 5 m and a 0.65 m
depth filter (#CFAP0508YY, #CFAP9608YY, GE Water & Process
Technologies, Trevose, USA) in sequence, followed by a chemical
inactivation with -propiolactone (#33672.01, Serva Electrophore-
sis, Heidelberg, Germany; final concentration: 3 mM, 37 ◦C, 24 h).
Subsequently, the broths were processed by a 0.45 m mem-
brane filter (#CMMP9408YY, GE Water & Process Technologies,
Trevose, USA). Finally, the clarified broths were concentrated
by UF-crossflow filtration (cut-off: 750 kDa; UFP-750-E-4MA, GE
Healthcare, Uppsala, Sweden) as described by Kalbfuss et al.
(2007a) and stored at −80 ◦C. This clarified, inactivated and con-
centrated material was used for all shown experiments and will be
called ‘virus material’ hereafter.
2.3. Process set-up
All chromatographic experiments were performed with an
ÄKTAexplorer 100 (GE Healthcare, Uppsala, Sweden). Virus frac-
tions were monitored in-line with a static light scattering detector
(BI-MwA, Brookhaven Instruments Corporation, Holtsville, USA).
Virus material was centrifuged for 10 min at 9000 × g prior to
loading onto columns. For screening studies and determination of
dynamic binding capacity (DBC) the A/PR virus strain was used. All
steps involving dialysis (buffer exchanges, preparation of samples
for analytics) were performed with 3500 kDa cut-off membranes
(#132720, Spectrum Labs, Los Angeles, USA).
2.4. Screening of AEC and LCC
The following AEC matrices were tested at a flow rate of
0.2–2 mL/min: 1 mL HiTrapTM DEAE FF (DEAE) columns (#28-
9165-37, GE Healthcare, Uppsala, Sweden) and 1 mL HiTrapTM
CaptoTM Q (Capto Q) columns (#11-0013-02, GE Healthcare, Upp-
sala, Sweden). Before loading onto column, the virus material was
3. T. Weigel et al. / Journal of Virological Methods 207 (2014) 45–53 47
dialyzed against the corresponding loading buffer (50 mM Tris, pH
7.4, 50–500 mM NaCl). 2 mL of dialyzed virus material were loaded.
Elution was performed with 2 M NaCl, 50 mM Tris, pH 7.4 (data for
the eluate fraction not shown).
For loading of LCC columns (matrix: CaptoTM Core 700 (Capto
Core) prototype provided by GE Healthcare, Uppsala, Sweden; self-
packed; column: #28-4064-08, GE Healthcare, Uppsala, Sweden)
the virus material was conditioned (1:0.25) to 150 mM NaCl,
50 mM Tris, pH 7.4 (in case of Benzonase® use: addition of 2 mM
MgCl2 (final concentration)) or dialyzed over night against 500 mM
NaCl, 50 mM Tris, pH 7.4, respectively. 20 column volumes (CV)
conditioned (corresponds to 16 CV virus material) or dialyzed
virus material were loaded onto a 1 mL column. A flow rate of
0.33–2.4 mL/min was used. For residence time experiments with
0.4, 1 and 3 min, the DNA in the starting material was digested with
Benzonase® (300–500 U/mL for 1–2 h; #101656, Merck, Darmstadt,
Germany) before loading.
Virus particles were collected in the flow-through fraction based
on the in-line scattered light signal.
2.5. Determination of dynamic binding capacities
For DEAE, 40 CV dialyzed virus material (dialysis against: 50 mM
Tris, 250 mM NaCl, pH 7.4; corresponds to 25.6 CV undialyzed
virus material) were loaded onto a 1 mL column (#28-9165-37, GE
Healthcare, Uppsala, Sweden) at a flow rate of 0.33 mL/min.
For Capto Q, 40 CV of conditioned virus material (conditioned
1:0.33 to 500 mM NaCl, 50 mM Tris, pH 7.4; corresponds to 30 CV
virus material) were loaded onto a 1 mL column (#11-0013-02, GE
Healthcare, Uppsala, Sweden) at a flow rate of 1 mL/min.
For LCC virus material was conditioned (1:0.1) to 150 mM NaCl,
50 mM Tris, pH 7.4 and 49 CV (corresponds to 44.6 CV virus
material) were loaded onto a 1 mL Capto Core column (matrix:
CaptoTM Core 700 prototype provided by GE Healthcare, Uppsala,
Sweden; self-packed; column: #28-4064-08, GE Healthcare, Upp-
sala, Sweden) at a flow rate of 0.33 mL/min.
2.6. Benzonase® endpoint determination
Benzonase® with a purity >90% (#101656, Merck, Darmstadt,
Germany) was used for all experiments. Virus material (AP/R)
was dialyzed against 150 mM NaCl, 50 mM Tris, 2 mM MgCl2,
pH 7.4 (in case of i. and ii. in Fig. 1) or conditioned (1:2.33) to
150 mM NaCl, 50 mM Tris, 2 mM MgCl2, pH 7.4 (in case of iii.
in Fig. 1; according to the later process conditions). Gentamycin
(#15710049, Life Technologies, Carlsbad, USA) with a final concen-
tration of 0.1 mg/mL was added. Benzonase® with a final activity of
50 and 300 U per mL DNA containing material were applied, respec-
tively. The Benzonase® digestion was performed at 37 ◦C under
moderate stirring. The digestion was stopped by heat-denaturation
at 72 ◦C for 10–12 min, followed by freezing at −80 ◦C. Residual
DNA content at different time points was analyzed by PicoGreen®
assay.
2.7. Flow-through process
2.7.1. AEC
A 1 mL Capto Q column (#11-0013-02, GE Healthcare, Upp-
sala, Sweden) was equilibrated with 500 mM NaCl, 50 mM Tris,
pH 7.4. Virus material was conditioned (1:0.33) accordingly and
25 CV (corresponds to 18.75 CV virus material) were loaded at
1 mL/min. Elution was performed with 2 M NaCl, 50 mM Tris, pH
7.4 (data for the eluate fraction not shown). Virus particles were
collected in the flow-through based on the in-line scattered light
signal.
2.7.2. Benzonase® treatment
The flow-through fraction from AEC step was conditioned
(1:2.33) to 150 mM NaCl, 50 mM Tris, 2 mM MgCl2, pH 7.4.
Gentamycin (0.1 mg/mL final concentration; #15710049, Life
Technologies, Carlsbad, USA) and Benzonase® (applied: 50 U/mL
of sample material; purity >90%; #101656, Merck, Darmstadt,
Germany) were added and incubated for 13 h at 37 ◦C under mod-
erate stirring.
2.7.3. LCC
A 1 mL Capto Core column (matrix: CaptoTM Core 700 proto-
type provided by GE Healthcare, Uppsala, Sweden; self-packed;
column: #28-4064-08, GE Healthcare, Uppsala, Sweden) was equil-
ibrated with 150 mM NaCl in 50 mM Tris, pH 7.4 and 35 CV from
the preceding process step were directly loaded onto the column
at 0.33 mL/min. Virus particles were collected in the flow-through
based on the in-line scattered light signal.
2.8. Analytics
All assays were performed according to manufacturer’s recom-
mendation or as described in literature if not stated otherwise. All
samples were dialyzed with 3500 kDa cut-off dialysis membranes
(#132720, Spectrum Labs, Los Angeles, USA) against 150 mM NaCl,
50 mM Tris, pH 7.4 and against 15 mM NaCl, 5 mM Tris, pH 7.4 (in
case of following lyophilization) at 4 ◦C (at least overnight) before
analysis, if not stated otherwise.
2.8.1. Hemagglutination assay (HA assay)
The HA assay was done as described by (Kalbfuss et al., 2008) and
used for quantification of virus content and virus recovery. Mea-
surement values are reported as kHAU/mL. The measured standard
deviation of the assay was maximum 7.7%. Samples were measured
in duplicates.
2.8.2. Total protein assay
The total protein was determined by a BioRad assay (#500-0006,
BioRad Laboratories, Hercules, USA) with bovine serum albumin
(#A3912, Sigma–Aldrich, St. Louis, USA) as standard in a range from
5–40 g/mL. The assay was performed as described by Opitz et al.
(2007). Samples were concentrated by lyophilization, if required.
The standard deviation of replicates was ≤3.1%. All samples were
measured in triplicates.
2.8.3. DNA assay – intermediate range
For in-process control of DNA concentration a Quant-iTTM
PicoGreen® assay (PicoGreen) (#P7581, Life Technologies, Carls-
bad, USA) was applied as described by Opitz et al. (2007). For the
standard curve lambda DNA (#D1501, Promega; Madison, USA) in
a range of 4–1000 ng/mL was used. Samples were concentrated by
lyophilization, if required. The standard deviation of replicates was
≤6.9%. All samples were measured in duplicates.
2.8.4. DNA assay – low range
For determination of the impurity level for dose estimations the
DNA concentration in the final product fractions was additionally
determined by a Threshold® Total DNA Assay Kit (#R9009; MDS
Analytical Technologies, Sunnyvale, USA) and workstation (MDS
Analytical Technologies, Sunnyvale, USA) as described by Wolff
et al. (2010). The relative standard deviation of the assay was <10%
according to the manufacturer. All samples were measured in tripli-
cates. Furthermore, additional sample triplicates were spiked with
50 pg of DNA to estimate assay signal recoveries according to the
manufacturer’s recommendation.
4. 48 T. Weigel et al. / Journal of Virological Methods 207 (2014) 45–53
2.8.5. Single radial immunodiffusion assay (SRID)
For estimation of the antigen input per dose the HA protein con-
tent of the final product fraction was quantified by an SRID assay
(Wood et al., 1977). Measurement values are reported as g/mL.
For the virus strain A/PR an in-house produced HA standard was
used (Opitz et al., 2009), while for A/Wis and B/Mal standards were
purchased from National Institute for Biological Standards and Con-
trol (#06/120, #06/126, London, UK) as well as the anti-HA sera for
all strains (#05/236, #03/242, #07/184, London, UK). All samples
were dialyzed against 15 mM NaCl, 5 mM Tris, pH 7.4 followed by
a lyophilization; after resuspension this resulted in an up to 20-
fold concentration of the sample according to the HA assay value.
A 1% agarose gel containing 13 L (for A/PR), 8 L (for A/Wis) or
15 L (for B/Mal) antiserum per mL gel was used as SRID diffu-
sion matrix, respectively. The assay standard deviation of technical
replicates was determined with ±8.0%. All samples were measured
in duplicates.
2.8.6. Benzonase® ELISA
For determination of Benzonase® concentration the final prod-
uct fractions were analyzed by the Benzonase® ELISA Kit II
(#101681, Merck, Darmstadt, Germany). A standard curve between
0.2–25 ng/mL Benzonase® was prepared. Samples were dialyzed
against phosphate buffered solution (pH 7.2) and diluted at least ½
with this buffer containing 1% Tween20® according to the manufac-
turer’s instructions. 100 L of sample was incubated for 2 h at RT in
Benzonase®-antibody coated 96-well plates. After washing 100 L
of 1/100 diluted horse radish peroxidase conjugated antibody was
incubated in the wells for 1 h at RT. After further washing 60 L
3,3 ,5,5 -tetramethylbenzidine was added and incubated for 15 min
at RT. The enzymatic reaction was stopped by adding 140 L of
0.2 M sulfuric acid. The absorbance was measured at 450 nm using
a plate reader (Infinity M200 Pro, Tecan, Männedorf, Switzerland).
The limit of detection (LOD) was 0.2 ng/mL and the relative standard
deviation (precision) of the assay was ±20% according to the man-
ufacturer. All samples were measured in triplicates.
3. Results
3.1. Screening of AEC and LCC
In order to select the best AEC resin and optimal binding
conditions for DNA, the performance of DEAE and Capto Q was
investigated with respect to salt concentration and residence time.
Also, the LCC resin was tested with two different salt concentrations
and different residence times.
Optimal conditions regarding DNA depletion with acceptable
virus recoveries (>80%) were found for DEAE at a salt concentra-
tion of 250–350 mM NaCl. Here, virus recovery was in the range
of 81–93% with residual DNA content of 0.7–1.6%. With increas-
ing residence time (0.5–5 min) virus recovery seemed to drop
slightly (93→81%) while DNA levels remained more or less constant
(0.5–0.9%) (Table 1).
For Capto Q the optimal salt concentration (500 mM NaCl) for
the applied pH range (7.2–7.4) was taken from literature (GE
Healthcare, 2010). For a residence time in the range of 1–4 min HA
recoveries between 98 and 101% were obtained while also the DNA
level was more or less stable in the range of 1.1–1.2% (Table 1).
For LCC the virus recoveries were 93–96% for 150 and 500 mM
NaCl, respectively (Table 2). Furthermore, the DNA and total protein
levels were reduced to 71–83% and 31–43%, respectively. Closer
examination of recoveries and total protein contamination levels at
150 mM NaCl demonstrated that residence time had no significant
influence on results in the range of 0.4–3 min (Table 2).
Table 1
Screening for optimal conditions of the AEC resins DEAE and Capto Q. NaCl concen-
tration in the loading buffer and residence time were modified. Shown are relevant
results for the flow-through fractions. Used influenza strain: A/PR. Virus and DNA
recoveries were determined by HA and PicoGreen®
assay, respectively.
NaCl concentration
[mM]
Residence time
[min]
Recovery DNA/virus [−]
Virus [%] DNA [%]
AEC resin: DEAE
50 5 0 <0.3a
–
175 5 32b
<0.3a,b
<9.4 × 10⁻³
210 5 73 <0.3a
<4.1 × 10⁻³
250 5 81c
0.7c
8.6 × 10⁻³
350 5 93 1.6 17.2 × 10⁻³
500 5 95 101 106.3
250 0.5 92 0.9 9.8 × 10⁻³
250 1 87 0.8 9.2 × 10⁻³
250 3 86 0.5 5.8 × 10⁻³
250 5 81c
0.7c
8.6 × 10⁻³
AEC resin: Capto Q
500 0.5 108 1.5 13.9 × 10⁻³
500 1 101 1.1 10.9 × 10⁻³
500 2 101b
1.2b
11.9 × 10⁻³
500 4 98 1.2 12.2 × 10⁻³
500 10 77b
1.6b
20.8 × 10⁻³
a
Out of assay range.
b
Mean of two experiments.
c
Same experiment.
Table 2
Screening for optimal conditions of the LCC resin Capto Core. NaCl concentration
in the loading buffer and residence time were modified. Shown are results for the
flow-through fractions. Used influenza strain: A/PR. Virus, DNA and total protein
recoveries were determined by HA, PicoGreen®
and Bradford assay, respectively.
NaCl concentration
[mM]
Residence time
[min]
Recovery
Virus [%] DNA [%] Total protein [%]
150 3 93 71 43
500 3 96 83 31
150 0.4a
93 ND 39
150 1a
92 ND 37
150 1.5 94 ND 39
150 3a
92 ND 37
ND: not determined, as focus of this unit operation was on protein depletion.
a
Benzonase®
pretreated material loaded.
3.2. Dynamic binding capacities
DEAE showed a low DBC2% of <108 g DNA/mL resin (Table 3).
For Capto Q no breakthrough for DNA could be observed with
the loaded amount of virus (loaded amount of virus material: 30
CV), giving a DBC2% > 281 g DNA/mL resin. With the LCC resin the
breakthrough for total protein was also not reached (loaded amount
of virus material: 44.6 CV), yielding a DBC > 1.57 mg protein/mL
resin.
Table 3
Dynamic binding capacities and breakthrough point of the AEC resins DEAE, Capto
Q and the LCC resin Capto Core. 1 mL columns were loaded with up to 44.6 CV of
A/PR virus material. Optimal conditions were used for each resin (DEAE: 250 mM
NaCl, 50 mM Tris, pH 7.4; flow rate: 0.33 mL/min. Capto Q: adjusted to 500 mM NaCl,
50 mM Tris, pH 7.4; flow rate: 1 mL/min. Capto Core: adjusted to 150 mM NaCl in
50 mM Tris, pH 7.4; flow rate: 0.33 mL/min).
Chromatography
material
DNA DBC2%
[g/mL resin]
Total protein breakthrough
[mg/mL resin]
AEC: DEAE <108 n/a
AEC: Capto Q >281 n/a
LCC: Capto Core n/a >1.57
n/a: not applicable.
5. T. Weigel et al. / Journal of Virological Methods 207 (2014) 45–53 49
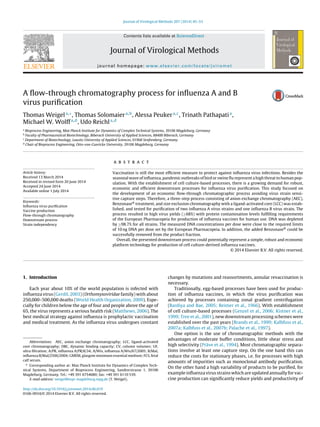
3.3. Benzonase® endpoint determination
Two Benzonase® concentrations (50 and 300 U/mL) and two
DNA starting concentrations (6837 ng/mL and 126 ng/mL) were
tested with respect to incubation time using dialyzed virus mate-
rial. Also, the potential impact of ions in the virus material (as used
in the later process train) on the Benzonase® performance was
examined by using undialyzed but conditioned virus material.
For the dialyzed virus material complete DNA digestion was
not achieved (Fig. 1; i.). With both Benzonase® activities (50 and
300 U/mL) similar final DNA levels of 0.8% (53 ng/mL) and 0.9%
(62 ng/mL) (reduction by about 2 log scales) were reached after
26 h. While with 300 U/mL most DNA was digested after 5 h (DNA
level: 0.9%; 60 ng/mL), with 50 U/mL a minimum of 13 h were
required (DNA level: 1.2%; 84 ng/mL).
For DNA starting concentration comparable to the level after an
AEC purification (about 71–149 ng/mL), a test with a 1/50 diluted
dialyzed material (126 ng/mL) was performed (Fig. 1; ii.), but even
early samples were below the limit of quantification (LOQ).
Finally, using conditioned virus material and a Benzonase®
activity of 50 U/mL, the enzymatic digestion process was completed
with a residual amount of 1.1% (18.1 ng/mL) after 13 h (Fig. 1; iii.),
and no significant adverse effect of the medium on the nuclease
activity (e.g. by monovalent ions) could be found with respect to
the final DNA concentration.
3.4. Flow-through process
In Fig. 2 the performance for each step (AEC (Capto Q),
Benzonase® treatment, LCC) as well as the final recoveries of the
proposed three-step process are shown for A/PR, A/Wis and B/Mal
influenza virus strains. In the first process step, the AEC resulted
in a reduction of DNA to a level of 1.0–4.3% with less than 4% loss
of virus. The total protein level remained almost unchanged with
a minimum of 90% for B/Mal. The following conditioning step was
86420 10 12 14 16 18 20 22 24 26 28
0
2
4
6
8
10
90
100
i.) undil. - 50 U/mL
i.) undil. - 300 U/mL
ii.) 1/50 dil. - 50 U/mL
ii.) 1/50 dil. - 300 U/mL
ii.) (<LOQ)
ii.) (<LOQ)
iii.) cond. - 50 U/mL
IN(DNA)(%)
Incubation time (h)
Fig. 1. Endpoint determination of digestion of DNA by Benzonase®
with variations
in Benzonase®
amount, DNA starting concentration and buffer composition. Val-
ues are set in proportion to the starting DNA concentrations (IN(DNA)). A/PR virus
material used for all experiments. Legend: (i) “undil.–50 U/mL”, “undil.–300 U/mL”:
50 and 300 U/mL Benzonase®
tested with dialyzed undiluted virus material; starting
DNA concentration 6837 ng/mL. (ii) “1/50 dil.–50 U/mL”, “1/50 dil.–300 U/mL”: 50
and 300 U/mL Benzonase®
tested with dialyzed 1/50 diluted virus material; starting
DNA concentration: 126 ng/mL. The crossed points (see legend: “(<LOQ)”) indicate
values below the limit of quantification of the DNA assay (PicoGreen®
) in this experi-
mental set. (iii) “cond.–50 U/mL”: 50 U/mL Benzonase®
tested with undialyzed virus
material conditioned as in the process; starting DNA concentration 1650 ng/mL.
required to adjust buffer conditions for optimal Benzonase® activ-
ity in the next step. In addition, gentamycin was added to suppress
bacterial growth in process material potentially contaminated due
to unsterile process conditions under laboratory conditions. This
conditioning and addition of gentamycin, however, led to a signif-
icant loss of HA activity in the process of 8–16%. In the following
Benzonase® digestion step more than 94% of virus was recovered
while the DNA could be further depleted by 56–69%. Finally, during
Fig. 2. Flow-through process performed with three influenza strains. Shown are the step and the final recoveries (in %) measured by HA (→ Virus), PicoGreen®
(→ DNA)
and Bradford assay (→ Protein). (A) Influenza strain A/PR; (B) influenza strain A/Wis; (C) influenza strain B/Mal. The virus material for the AEC step was preprocessed and
conditioned as described in Sections 2.2 and 2.7.1. Mean and standard deviation of three technical replicates per virus strain are given. Remark: final recoveries at the bottom
include virus losses by gentamycin addition.
6. 50 T. Weigel et al. / Journal of Virological Methods 207 (2014) 45–53
the third process step (LCC), less than 9% of the virus was lost, while
total protein could be depleted to 28–82%. In addition, the level of
DNA was further reduced by up to 30%.
Overall, final virus recovery was 68% (A/PR), 87% (A/Wis), and
82% (B/Mal). Final total protein levels could be reduced to 25%, 44%
and 73% (including the viral proteins), and the level of residual DNA
decreased to 0.4%, 1.3% and 0.26%, respectively. For all influenza
virus strains the residual amount of the nuclease added after the
AEC step was below the limit of detection in the final harvest (data
not shown).
4. Discussion
The scope of this study was the establishment of a robust generic
purification process for cell culture-derived influenza virus par-
ticles. To prevent problems related to annual adaptation of virus
strains and emergence of new serotypes such as the bird flu H5N1,
a flow-through scheme was established avoiding any virus-specific
capture steps and reducing the requirement of specific elution
buffers that potentially could have a negative impact on immuno-
genicity. The proposed three-step process comprises an AEC step,
a nuclease step, and a novel size exclusion chromatography resin
with a ligand-activated core (LCC; CaptoTM Core 700). Special focus
was put on high virus yields in each step as well as on the deple-
tion of DNA, with the latter posing a significant challenge for most
published processes so far.
4.1. Screening of AEC and LCC
Here, a strong and a weak AEC matrix (Capto Q and DEAE) were
compared. Both showed a strong and comparable reduction of DNA
in the virus material. The purity level (1.1–1.6% remaining DNA)
achieved by Capto Q is in agreement with results from Kalbfuss et al.
(2007b), who used Sepharose Q (strong AEC resin) and SEC purified
influenza A/PR/8/34 virus material but encountered higher virus
losses (in average 29%). Also GE Healthcare (2010) achieved with
Capto ViralQ resins (strong AEC resin) comparable DNA depletions
(<1.7%), again with higher virus losses (∼13% in average).
Using a weak AEC resin (DEAE), He et al. (2011) were also able to
reduce the DNA content of SEC prepurified virus material to 2.5%.
However, with a step recovery of 150% chromatography perfor-
mance cannot be evaluated properly.
In the presented work, the Capto Q resin was chosen for the
final process as it showed a high DBC (>2.6 fold) while slightly bet-
ter results regarding DNA reduction were obtained by the DEAE
resin (at virus recoveries >80%: DEAE: 0.7% versus Capto Q: 1.1%;
Table 1). In addition, the use of weak AEC has further drawbacks:
First, they show a high charge variability with respect to pH which
can affect capacity or selectivity (Gagnon, 2013). Second, weak AEC
resins can act as solid phase buffers which might lead to significant
increase in pH during chromatography (Gagnon, 2013). Overall, the
selected strong AEC seems to be a good compromise regarding DNA
reduction, virus yield and process robustness.
With respect to virus recovery both resins showed a residence
time dependency. With decreasing flow rates, the amount of bound
virus increased (reduced virus content in the flow-through fraction;
Table 1). Virus particles are mostly excluded from pores due to their
size which renders pore diffusion effects unlikely to be the source.
Possibly, less shear force might be the reason for an increase in
bound virus at lower flow rates. Regarding the DNA depletion no
clear trend could be observed with respect to the tested flow rates.
The LCC resin showed a wide salt tolerance with high viral recov-
eries (>93%), while removing up to 69% of total protein (Table 2).
The small variation in total protein levels are in the typically
range of variation observed in scouting experiments (data not
shown). The substantial removal of proteins in the tested range
of salt concentrations is in accordance with the ligand type of
this resin (octylamine), which has not only strong anionic but also
strong hydrophobic binding character. The poor depletion of DNA
observed in both first cases (Table 2) was probably due to high
DNA fragment length exceeding the pore size of the beads (700 kDa
molecular weight cut-off). The seen high virus recoveries (Table 2)
are in accordance with the resin feature of an unfunctionalized
outer layer and the spatial exclusion of the virus by the resin pores.
With the tested protein concentration the flow rate had no
impact on the protein removal efficiency. Nevertheless, at higher
protein concentrations a dependency of purification performance
and flow rate could become apparent due to pore diffusion effects.
With a DBC > 1.57 mg/mL resin (Table 3) the resin capacity is con-
sistent with specifications of the manufacturer, who reported a
DBC10% of 13 mg/mL resin for ovalbumin (GE Healthcare, 2012b).
4.2. Benzonase® endpoint determination
Since the AEC screening showed insufficient reduction of DNA,
a nuclease digestion step had to be established as an orthogonal
approach. Various concentration and digestion times have been
reported for virus purification in vaccine or viral vector manu-
facturing processes ranging from 1 U/mL to 1000 U/mL, and from
15 min to 24 h (2–37 ◦C) (Allay et al., 2011; Bandeira et al., 2012;
Hagen et al., 1996b; Kistner et al., 2007; Sastry et al., 2004;
Transfiguracion et al., 2007; Vyas et al., 2012). Therefore, optimal
parameters had to be tested specifically for the presented process.
Experiments with various starting materials using 50 U/mL and
300 U/mL Benzonase® showed that complete digestion of DNA
could not be reached under the used conditions (residual DNA
concentration: 53–62 ng/mL; digestion time: 26 h; Fig. 1; i.). How-
ever, the trend observed in the case of 1/50 diluted dialyzed virus
material (Fig. 1; ii.; DNA starting concentration: 126 ng/mL), which
mimic a similar DNA level as after the AEC step (71–149 ng/mL),
demonstrated high potential for the three-step process. (However,
relevant values were below LOQ of the intermediate range DNA
assay (PicoGreen® assay).)
In literature few processes had been described where
Benzonase® was shown to achieve a complete digestion of DNA
(Sastry et al., 2004). In other downstream processes dealing with
viral material a small DNA level usually seemed to remain (Hagen
et al., 1996a), especially if Benzonase was used on unpurified mate-
rial (Bandeira et al., 2012; GE Healthcare, 2012a; Merten et al.,
2011). In the presented work an unspecific Benzonase® degrada-
tion (for instance by protease activity of the virus harvest) seems
unlikely as spiking of Benzonase®-treated samples with fresh
virus material showed high residual Benzonase® activity (data not
shown). This suggests that residual DNA might not be accessible for
the nuclease. A possible explanation might be the binding of DNA
to proteins or virus particles, which might in addition trigger virus
aggregation.
With respect to costs and process time a Benzonase® activity of
50 U/mL for 13 h was selected for the final process. An extension of
the nuclease step beyond 13 h could be shown to have little effect
on final DNA contamination levels. Previous dialysis/diafiltration
was not necessary (see Section 3.2) which minimizes the number
of process steps.
4.3. Flow-through process
The selection of three different influenza strains for the estab-
lishment of the purification process also involved a relatively high
variation in viral HA, DNA and protein starting concentrations
(Table 4). Therefore, starting conditions mimic closely potential
variations in the harvest of industrial manufacturing processes.
7. T. Weigel et al. / Journal of Virological Methods 207 (2014) 45–53 51
Table 4
Flow-through process performed with three influenza strains. Corresponding process data to Fig. 2. Shown are the volumes and concentration of virus, DNA and total protein
for each process step (entering (IN) and exiting (OUT)). Mean and standard deviation of three technical replicates per virus strain are shown.
Steps Volume [mL] Virus [kHAU/mL] DNA [ng/mL] Total protein [g/mL]
In Out In Out In Out In Out
A/PR
AEC 25.0 (±0.0) 29.8 (±0.0) 31.5 (±2.7) 25.3 (±2.0) 6138 (±233) 70.5 (±1.2) 42.8 (±2.5) 34.7 (±2.4)
Conditioning and gentamicin addition 23.3 (±0.6) 78.5 (±1.9) 25.3 (±2.0) 6.3 (±0.2) 70.5 (±1.2) 17.8 (±2.6) 34.7 (±2.4) 10.9 (±0.3)
Benzonase treatment 60.4 (±0.7) 60.4 (±0.7) 6.3 (±0.2) 5.9 (±0.6) 17.8 (±2.6) 7.3 (±0.2) 10.9 (±0.3) 9.7 (±0.4)
LCC 35.0 (±0.0) 39.4 (±0.0) 5.9 (±0.6) 4.8 (±0.2) 7.3 (±0.2) 5.4 (±0.4) 9.7 (±0.4) 2.4 (±0.6)
A/Wis
AEC 25.0 (±0.0) 29.8 (±0.0) 25.9 (±1.6) 21.4 (±0.3) 2007 (±46) 72.0 (±4.3) 36.2 (±1.0) 29.8 (±1.1)
Conditioning and gentamicin addition 23.0 (±0.0) 77.4 (±0.0) 21.4 (±0.3) 5.5 (±0.2) 72.0 (±4.3) 21.9 (±1.7) 29.8 (±1.1) 8.8 (±0.6)
Benzonase treatment 61.9 (±0.2) 61.9 (±0.2) 5.5 (±0.2) 5.6 (±0.4) 21.9 (±1.7) 9.5 (±0.9) 8.8 (±0.6) 8.7 (±0.9)
LCC 35.0 (±0.0) 39.3 (±0.0) 5.6 (±0.4) 5.0 (±0.4) 9.5 (±0.9) 6.0 (±0.8) 8.7 (±0.9) 3.6 (±0.9)
B/Mal
AEC 25.0 (±0.0) 30.5 (±0.6) 70.0 (±7.8) 55.3 (±1.7) 19,132 (±722) 149.1 (±5.4) 74.5 (±3.5) 55.1 (±3.2)
Conditioning and gentamicin addition 22.9 (±0.1) 77.1 (±0.5) 55.3 (±1.7) 15.2 (±1.9) 149.1 (±5.4) 45.2 (±1.5) 55.1 (±3.2) 16.5 (±0.4)
Benzonase treatment 61.7 (±0.2) 61.7 (±0.2) 15.2 (±1.9) 15.0 (±0.7) 45.2 (±1.5) 13.9 (±1.4) 16.5 (±0.4) 16.1 (±0.4)
LCC 35.0 (±0.0) 39.4 (±0.0) 15.0 (±0.7) 12.6 (±1.8) 13.9 (±1.4) 10.6 (±1.1) 16.1 (±0.4) 11.7 (±0.2)
Overall the combination of AEC, Benzonase® treatment and LCC
resulted in high virus recoveries for all influenza virus strains (Fig. 2;
≥96% for AEC step and ≥91% for LCC step) making a combination
of two chromatography steps for a process train appear feasible.
A 13 h Benzonase® treatment after the AEC step had no signifi-
cant impact on the virus recovery (e.g. by virus particle disruption
caused by stirring). Recoveries were in the typical range of varia-
tion (Fig. 2; 94–102%). Significant losses of HA activity, however,
were encountered during conditioning and gentamycin addition
after the AEC step (Fig. 2; 8–16%). Although any effect of this treat-
ment on unpurified virus material had been excluded beforehand
(data not shown), HA activity of AEC purified material dropped
significantly. A potential adverse effect of gentamycin on puri-
fied virus is possible, however that was not in the scope of this
study. Especially, since that problem would only exist in laboratory
scale purifications while industrial cGMP production of vaccines
significantly reduces the risk of contamination, and any addition
of antibiotics during downstream processing would be avoided
in general. Assuming the latter scenario, the final virus recovery
would improve to 81% (instead of 68%) for A/PR, 101% (instead of
87%) for A/Wis, and 90% of virus (instead of 82%) for B/Mal, which
renders this proposed process highly efficient and robust.
Final contamination levels of DNA were in the narrow range
of 0.26–1.3% of the virus material for all three influenza strains
(PicoGreen® assay data). In comparison to Opitz et al. (2008), who
found a wide distribution of DNA levels (0.3–31.9%) using a pseudo-
affinity membrane adsorber for the same three influenza viruses,
the process established seems to be more robust. However, after
previous depletion of DNA by the AEC step in the process here, the
use of Benzonase® for DNA depletion showed less efficiency (Fig. 2;
step recovery: 31–44%) as compared to the Benzonase® endpoint
determination experiments with unpurified virus material (Fig. 1;
recovery: 1.1%). Perhaps, an enrichment of DNA, which is not acces-
sible for further digestion, could be the reason for this deviation (see
also Section 4.2). A potential DNA level effect on the digestion effi-
ciency can been ruled out to a certain degree (see Sections 3.3 and
4.2; Fig. 1; ii.).
The variations in final protein level (25–73% (Fig. 2);
2.4–11.7 g/mL (Table 4)) might reflect strain-dependency caused
by cell death and cell lysis during virus propagation in the bioreac-
tors. However, such differences could also originate from batch to
batch variations or from protein remnants after removal of spent
growth medium containing serum before infection, which cannot
be excluded completely. Overall, before purification the protein
concentration in the virus material of the three tested virus strain
batches varied from 36.2 to 74.5 g/mL (Table 4). Also, preprocess-
ing of inactivated harvests may play a role. With a cut-off of 750 kDa
used for ultrafiltration (concentration) and the freeze-thaw step
before loading to AEC column, variations in aggregation behavior
of virions and precipitation of larger proteins cannot be ruled out
completely.
For vaccine formulation DNA and total protein contamination
levels per dose are crucial. For cell culture-derived influenza
vaccines usually three different strains are required for blending.
According to the European Pharmacopeia requirements (European
Pharmacopoeia, 2012), for each strain 15 g HA are required, and
the DNA amount must not be greater than 10 ng per dose in total.
Regarding the total protein amount not more than 100 g per virus
strain and not more than 6 times the total HA amount (=270 g
total protein per dose) are accepted. For the determination of
DNA levels in the final product the Threshold® assay was applied,
as it is commonly used in industry due to its lower LOQ and its
acceptance by authorities such as the FDA. In Table 5 the total
amount of HA determined by SRID assay, the DNA contamination
Table 5
Measured and estimated impurity levels of the final product fraction of the flow-through process. Mean and standard deviation of three technical replicates per virus strain
are shown.
A/PR/8/34 (H1/N1) A/Wis/67/2005 (H3N2) B/Mal/2506/2004
Measured concentrations
HA [g/mL] 2.0 (±0.6) 3.1 (±0.3) 4.2 (±0.3)
DNA [ng/mL] (Threshold®
assay) 1.0 (±0.1) 1.5 (±0.9) 1.2 (±0.1)
Total protein [g/mL] 2.4 (±0.6) 3.6 (±0.9) 11.7 (±0.2)
Estimated impurities
ng DNA/15 g HAa
7.3 (±1.4) 7.8 (±5.0) 4.2 (±0.8)
g total protein/15 g HA 18.7 (±7.9) 17.3 (±3.3) 41.9 (±3.5)
a
Calculations based on Threshold®
assay data.
8. 52 T. Weigel et al. / Journal of Virological Methods 207 (2014) 45–53
level determined by the Threshold® assay and the total protein
levels of the final product together with estimations for dose
contaminant levels are shown. The different strains had a final HA
content between 2.0 and 4.2 g/mL (unconcentrated harvest from
LCC step). For A/PR 7.3 ng DNA and 18.7 g total protein, for A/Wis
7.8 ng DNA and 17.3 g total protein, and for B/Mal 4.2 ng DNA and
41.9 g total protein were calculated per dose of vaccine (Table 5).
Accordingly, the total protein amounts per dose were below the
required limits for all strains despite the previously mentioned
variations in depletion efficiency. Regarding the DNA, the limit was
exceeded 1.3–2.4 fold for the three virus strains (based on a limit
of 3.33 ng DNA per strain for a trivalent dose). These variations
can be considered to be acceptable, while in general the DNA level
should be further reduced in order to comply with regulatory
expectations and to strengthen the safety margin of the process.
Apart from that, a discrepancy between the PicoGreen® and
the Threshold® DNA values after the final step could be observed
(Tables 4 and 5). The Threshold® value was 4–9 times lower than
the PicoGreen® value. Such an assay discrepancy (up to 2.6-fold)
has been already reported by Ikeda et al. (2009) for CHO cell
culture-derived products. Here, nuclease digestion might have also
played a role. Since Benzonase® is a unspecific endonuclease, which
is able to cut nucleic acids to pieces of 3–5 bp (Martin, 1991),
small dsDNA fragments might have been the source for the mea-
sured differences. The Threshold® assay gives reliable data above
a minimum fragment size of 600–800 bp (King and Panfili, 1991),
although lower fragment size limits of 100–600 bp have also been
reported (Ikeda et al., 2009; Wolf et al., 2007). On the other side,
the PicoGreen® assay detects fragments to a size in the range of
20–100 bp (Invitrogen, assay application note, 2005, (Wolf et al.,
2007)), but quantification might again depend on fragment size
(Sedlackova et al., 2013). Since the Threshold® assay showed a
higher sensitivity and the risk for neoplastic transformation with
tumor genes from the production cell line can be considered to
be low for fragments smaller than 1000 bp (Petricciani and Regan,
1987; Sheng et al., 2008; Sheng-Fowler et al., 2009), the data of the
Threshold® assay was given here priority over the PicoGreen® data
for estimation of contamination levels.
Few multi-step processes have been published for the purifi-
cation of influenza virus and even less have been able to meet
the required contaminant levels per dose or addressed all rele-
vant aspects for blending of influenza virus vaccines. In addition,
all published processes considered purification of only one single
influenza virus strain, except for Opitz et al., who found some signif-
icant variations between the tested different strains. In particular,
the DNA level exceeded the limit 8–32 fold (Opitz et al., 2007, 2008)
and 104–265 fold, respectively (Opitz et al., 2009).
Regarding processes with capture steps tested with a single
virus strain only, He et al. (2011) demonstrated that total protein
and DNA contamination levels below the requested limits can be
obtained using four chromatography steps. Overall, they achieved
a final virus recovery of 102% after six steps, however no error was
given. Furthermore, the starting level of DNA contamination was
significantly lower than in this process (He et al.: 0.02–0.05 g/mL
DNA after centrifugation of harvest; this process: 2.0–19.1 g/mL
DNA after UF concentration). The difference might be related to
the choice of cell culture media, host cell properties and/or harvest
time point. In addition, these authors used a different assay for DNA
quantification.
Compared to a flow-through process published by Kalbfuss
et al. (2007b) the final DNA and protein levels were in a similar
range (DNA: 0.5%; total protein: 24%). But based on their HA
protein estimation they exceeded the DNA limit for a triva-
lent dose about 150-fold (in comparison to 1.3–2.4 fold here).
Also, the two flow-through process approaches proposed by
(GE Healthcare, 2012a) exceeded the DNA limit 32-fold and
23-fold, respectively. Interestingly, neither their nuclease step
resulted in a complete removal of DNA, which would support the
hypothesis that part of the DNA is not accessible for digestion
(see Section 4.2).
Therefore, it seems possible that in many cases a further reduc-
tion of residual DNA of cell culture-derived virus particles cannot
be achieved by conventional methods or would require an uneco-
nomic number of downstream processing steps. In the presented
work the use of two orthogonal DNA removal steps still has been
insufficient, apparently. In particular, it cannot be excluded that
DNA fragments bind to virus particles or virus-protein aggregates
rendering any attempts for further contamination level reduction
by enzymatic or chromatographic methods difficult. Further efforts
could focus on confirmation of such unspecific DNA binding by
labeling techniques using fluorescence microscopy or removal by
applying certain chaotropic salt concentrations or changes in buffer
composition. Alternatively, in case of a later use of antigens in split
or subunit vaccines the use of detergents might help to further
reduce DNA contamination level. Finally, a specific focus should be
laid on the minimization of DNA contamination levels in upstream
processing by proper selection of media, cultivation conditions and
harvest time points.
5. Conclusions
The established three-step flow-through process consisting of
AEC, Benzonase® treatment, and LCC gives strain-independent
high virus recoveries (68–87%) with residual DNA levels of
1.0–1.5 ng/mL approaching the limits required according to Euro-
pean Pharmacopeia guidelines for all tested strains closely (1.3–2.4
fold of the required European Pharmacopeia limit). Although some
variation in total protein depletion was observed (2.4–11.7 g/mL),
the contamination levels for proteins were below the European
Pharmacopeia limits for all virus strains. Further investigations
need to be done to identify possible bottlenecks in DNA depletion
(such as a potential adsorption of DNA to virus particles). Overall
the process represents an alternative to the so far published pro-
cesses and might be suitable for other virus purification trains as
well.
Acknowledgements
The authors would like to thank GE Healthcare for providing the
CaptoTM Core 700 prototype and Anna Akerblom (GE Healthcare)
for support. In addition, we are grateful to Claudia Best and Yvonne
Genzel for providing the virus broths.
References
Allay, J.A., Sleep, S., Long, S., Tillman, D.M., Clark, R., Carney, G., Fagone, P., McIn-
tosh, J.H., Nienhuis, A.W., Davidoff, A.M., Nathwani, A.C., Gray, J.T., 2011. Good
manufacturing practice production of self-complementary serotype 8 adeno-
associated viral vector for a hemophilia B clinical trial. Hum. Gene Ther. 22,
595–604.
Bandeira, V., Peixoto, C., Rodrigues, A.F., Cruz, P.E., Alves, P.M., Coroadinha, A.S.,
Carrondo, M.J.T., 2012. Downstream processing of lentiviral vectors: releasing
bottlenecks. Hum. Gene Ther. Methods 23, 255–263.
Bardiya, N., Bae, J.H., 2005. Influenza vaccines: recent advances in production tech-
nologies. Appl. Microbiol. Biotechnol. 67, 299–305.
Brands, R., Visser, J., Medema, J., Palache, A.M., van Scharrenburg, G.J., 1999. Influvac:
a safe Madin Darby Canine Kidney (MDCK) cell culture-based influenza vaccine.
Dev. Biol. Stand. 98, 93–111.
European Pharmacopoeia, 2012. Influenza vaccine (whole virion, inactivated, pre-
pared in cell cultures). In: European Directorate for the Quality of Medicines
(Ed.), 7.8.
Gagnon, P., 2013. Downstream Industrial Biotechnology: Recovery and Purification.
Wiley, Hoboken, NJ.
GE Healthcare, 2010. Use of CaptoTM
ViralQ for the Removal of Genomic DNA from
Influenza Virus Produced in MDCK Cells. Application note 28-9769-69 AA.
GE Healthcare, 2012a. Purification of Influenza A/H1N1 Using CaptoTM
Core 700.
Application note 29-0003-34 AA.
9. T. Weigel et al. / Journal of Virological Methods 207 (2014) 45–53 53
GE Healthcare, 2012b. Capto Core 700. Application note 28-9983-07 AA.
Genzel, Y., Behrendt, I., Konig, S., Sann, H., Reichl, U., 2004. Metabolism of MDCK cells
during cell growth and influenza virus production in large-scale microcarrier
culture. Vaccine 22, 2202–2208.
Genzel, Y., Fischer, M., Reichl, U., 2006. Serum-free influenza virus production avoid-
ing washing steps and medium exchange in large-scale microcarrier culture.
Vaccine 24, 3261–3272.
Gerdil, C., 2003. The annual production cycle for influenza vaccine. Vaccine 21,
1776–1779.
Hagen, A.J., Oliver, C.N., Sitrin, R.D., 1996a. Optimization of poly(ethylene glycol)
precipitation of hepatitis a virus used to prepare VAQTA, a highly purified
inactivated vaccine. Biotechnol. Progr. 12, 406–412.
Hagen, A.J., Aboud, R.A., DePhillips, P.A., Oliver, C.N., Orella, C.J., Sitrin, R.D., 1996b.
Use of a nuclease enzyme in the purification of VAQTA, a hepatitis A vaccine.
Biotechnol. Appl. Biochem. 23, 209–215.
He, C.Y., Yang, Z.Q., Tong, K.T., 2011. Downstream processing of Vero cell-derived
human influenza A virus (H1N1) grown in serum-free medium. J. Chromatogr.
A 1218, 5279–5285.
Ikeda, Y., Iwakiri, S., Yoshimori, T., 2009. Development and characterization of a
novel host cell DNA assay using ultra-sensitive fluorescent nucleic acid stain
“PicoGreen”. J. Pharm. Biomed. Anal. 49, 997–1002.
Iyer, G., Ramaswamy, S., Cheng, K.-S., Sisowath, N., Mehta, U., Leahy, A., Chung,
F., Asher, D., 2012. Flow-through purification of viruses – a novel approach to
vaccine purification. Proc. Vaccinol. 6, 106–112.
Kalbfuss, B., Genzel, Y., Wolff, M., Zimmermann, A., Morenweiser, R., Reichl, U.,
2007a. Harvesting and concentration of human influenza A virus produced in
serum-free mammalian cell culture for the production of vaccines. Biotechnol.
Bioeng. 97, 73–85.
Kalbfuss, B., Wolff, M., Morenweiser, R., Reichl, U., 2007b. Purification of cell
culture-derived human influenza a virus by size-exclusion and anion-exchange
chromatography. Biotechnol. Bioeng. 96, 932–944.
Kalbfuss, B., Knochlein, A., Krober, T., Reichl, U., 2008. Monitoring influenza virus
content in vaccine production: Precise assays for the quantitation of hemagglu-
tination and neuraminidase activity. Biologicals 36, 145–161.
King, R.S., Panfili, P.R., 1991. Influence of fragment size on DNA quantification
using DNA-binding proteins and a sensor-based analytical system – applica-
tion in the testing of biological products. J. Biochem. Biophys. Methods 23,
83–93.
Kistner, O., Barrett, P.N., Mundt, W., Reiter, M., Schober-Bendixen, S., Eder, G.,
Dorner, F., 1999. A novel mammalian cell (Vero) derived influenza virus vac-
cine: Development, characterization and industrial scale production. Wien. Klin.
Wochenschr. 111, 207–214.
Kistner, O., Barrett, N., Bruehmann, A., Reiter, M., Mundt, W., Savidis-Dacho, H.,
Schober-Bendixen, S., Dorner, F., Aaskov, J., 2007. The preclinical testing of a
formaldehyde inactivated Ross River virus vaccine designed for use in humans.
Vaccine 25, 4845–4852.
Kroeber, T., Wolff, M.W., Hundt, B., Seidel-Morgenstern, A., Reichl, U., 2013. Continu-
ous purification of influenza virus using simulated moving bed chromatography.
J. Chromatogr. A 1307, 99–110.
Lange, W., Vogel, G., Upholff, E.H., 1999. Influenza: Virologie, Epidemiologie, Klinik,
Therapie und Prophylaxe. Blackwell-Wissenschafts-Verlag, Berlin, Wien.
Martin, K., 1991. Benzon-nuclease-characteristics and application of the new type
of endonuclease for the elimination of disturbing nucleic acids. Schweizerische
Laboratoriums-Zeitschrift 48, 199–201.
Matthews, J.T., 2006. Egg-Based Production of Influenza Vaccine: 30 Years of Com-
mercial Experience. The Bridge, National Academy of Engineering.
Merten, O.W., Charrier, S., Laroudie, N., Fauchille, S., Dugue, C., Jenny, C.,
Audit, M., Zanta-Boussif, M.A., Chautard, H., Radrizzani, M., Vallanti, G.,
Naldini, L., Noguiez-Hellin, P., Galy, A., 2011. Large-scale manufacture and
characterization of a lentiviral vector produced for clinical ex vivo gene therapy
application. Hum. Gene Ther. 22, 343–356.
Opitz, L., Salaklang, J., Buttner, H., Reichl, U., Wolff, M.W., 2007. Lectin-affinity chro-
matography for downstream processing of MDCK cell culture derived human
influenza A viruses. Vaccine 25, 939–947.
Opitz, L., Zimmermann, A., Lehmann, S., Genzel, Y., Lubben, H., Reichl, U., Wolff,
M.W., 2008. Capture of cell culture-derived influenza virus by lectins: strain
independent, but host cell dependent. J. Virol. Methods 154, 61–68.
Opitz, L., Lehmann, S., Reichl, U., Wolff, M.W., 2009. Sulfated membrane adsorbers
for economic pseudo-affinity capture of influenza virus particles. Biotechnol.
Bioeng. 103, 1144–1154.
Palache, A.M., Brands, R., Van Scharrenburg, G.J.M., 1997. Immunogenicity and reac-
togenicity of influenza subunit vaccines produced in MDCK cells or fertilized
chicken eggs. J. Infect. Dis. 176, S20–S23.
Petricciani, J.C., Regan, P.J., 1987. Risk of neoplastic transformation from cellular
DNA: calculations using the oncogene model. Dev. Biol. Stand. 68, 43–49.
Präve, P., Faust, U., Sittig, W., Sukatsch, D.A., 1994. Handbook of Biotechnolgy, 4 ed.
Oldenbourg.
Reimer, C.B., Baker, R.S., Newlin, T.E., Havens, M.L., 1966. Influenza virus purification
with the zonal ultracentrifuge. Science 152, 1379–1381.
Sastry, L., Xu, Y., Cooper, R., Pollok, K., Cornetta, K., 2004. Evaluation of plasmid DNA
removal from lentiviral vectors by benzonase treatment. Hum. Gene Ther. 15,
221–226.
Sedlackova, T., Repiska, G., Celec, P., Szemes, T., Minarik, G., 2013. Fragmentation
of DNA affects the accuracy of the DNA quantitation by the commonly used
methods. Biol. Proced. Online 15, 5.
Sheng, L., Cai, F., Zhu, Y., Pal, A., Athanasiou, M., Orrison, B., Blair, D.G., Hughes, S.H.,
Coffin, J.M., Lewis, A.M., Peden, K., 2008. Oncogenicity of DNA in vivo: tumor
induction with expression plasmids for activated H-ras and c-myc. Biologicals
36, 184–197.
Sheng-Fowler, L., Lewis Jr., A.M., Peden, K., 2009. Issues associated with residual
cell-substrate DNA in viral vaccines. Biologicals 37, 190–195.
Transfiguracion, J., Jorio, H., Meghrous, J., Jacob, D., Kamen, A., 2007. High yield purifi-
cation of functional baculovirus vectors by size exclusion chromatography. J.
Virol. Methods 142, 21–28.
Tree, J.A., Richardson, C., Fooks, A.R., Clegg, J.C., Looby, D., 2001. Comparison of large-
scale mammalian cell culture systems with egg culture for the production of
influenza virus A vaccine strains. Vaccine 19, 3444–3450.
US Food and Drug Administration, 2012. Cell Lines Derived from Human Tumors
for Vaccine Manufacture, Vaccines and Related Biological Products Advisory
Committee Meeting: Cell Lines Derived from Human Tumors for Vaccine Man-
ufacture.
Vyas, G.N., Stoddart, C.A., Killian, M.S., Brennan, T.V., Goldberg, T., Ziman, A., Bryson,
Y., 2012. Derivation of non-infectious envelope proteins from virions isolated
from plasma negative for HIV antibodies. Biologicals 40, 15–20.
Wolf, J.J., Wong, L., Wang, F., 2007. Application of PCR technology in vaccine product
development. Expert Rev. Vaccines 6, 547–558.
Wolff, M.W., Reichl, U., 2008. Downstream processing: from egg to cell culture-
derived influenza virus particles. Chem. Eng. Technol. 31, 846–857.
Wolff, M.W., Siewert, C., Hansen, S.P., Faber, R., Reichl, U., 2010. Purification of cell
culture-derived modified vaccinia ankara virus by pseudo-affinity membrane
adsorbers and hydrophobic interaction chromatography. Biotechnol. Bioeng.
107, 312–320.
Wood, J.M., Schild, G.C., Newman, R.W., Seagroatt, V., 1977. An improved single-
radial-immunodiffusion technique for the assay of influenza hemagglutinin
antigen: application for potency determinations of inactivated whole virus and
subunit vaccines. J. Biol. Stand. 5, 237–247.
World Health Organization, 2009. Fact sheet N◦
211: Influenza (Seasonal). World
Health Organization.