internship p3 on data analysis and machine learning.pptx
1.
VISVESVARAYA TECHNOLOGICAL UNIVERSITY,BELAGAVI590018
S.J.M VIDYAPEETHA ®
S.J.M INSTITUTE OF TECHNOLOGY
DEPARTMENT OF ELECTRICAL AND ELECTRONICS ENGINEERING
INTERNSHIP PROJECT PRESENTATION ON
Crop Diversification and Productivity Analysis in Andhra Pradesh Districts
AND
Rain Fall Prediction using Machine Learning
PROJECT ASSOCIATES
ANIL B
MOHITHRO
PANDU S
PRAJWAL V
NINGARAJ K
RAJESH E
(4SM21EE005)
(4SM21EE013)
(4SM21EE014)
(4SM21EE015)
(4SM22EE406)
(4SM22EE412)
UNDER THE GUIDANCE OF INTERNSHIP COORDINATOR
Mrs. Sushmitha Deb M.Tech
Asst. Prof. Dept., of
E&E SJMIT,
Chitradurga.
05/11/2025 1
Mr. SaiCharanTeja
INTRODUCTION
•Significance of Agriculturein Andhra Pradesh
• Agriculture is the primary livelihood for a large portion of the population.
•Diverse Agro-Climatic Conditions
• Andhra Pradesh has varied climatic zones, soil types, and water resources.
•Challenges in Agriculture
• Climate change impacts: droughts, floods, and irregular rainfall.
•Concept of Crop Diversification
• Definition: Growing a variety of crops instead of relying on a single one.
•Importance of Productivity Analysis
• Understanding crop yield patterns and productivity trends at the district level.
•Study Objectives
• To assess the extent of crop diversification in Andhra Pradesh district.
Crop Diversification and Productivity Analysis in Andhra Pradesh Districts
4.
OBJECTIVES
Identify theMajor Crops: This involves analyzing the production data for various crops and identifying
those with the highest overall production levels.
Analyze Production Distribution: This includes using visualizations like pie charts to illustrate the
contribution of each district to the total production of major crops.
Explore Regional Specialization: Identify districts that specialize in the production of specific crops.
Provide Insights for Stakeholders: Offer valuable insights to stakeholders in the agricultural sector,
including farmers, policymakers, and agricultural organizations.
Support Data-Driven Decision-Making: provides evidence-based insights and recommendations based on
the analysis of crop production data.
Enhance Understanding of Crop Dynamics: This involves analyzing the interactions between crop
production, geographical factors, and time to gain a deeper understanding of the agricultural landscape.
Identify Areas for Future Research: This Identify areas for future research that can further enhance our
understanding of crop production in Andhra Pradesh. This may include exploring factors influencing
production trends, investigating the impact of climate change.
5.
PROBLEM STATEMENT
Identifythe dominant crops produced in Andhra Pradesh and their relative contribution to overall
agricultural output.
Analyze the distribution of crop production across different districts to identify regional
specialization and potential variations in agricultural practices.
Explore trends in crop production over time to understand the evolution of Andhra Pradesh's
agricultural landscape and potential impacts of factors such as technological advancements,
government policies, and climate change.
6.
FLOWCHART
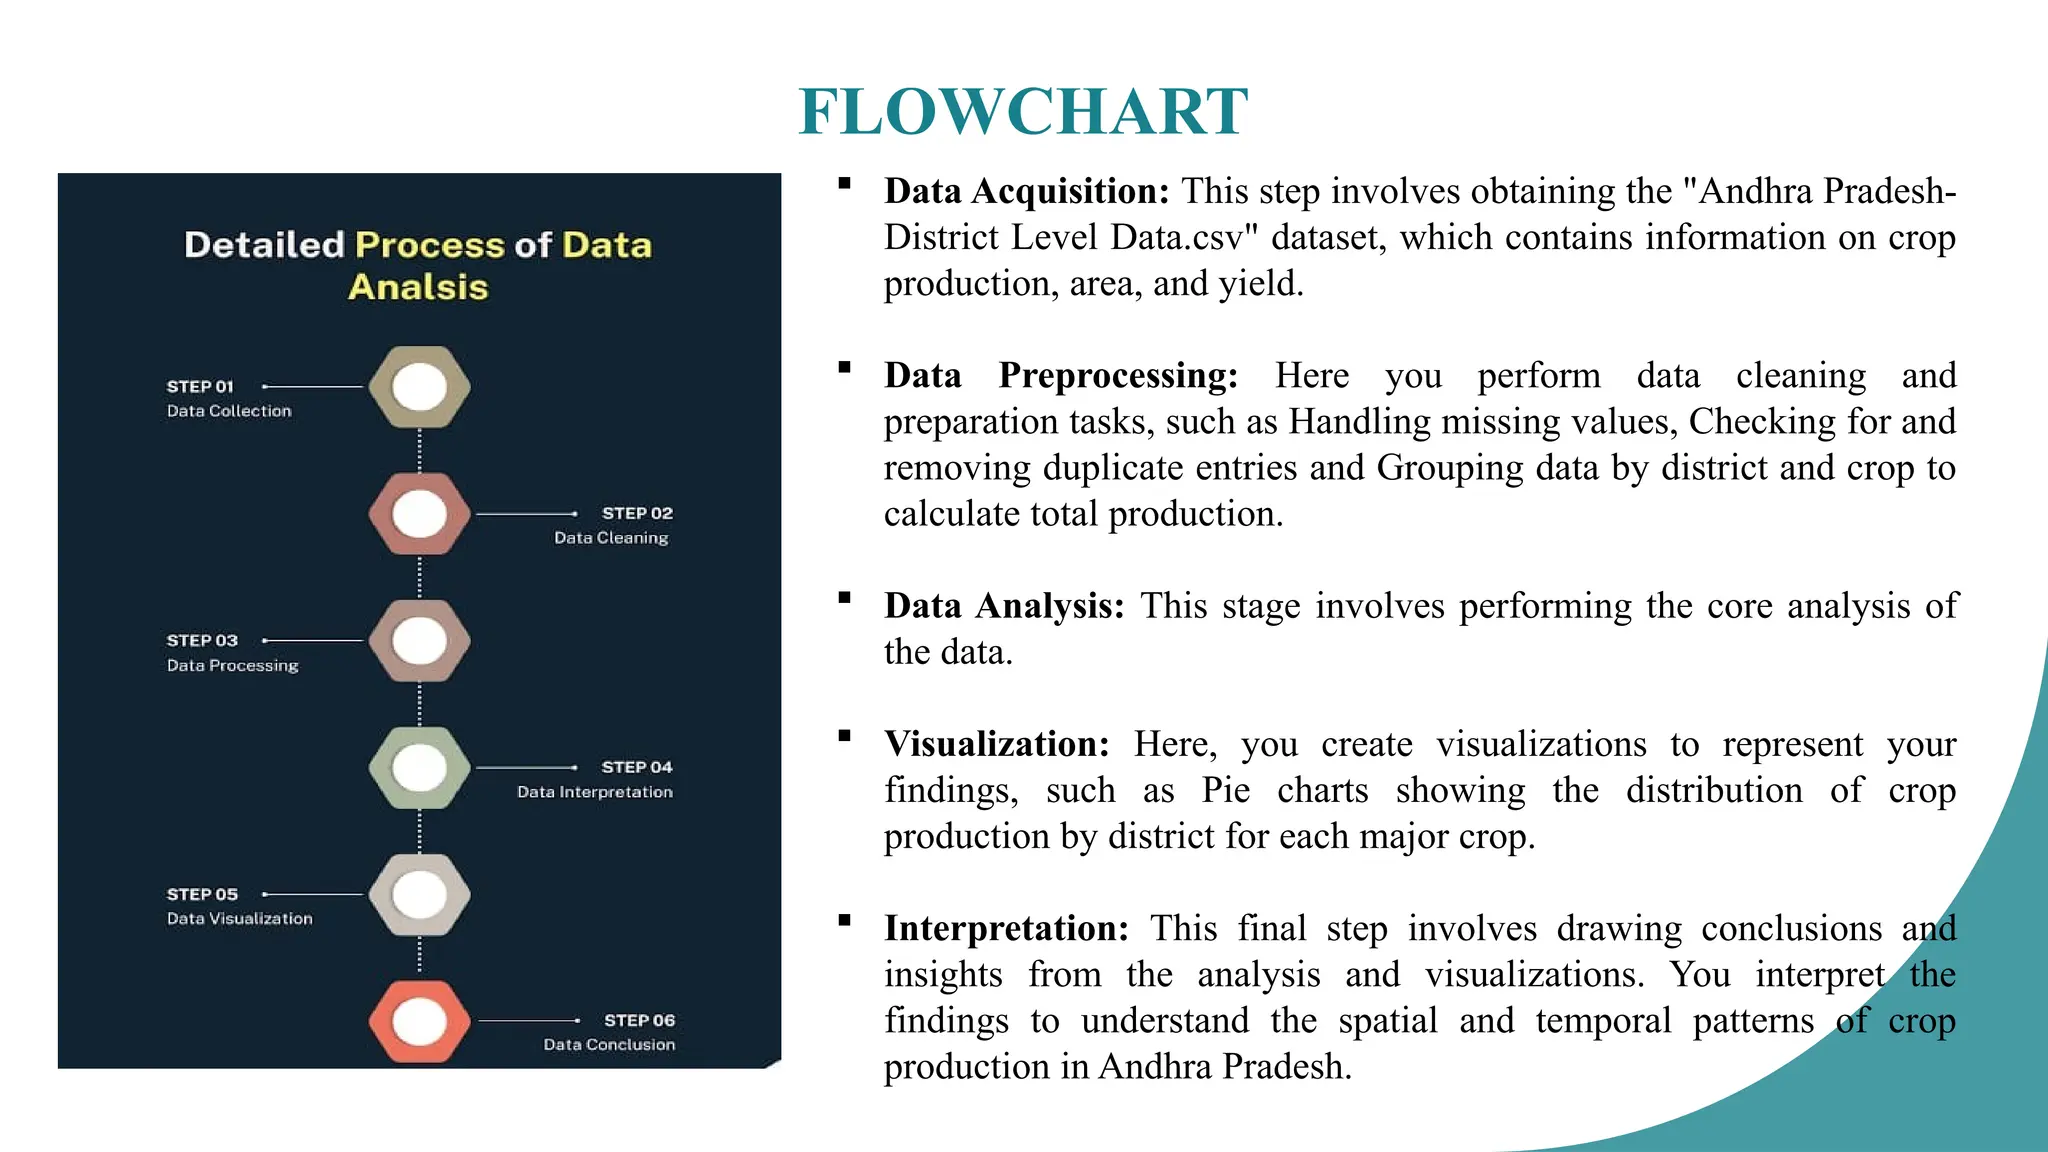
Data Acquisition:This step involves obtaining the "Andhra Pradesh-
District Level Data.csv" dataset, which contains information on crop
production, area, and yield.
Data Preprocessing: Here you perform data cleaning and
preparation tasks, such as Handling missing values, Checking for and
removing duplicate entries and Grouping data by district and crop to
calculate total production.
Data Analysis: This stage involves performing the core analysis of
the data.
Visualization: Here, you create visualizations to represent your
findings, such as Pie charts showing the distribution of crop
production by district for each major crop.
Interpretation: This final step involves drawing conclusions and
insights from the analysis and visualizations. You interpret the
findings to understand the spatial and temporal patterns of crop
production in Andhra Pradesh.
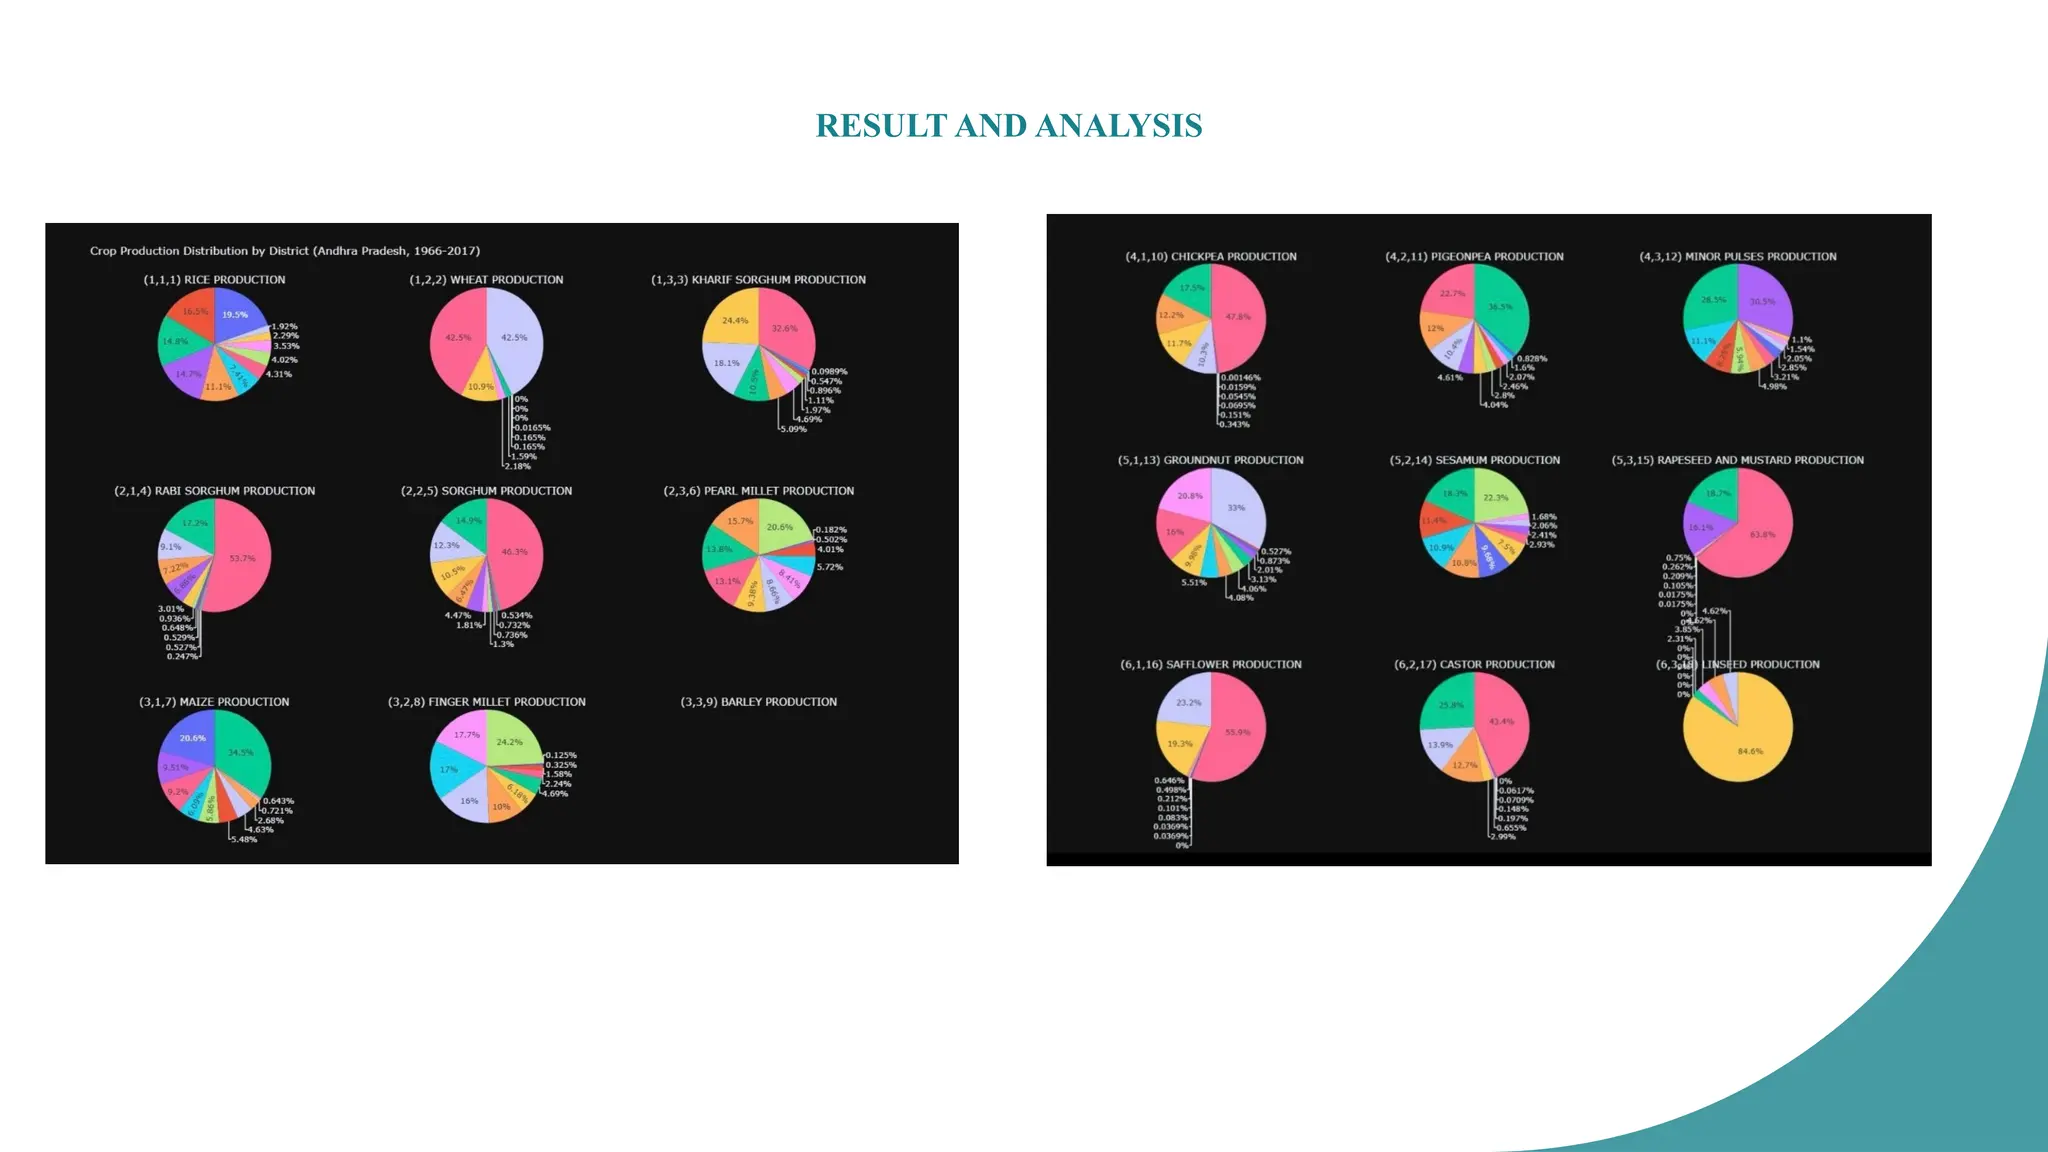
The analysisof crop production in Andhra Pradesh (1966–2017) highlights regional variations in
agricultural output. Rice and maize are the dominant crops, with specific districts contributing
significantly.
Wheat production is minimal due to climatic constraints. Millets, sorghum, and pulses show
diverse distribution, while oilseeds like castor and linseed are concentrated in select regions.
These findings help identify major crop-producing districts, aiding in policy-making, resource
allocation, and agricultural planning.
Understanding production trends supports sustainable farming and economic growth, enabling
data-driven decisions for irrigation, yield improvement, and regional crop specialization in
Andhra Pradesh’s agricultural sector.
9.
CONCLUSION
• This project'sanalysis of district-level crop production data from 1966 to 2017 has revealed
valuable insights into Andhra Pradesh's agricultural landscape. Rice, wheat, sorghum, and
maize emerged as dominant crops, with distinct regional variations in their production
distribution.
• Districts like East Godavari and West Godavari were identified as major rice producers, while
Guntur and Prakasam were prominent in Maize production, highlighting regional
specialization.
• The analysis also revealed potential trends in crop production over time, emphasizing the need
for data-driven planning and targeted interventions to optimize agricultural practices and
resource allocation.
• This study contributes to a better understanding of crop production dynamics in Andhra
Pradesh, providing valuable information for stakeholders in the agricultural sector to promote
sustainable development and enhance food security in the region.
10.
FUTURE WORK
Buildingupon the insights gained from this analysis, several avenues for future research
emerge. A deeper investigation into the factors influencing crop production trends is crucial,
including exploring the impact of climate change, government policies, technological
advancements, and market dynamics.
Expanding the analysis to incorporate data on soil health, water availability, and pest and
disease prevalence would provide a more comprehensive understanding of the agricultural
landscape.
Developing predictive models for crop yields, incorporating these additional factors, could aid
in proactive planning and risk mitigation for farmers and policymakers.
Further research could also delve into the socio-economic aspects of crop production,
exploring the impact on farmer livelihoods, food security, and rural development in Andhra
Pradesh.
11.
Rain Fall Predictionusing Machine Learning
INTRODUCTION
Predicting rainfall is crucial for efficient water resource management, enabling farmers and
policymakers to plan irrigation, mitigate drought effects, and enhance agricultural productivity.
Machine learning provides powerful tools to analyze complex meteorological factors and their
impact on rainfall patterns.
This project aims to develop and compare different machine learning models to accurately
predict rainfall using relevant environmental and weather data.
12.
OBJECTIVES
To preprocessand prepare meteorological data for machine learning analysis.
To implement and train the following machine learning models:
o Logistic Regression
o K-Nearest Neighbors (KNN) Classifier
o Decision Tree Classifier
o Random Forest Classifier
o Support Vector Classifier (SVC)
To evaluate the performance of each model using appropriate metrics.
To compare the results and identify the most suitable model for rainfall prediction.
13.
PROBLEM STATEMENT
Theproblem addressed by this project is the need for accurate and reliable prediction of
rainfall based on various meteorological and environmental factors.
Traditional methods of forecasting rainfall can be complex, time-consuming, and may not fully
capture the intricate interactions between different climatic variables.
Machine learning models offer the potential to automate and enhance the accuracy of these
predictions, leading to improved water resource management, better agricultural planning, and
more effective disaster preparedness.
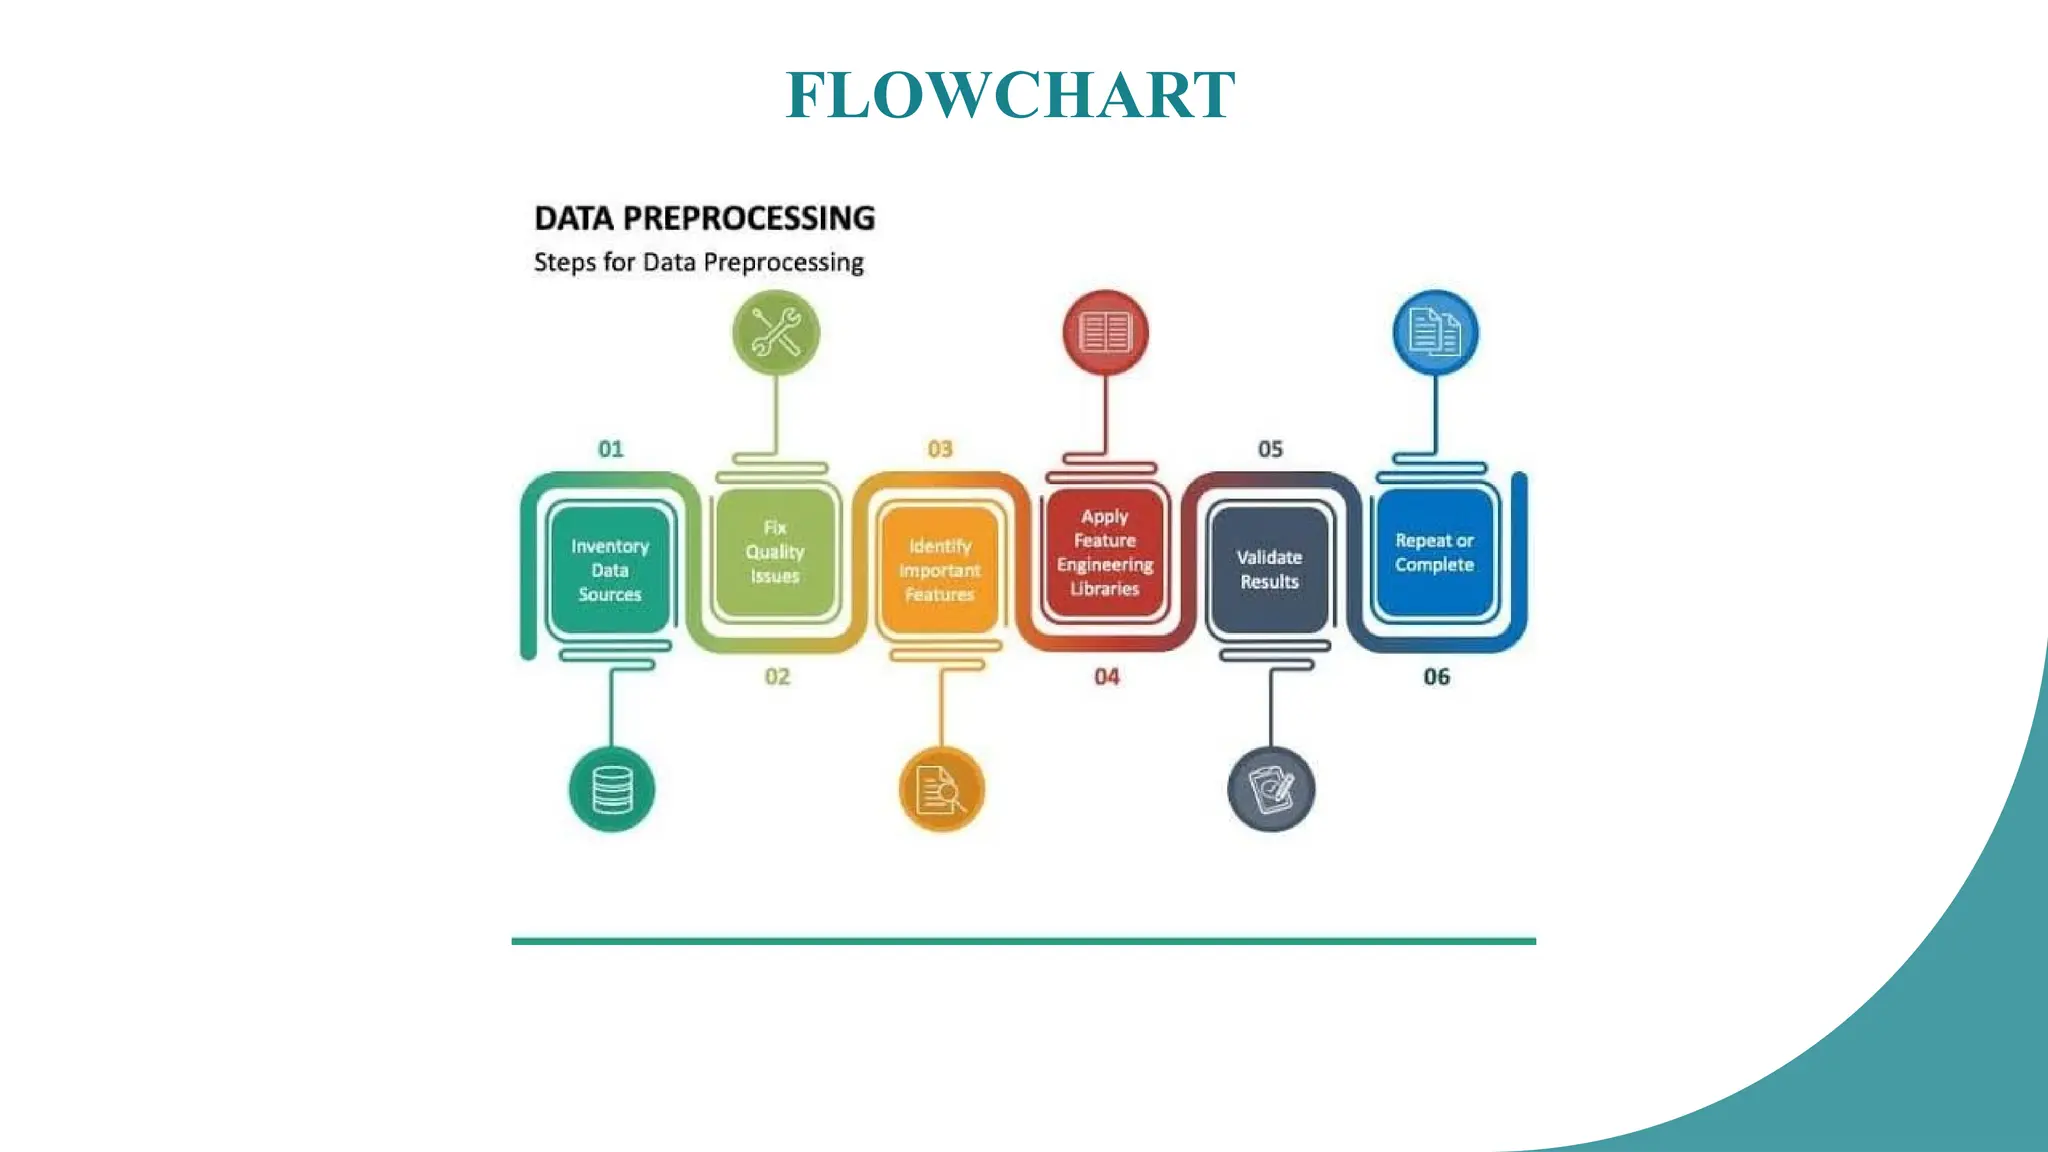
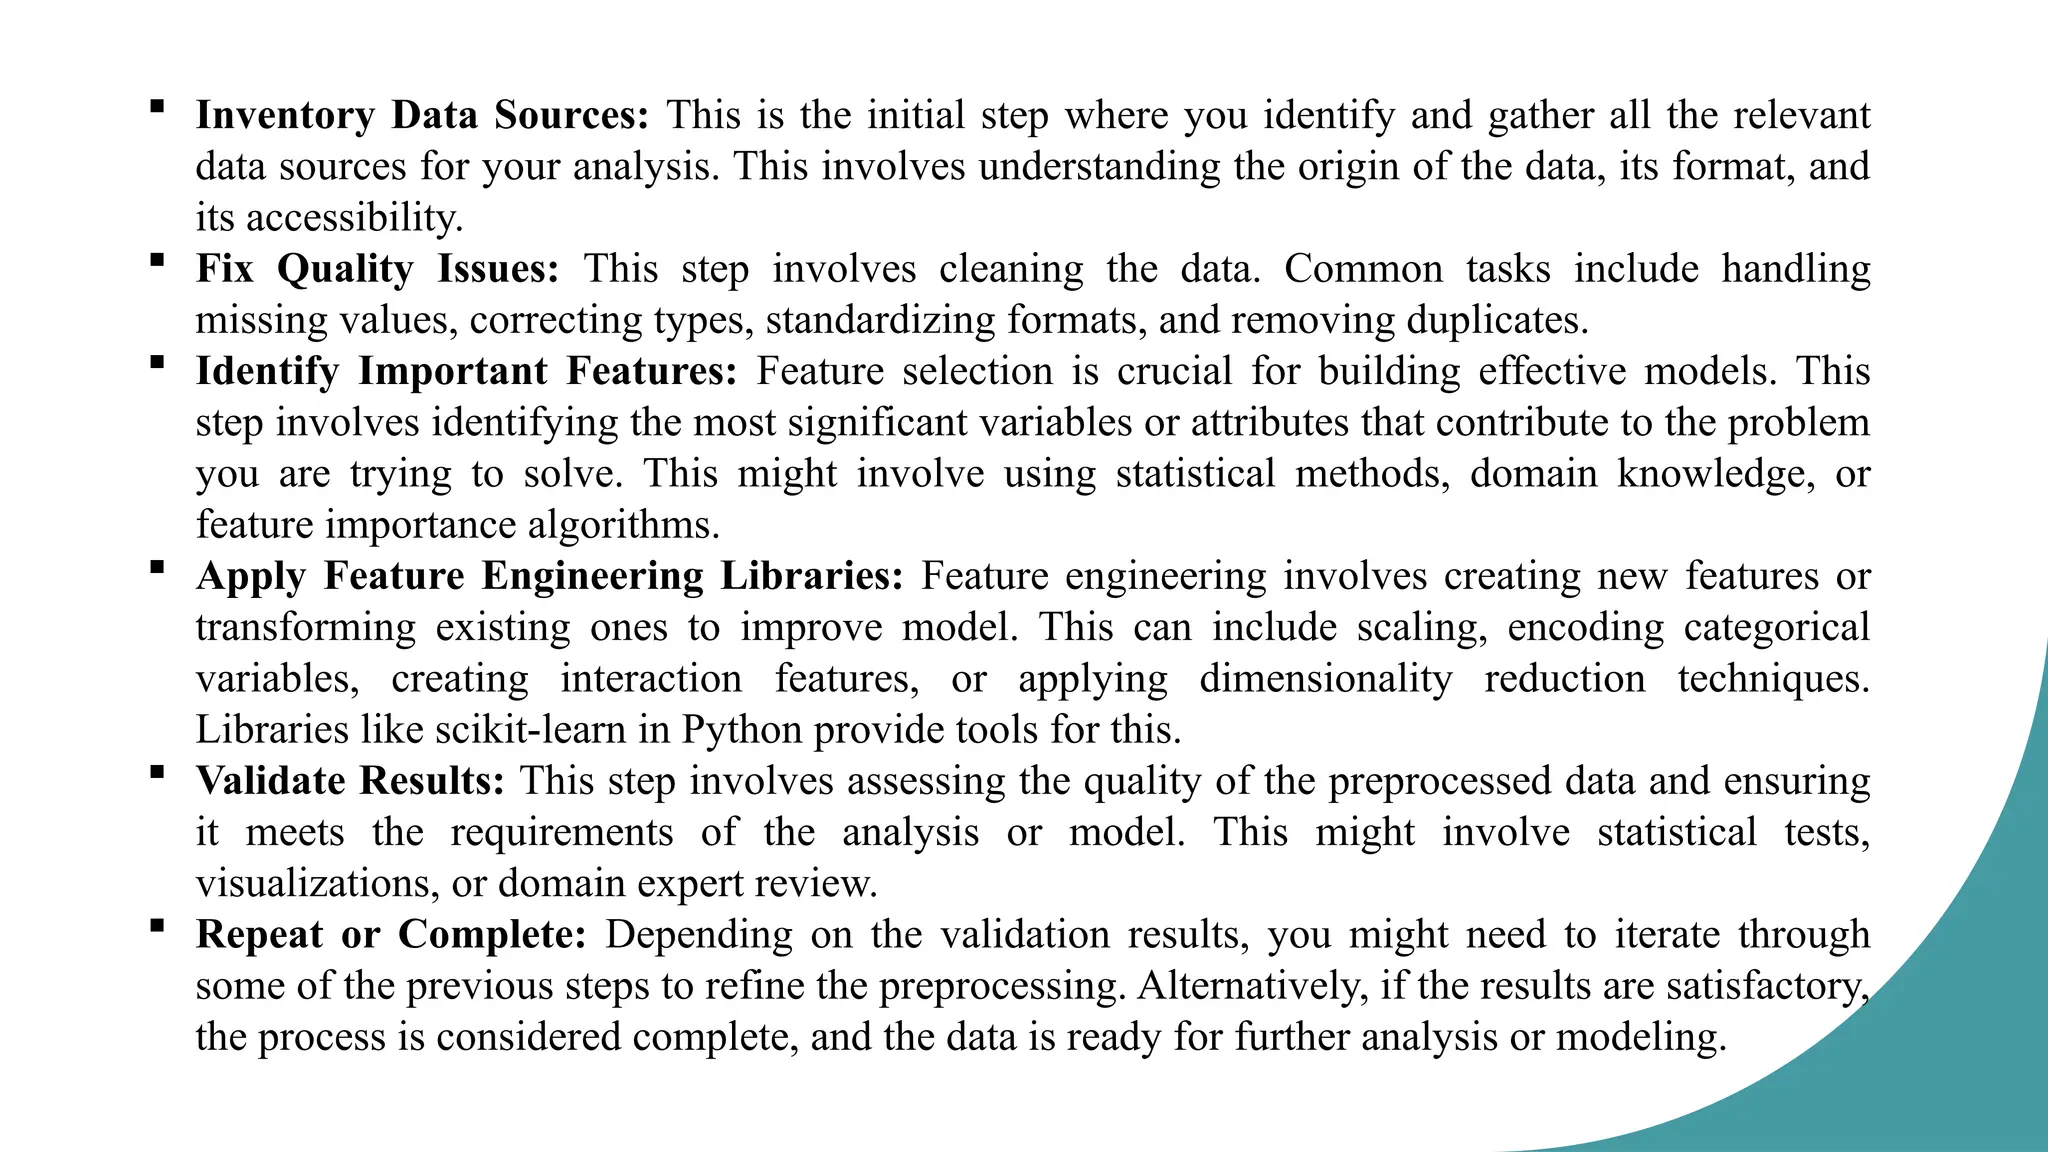
Inventory DataSources: This is the initial step where you identify and gather all the relevant
data sources for your analysis. This involves understanding the origin of the data, its format, and
its accessibility.
Fix Quality Issues: This step involves cleaning the data. Common tasks include handling
missing values, correcting types, standardizing formats, and removing duplicates.
Identify Important Features: Feature selection is crucial for building effective models. This
step involves identifying the most significant variables or attributes that contribute to the problem
you are trying to solve. This might involve using statistical methods, domain knowledge, or
feature importance algorithms.
Apply Feature Engineering Libraries: Feature engineering involves creating new features or
transforming existing ones to improve model. This can include scaling, encoding categorical
variables, creating interaction features, or applying dimensionality reduction techniques.
Libraries like scikit-learn in Python provide tools for this.
Validate Results: This step involves assessing the quality of the preprocessed data and ensuring
it meets the requirements of the analysis or model. This might involve statistical tests,
visualizations, or domain expert review.
Repeat or Complete: Depending on the validation results, you might need to iterate through
some of the previous steps to refine the preprocessing. Alternatively, if the results are satisfactory,
the process is considered complete, and the data is ready for further analysis or modeling.
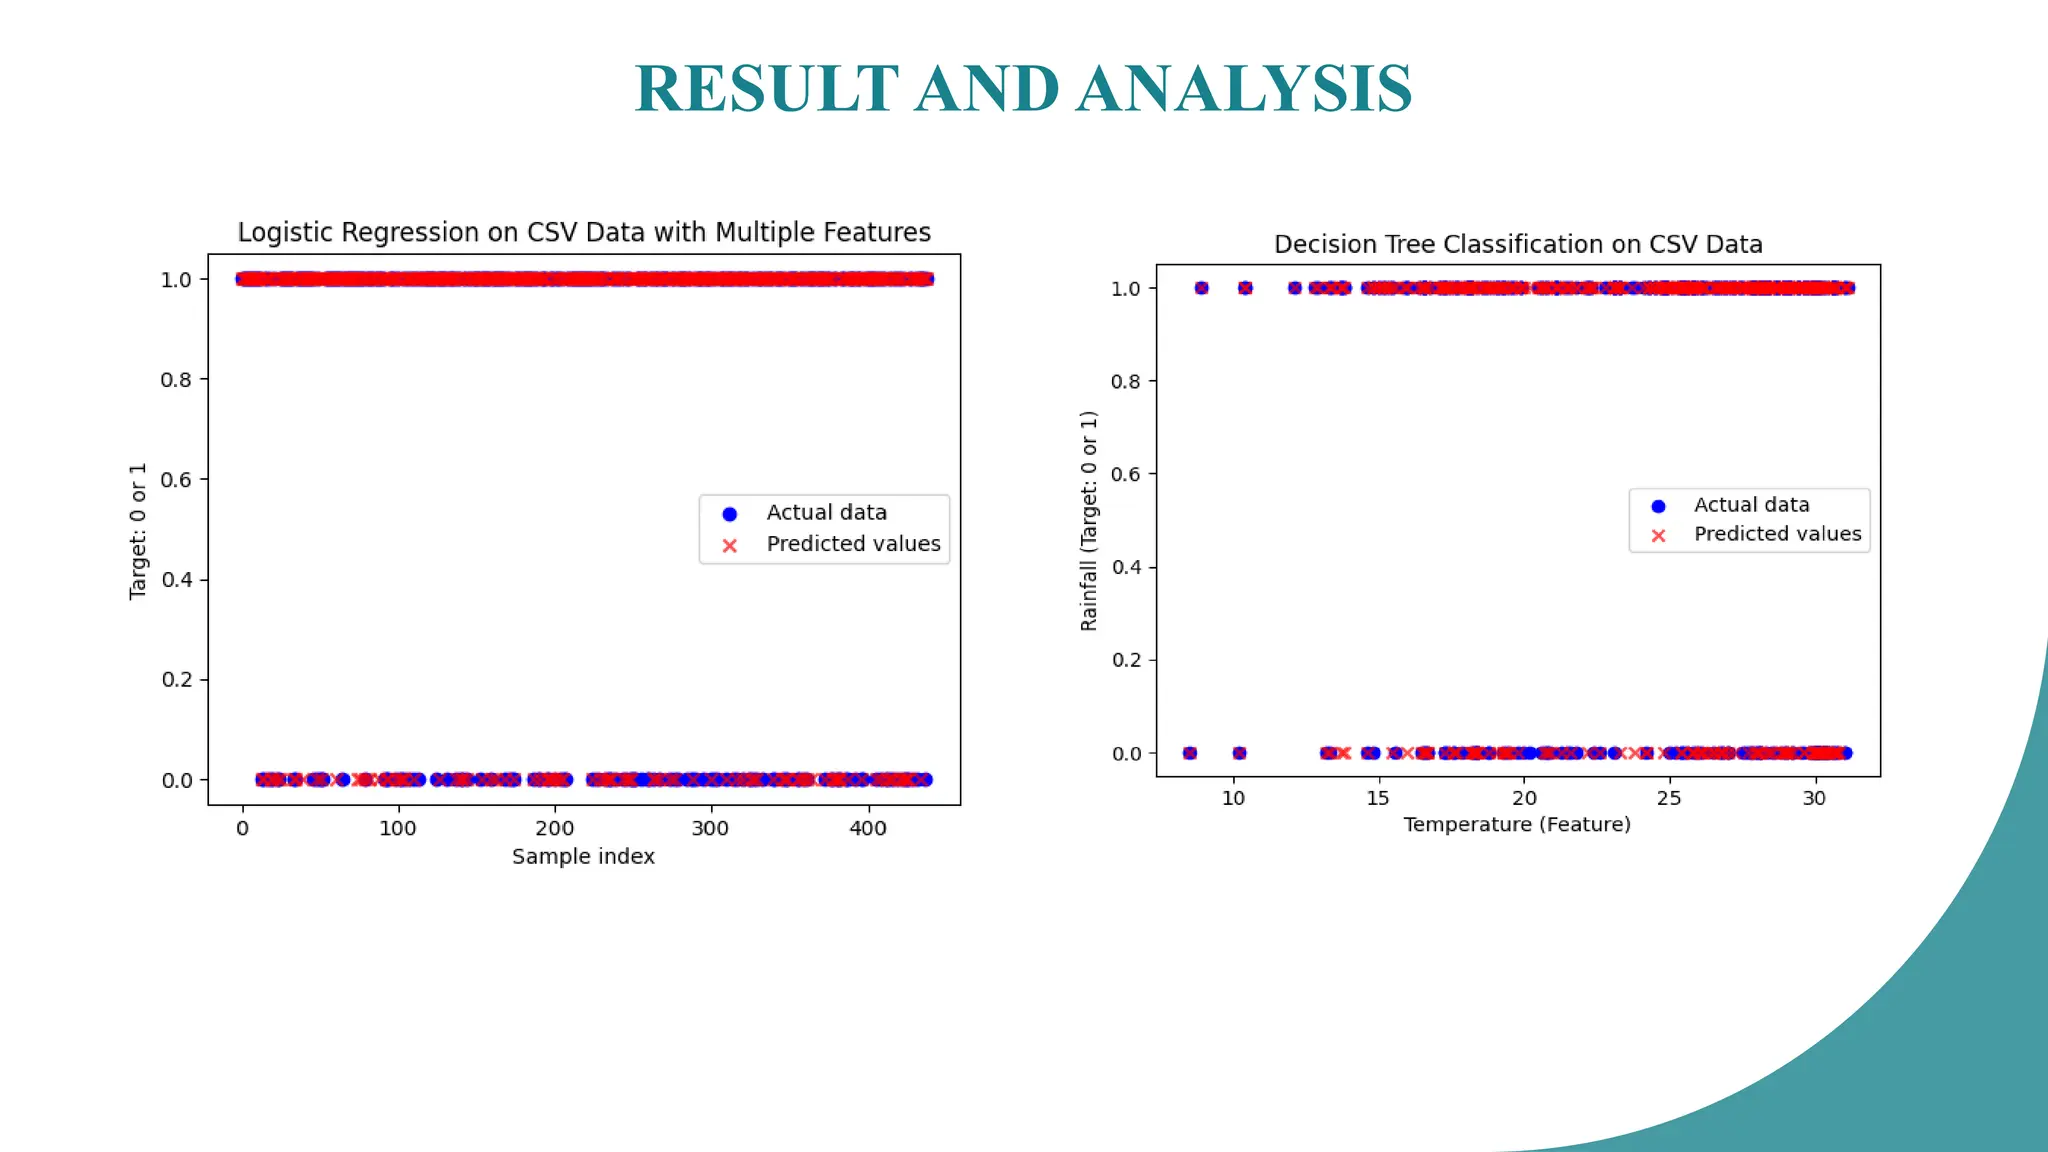
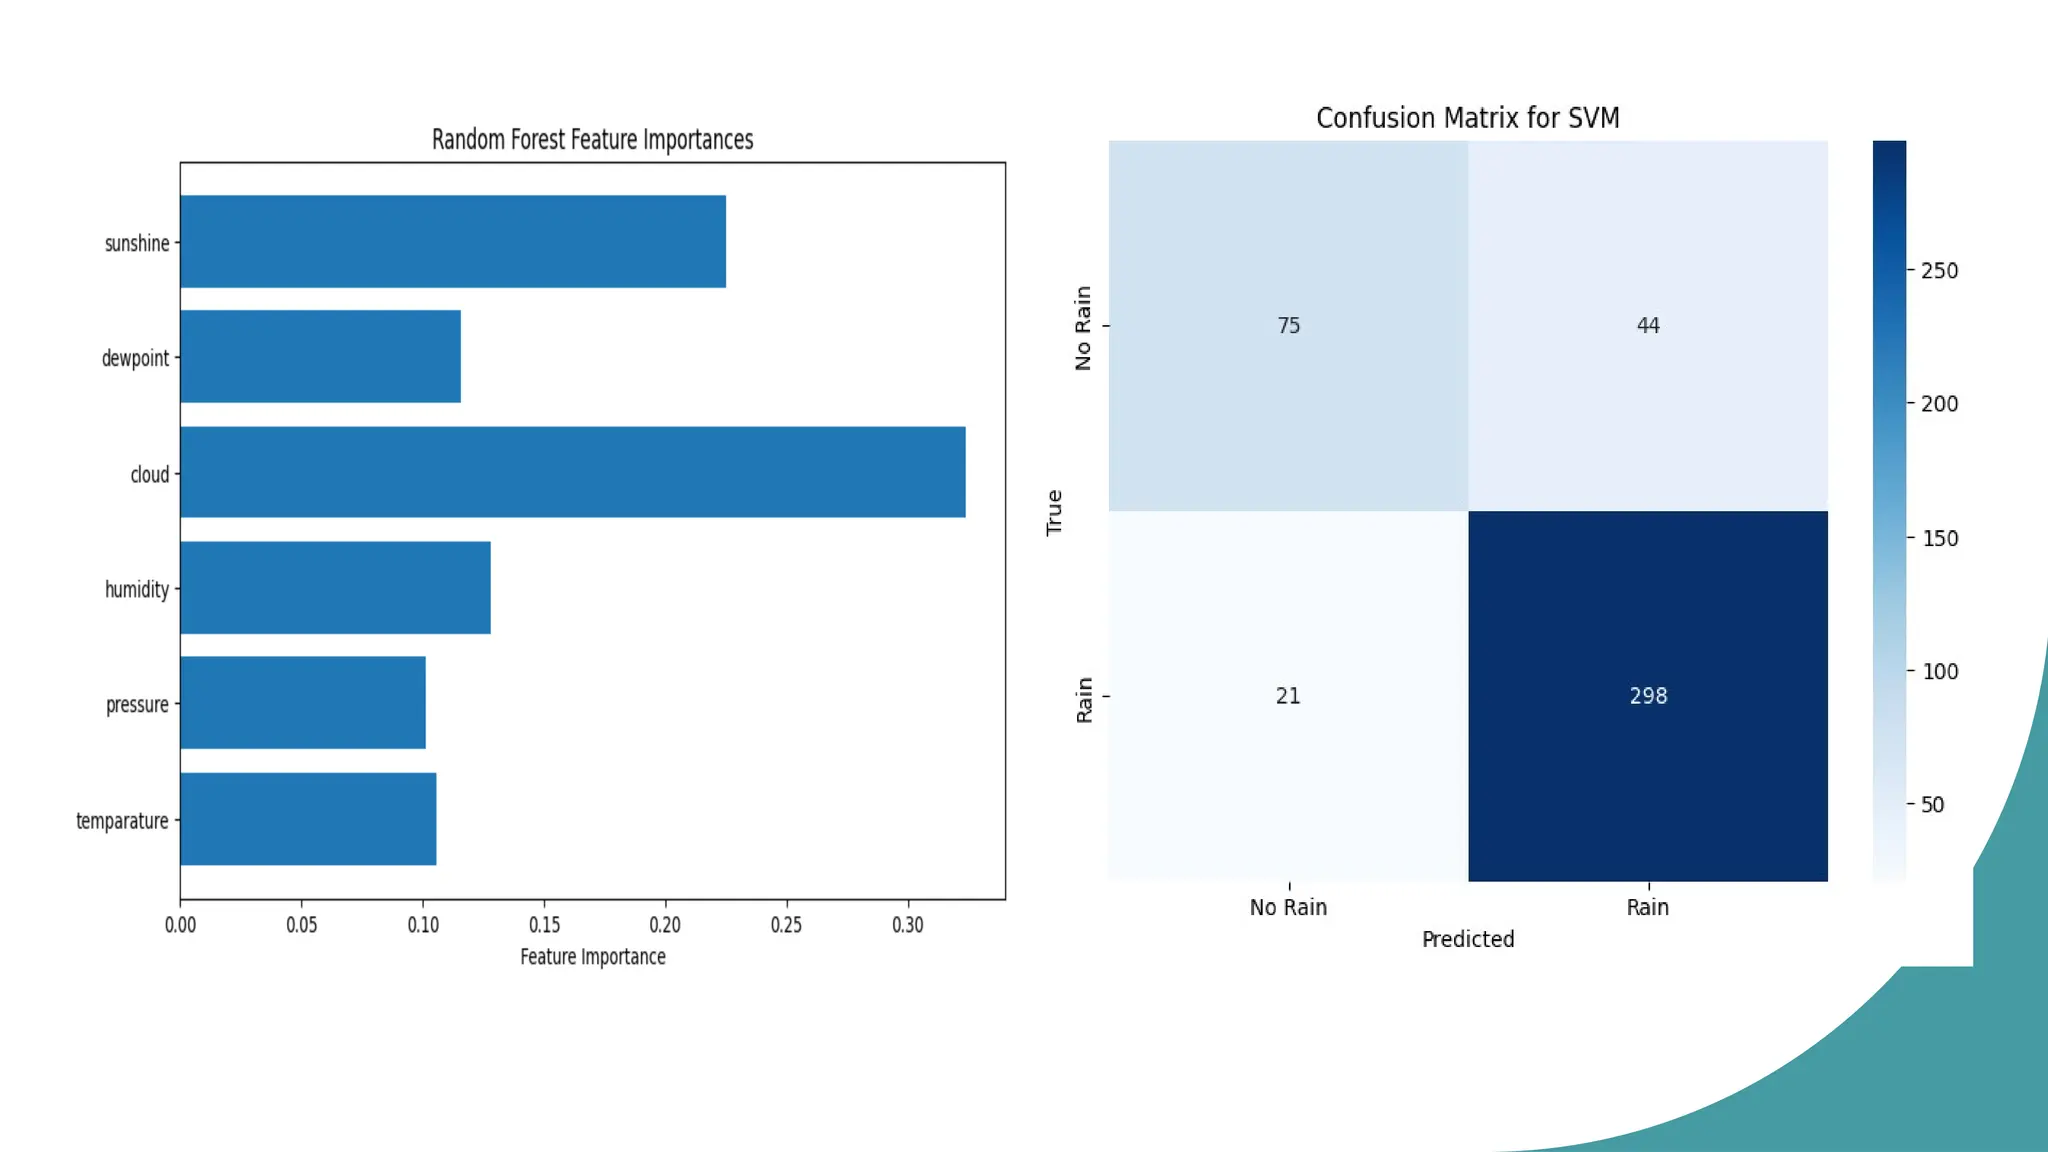
CONCLUSION
The project successfullyimplemented and evaluated several machine learning models for
predicting rain fall milestones. The results indicate that different models have varying degrees of
accuracy in predicting rain fall.
Logistic Regression provided a baseline for predicting 'Rainfall'
The K-Nearest Neighbors Classifier achieved an accuracy of 84%.
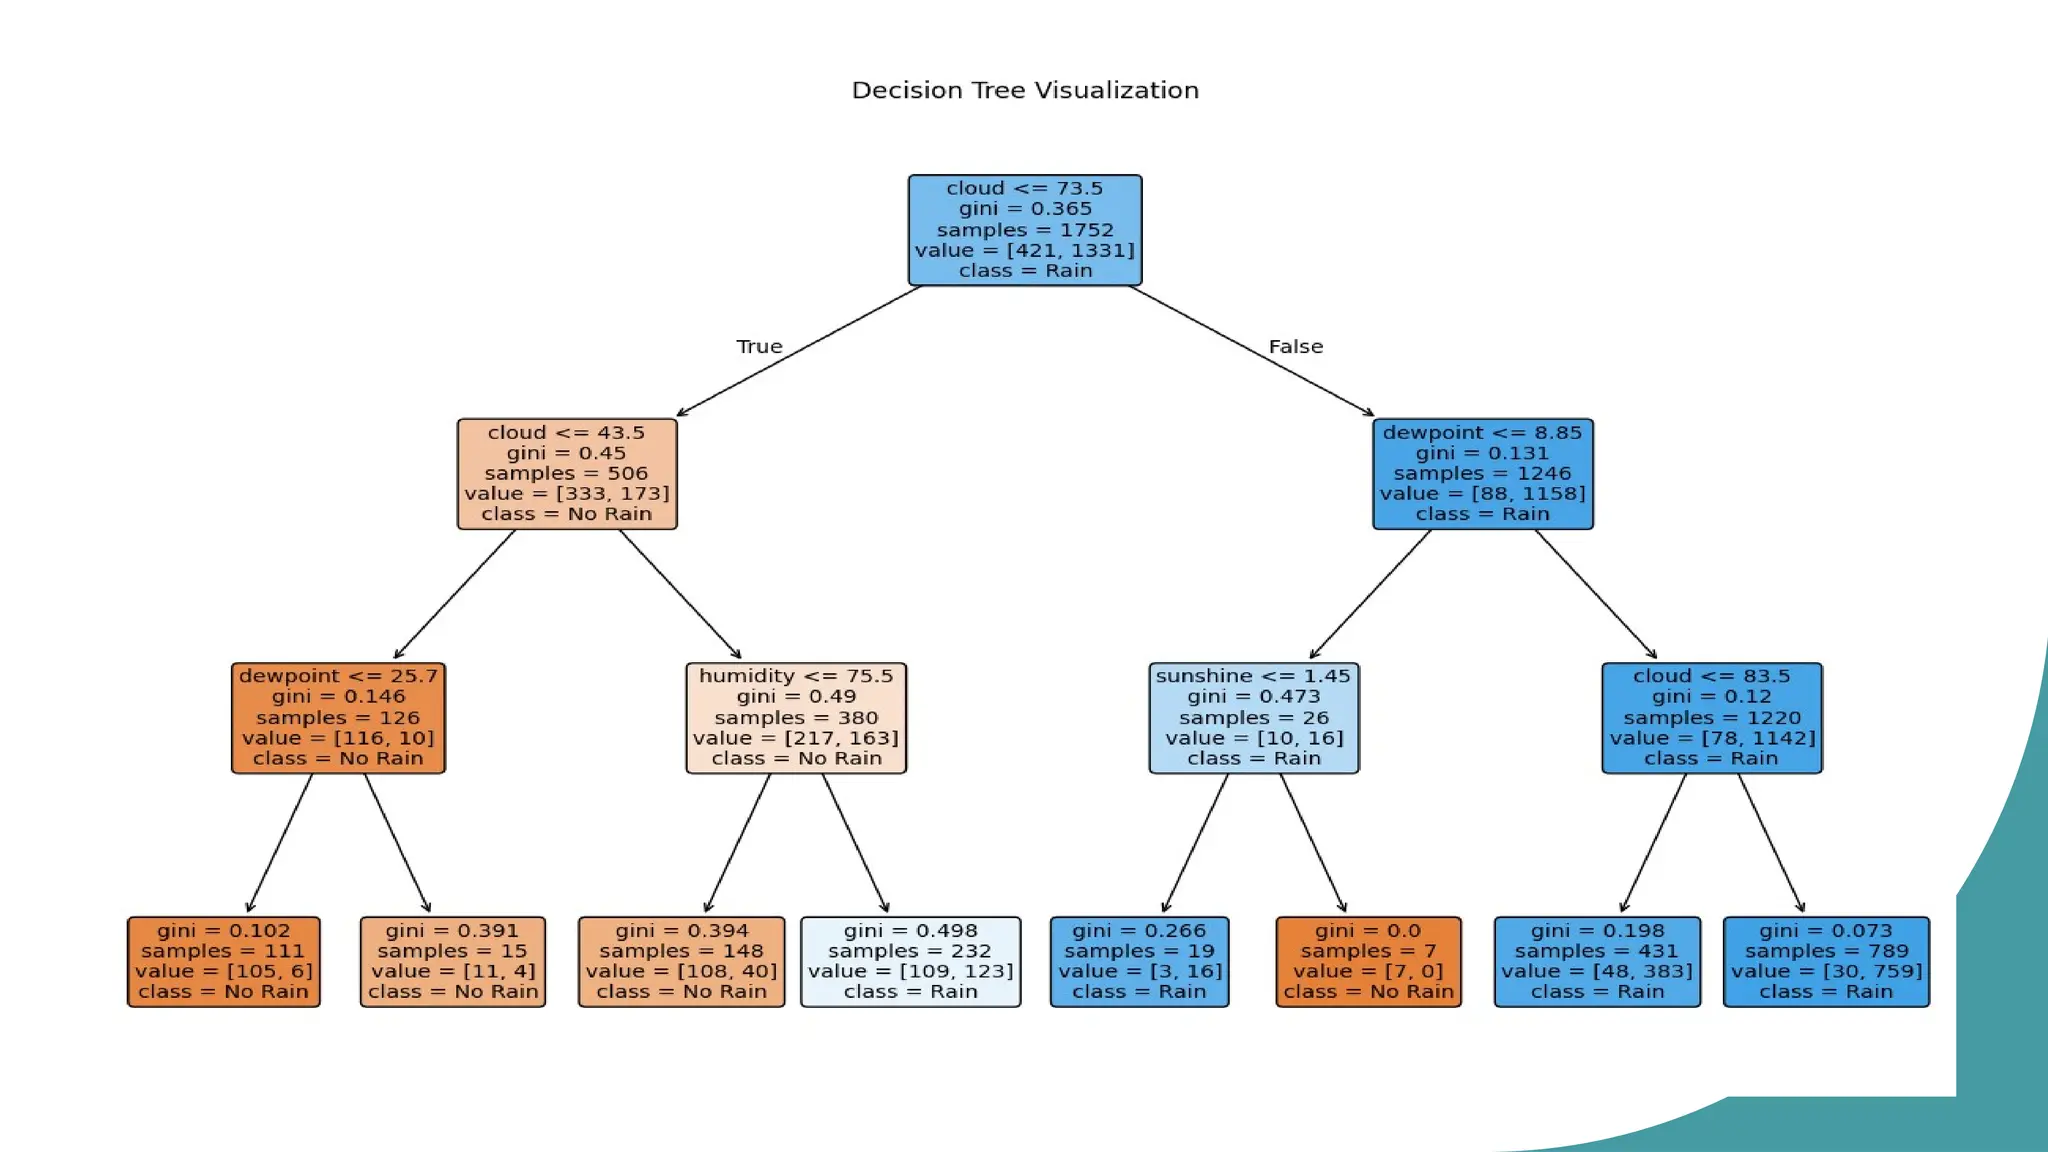
The Decision Tree Classifier's accuracy was also calculated.
The Random Forest Classifier demonstrated a certain level of accuracy, and feature
importance was analyzed.
The Support Vector Classifier achieved an accuracy of 85%.
Further analysis and optimization may improve the performance of these models. Overall, the
project demonstrates the potential of machine learning to provide valuable insights into rain fall
patterns.
20.
FUTURE WORK
Expandingthe dataset: Incorporating more data points and additional relevant features
(e.g., Pressure, Dewpoint, Cloud, Sun Shine, temperature, and humidity) to improve
model generalization.
Hyper parameter optimization: Fine-tuning the hyperparameters of each model to
achieve optimal performance.
Advanced models: Exploring more advanced machine learning models, such as gradient
boosting algorithms or neural networks, to potentially improve prediction accuracy.
Real-time prediction: Developing a system for real-time Rain fall monitoring and
prediction using sensor data.
Deployment: Creating a user-friendly application or interface for farmers to easily
access and utilize the prediction results.


![[DSC Europe 25] Jon Dajci - Bridging TradFi and DeFi: Building the Future of ...](https://cdn.slidesharecdn.com/ss_thumbnails/fqmhfvlbqhkihjvqvhmu-7-251211083849-6af7e325-thumbnail.jpg?width=640&height=640&fit=bounds)


![[DSC Europe 25] Vladimir Jelic - The AI-Driven Security Shift From Reactive D...](https://cdn.slidesharecdn.com/ss_thumbnails/6g5gj25mtjwayniqem1t-6-251209104645-7a5a5fc6-thumbnail.jpg?width=640&height=640&fit=bounds)
![[DSC Europe 25] Ivan Peric - Intelligence Swarm Logic and Techno-Functional M...](https://cdn.slidesharecdn.com/ss_thumbnails/7my7c97fsduiccadgavw-2-251212103249-5a03f7c6-thumbnail.jpg?width=640&height=640&fit=bounds)
![[DSC Europe 25] Behzad Hosseini - AI Agents in the Wild: Deploying Models tha...](https://cdn.slidesharecdn.com/ss_thumbnails/3qtejajvsjqrzwfept2c-10-251212103250-7f2b1068-thumbnail.jpg?width=640&height=640&fit=bounds)
![[DSC Europe 25] Katherine Forrest - AI NOW: Understanding the Velocity of Cha...](https://cdn.slidesharecdn.com/ss_thumbnails/wvvbruqfrci0sfq9xwgb-4-251212104007-e5ad1987-thumbnail.jpg?width=640&height=640&fit=bounds)


![[DSC Europe 25] Marko Krstic - Understanding the AI Threat Landscape - Risks,...](https://cdn.slidesharecdn.com/ss_thumbnails/tiyim1ins5jvbrvzpzla-2-251209104645-c69d3553-thumbnail.jpg?width=640&height=640&fit=bounds)
![[DSC Europe 25] Milan Sekuloski - Data, Defence, and Development: Cybersecuri...](https://cdn.slidesharecdn.com/ss_thumbnails/dfrkwwx4qly6atqpbl4z-4-251209104645-c3d4b0ca-thumbnail.jpg?width=640&height=640&fit=bounds)


