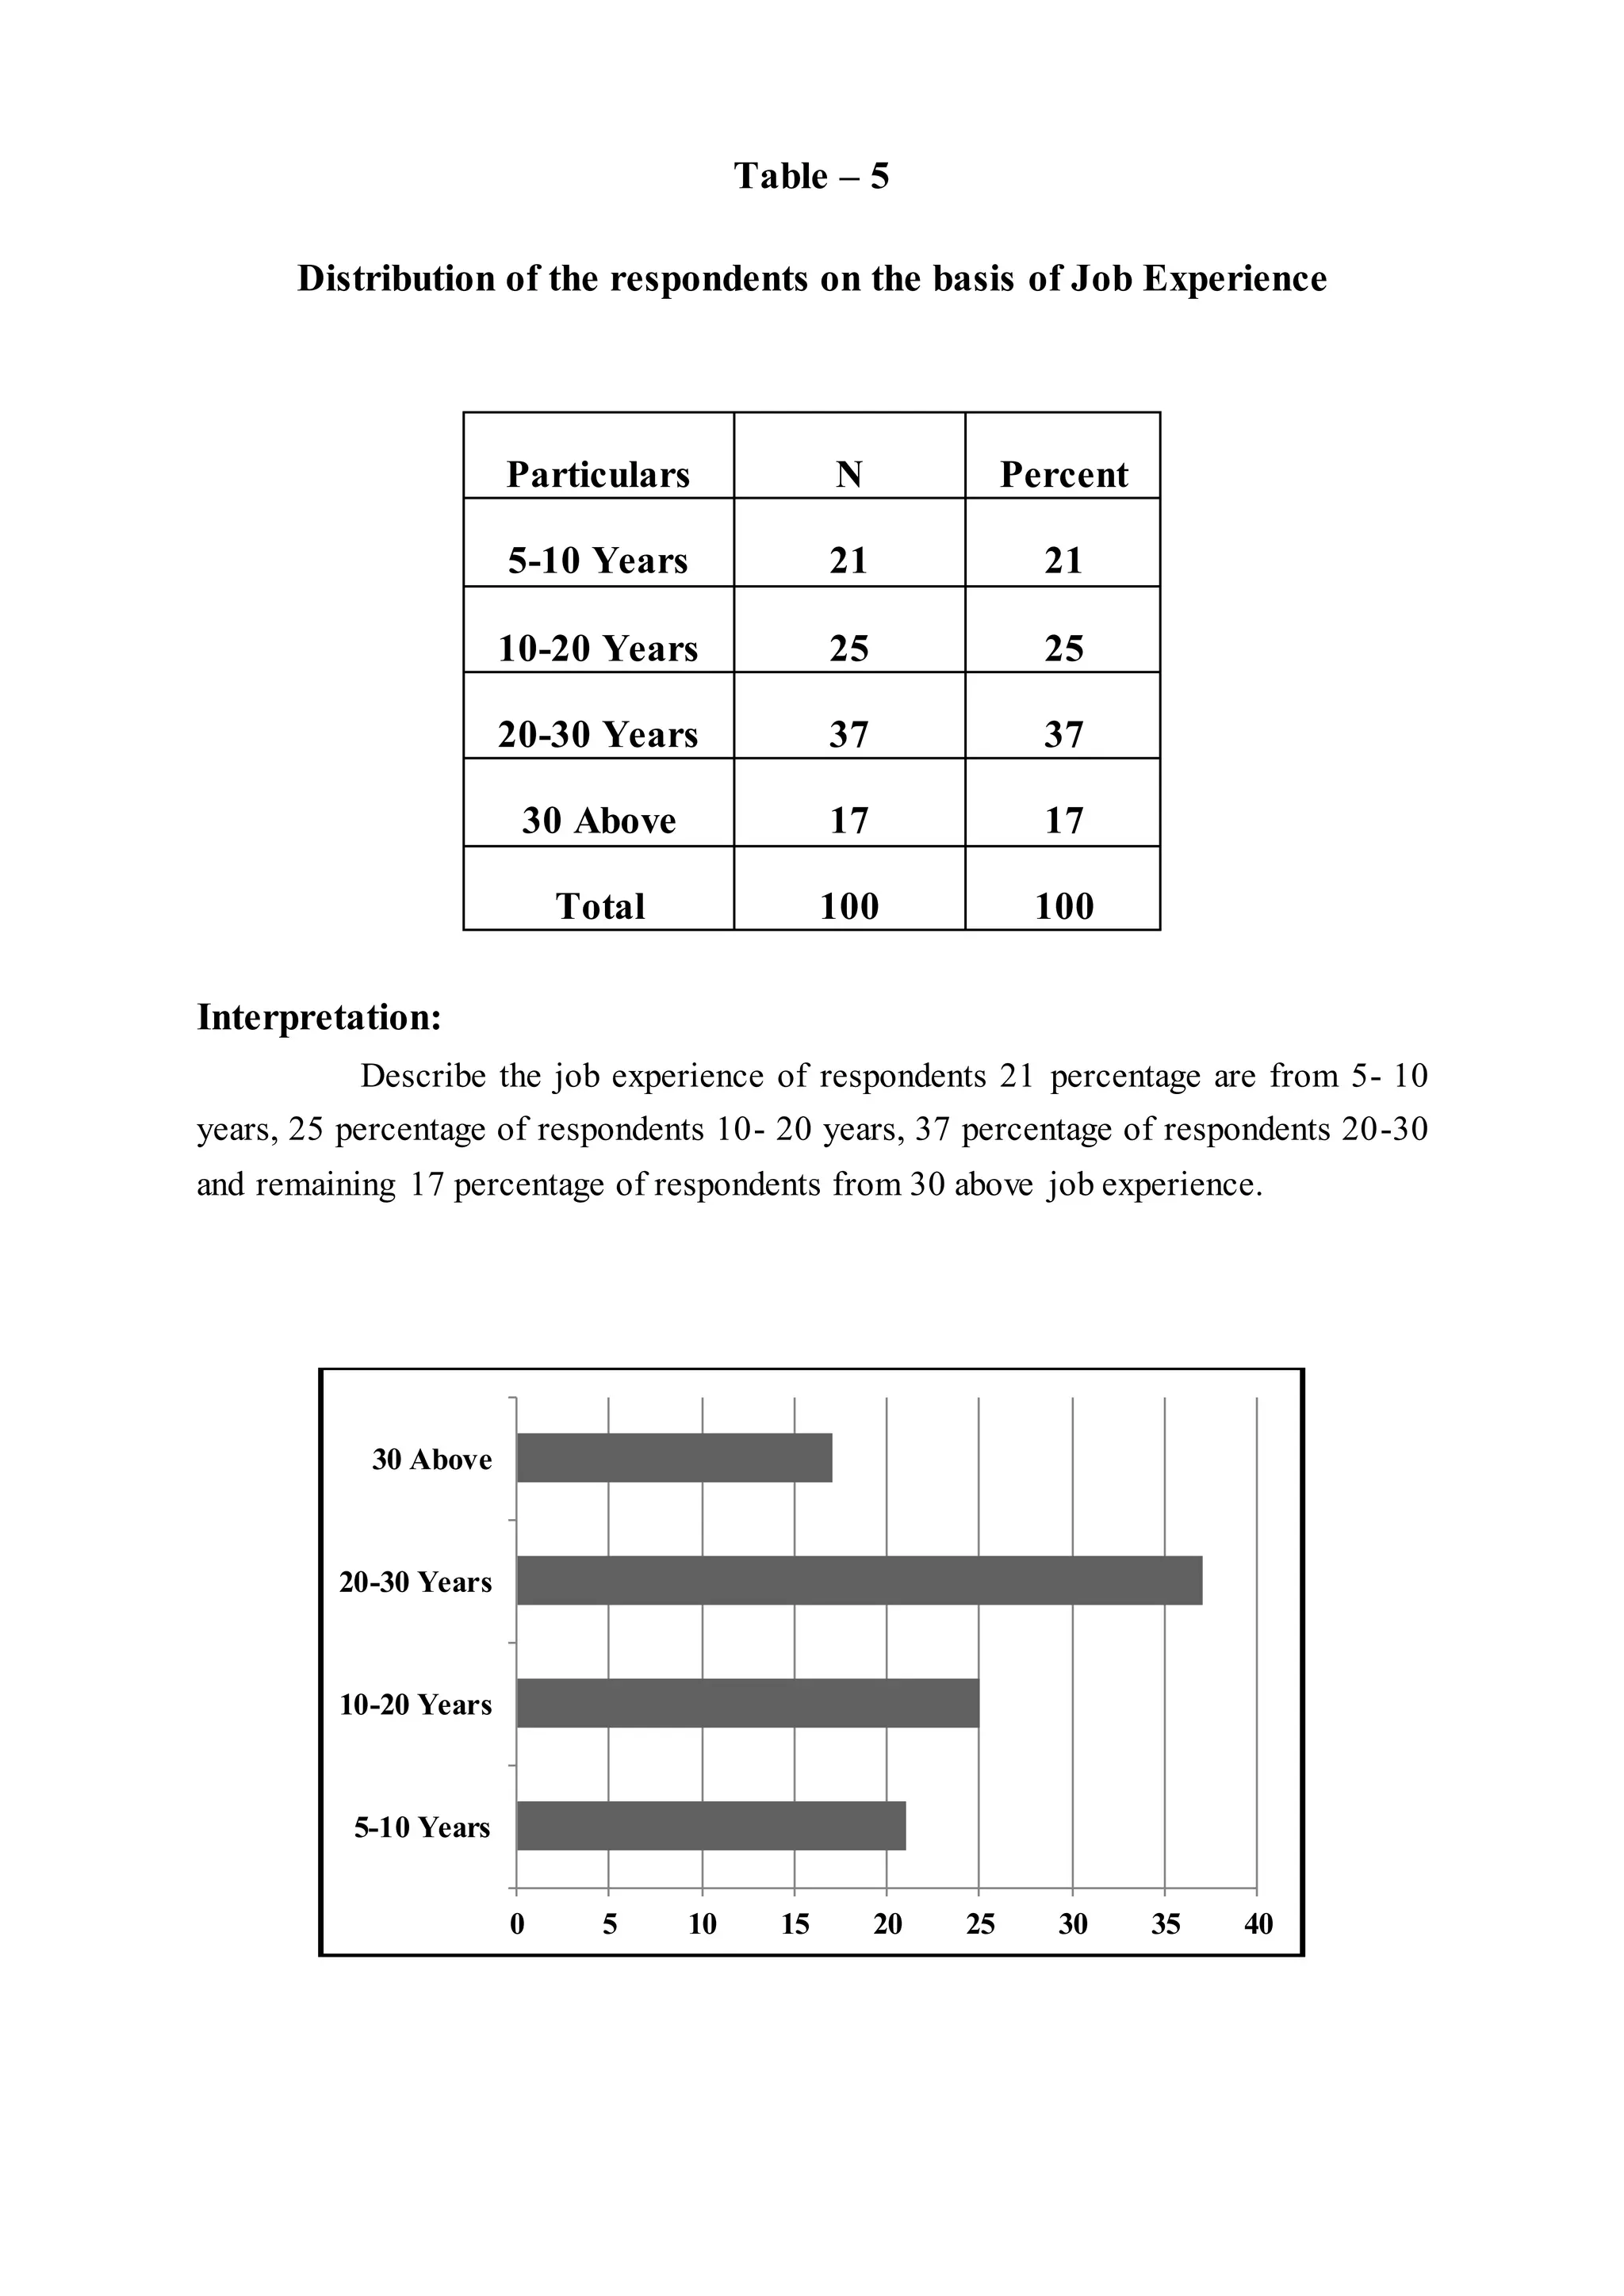
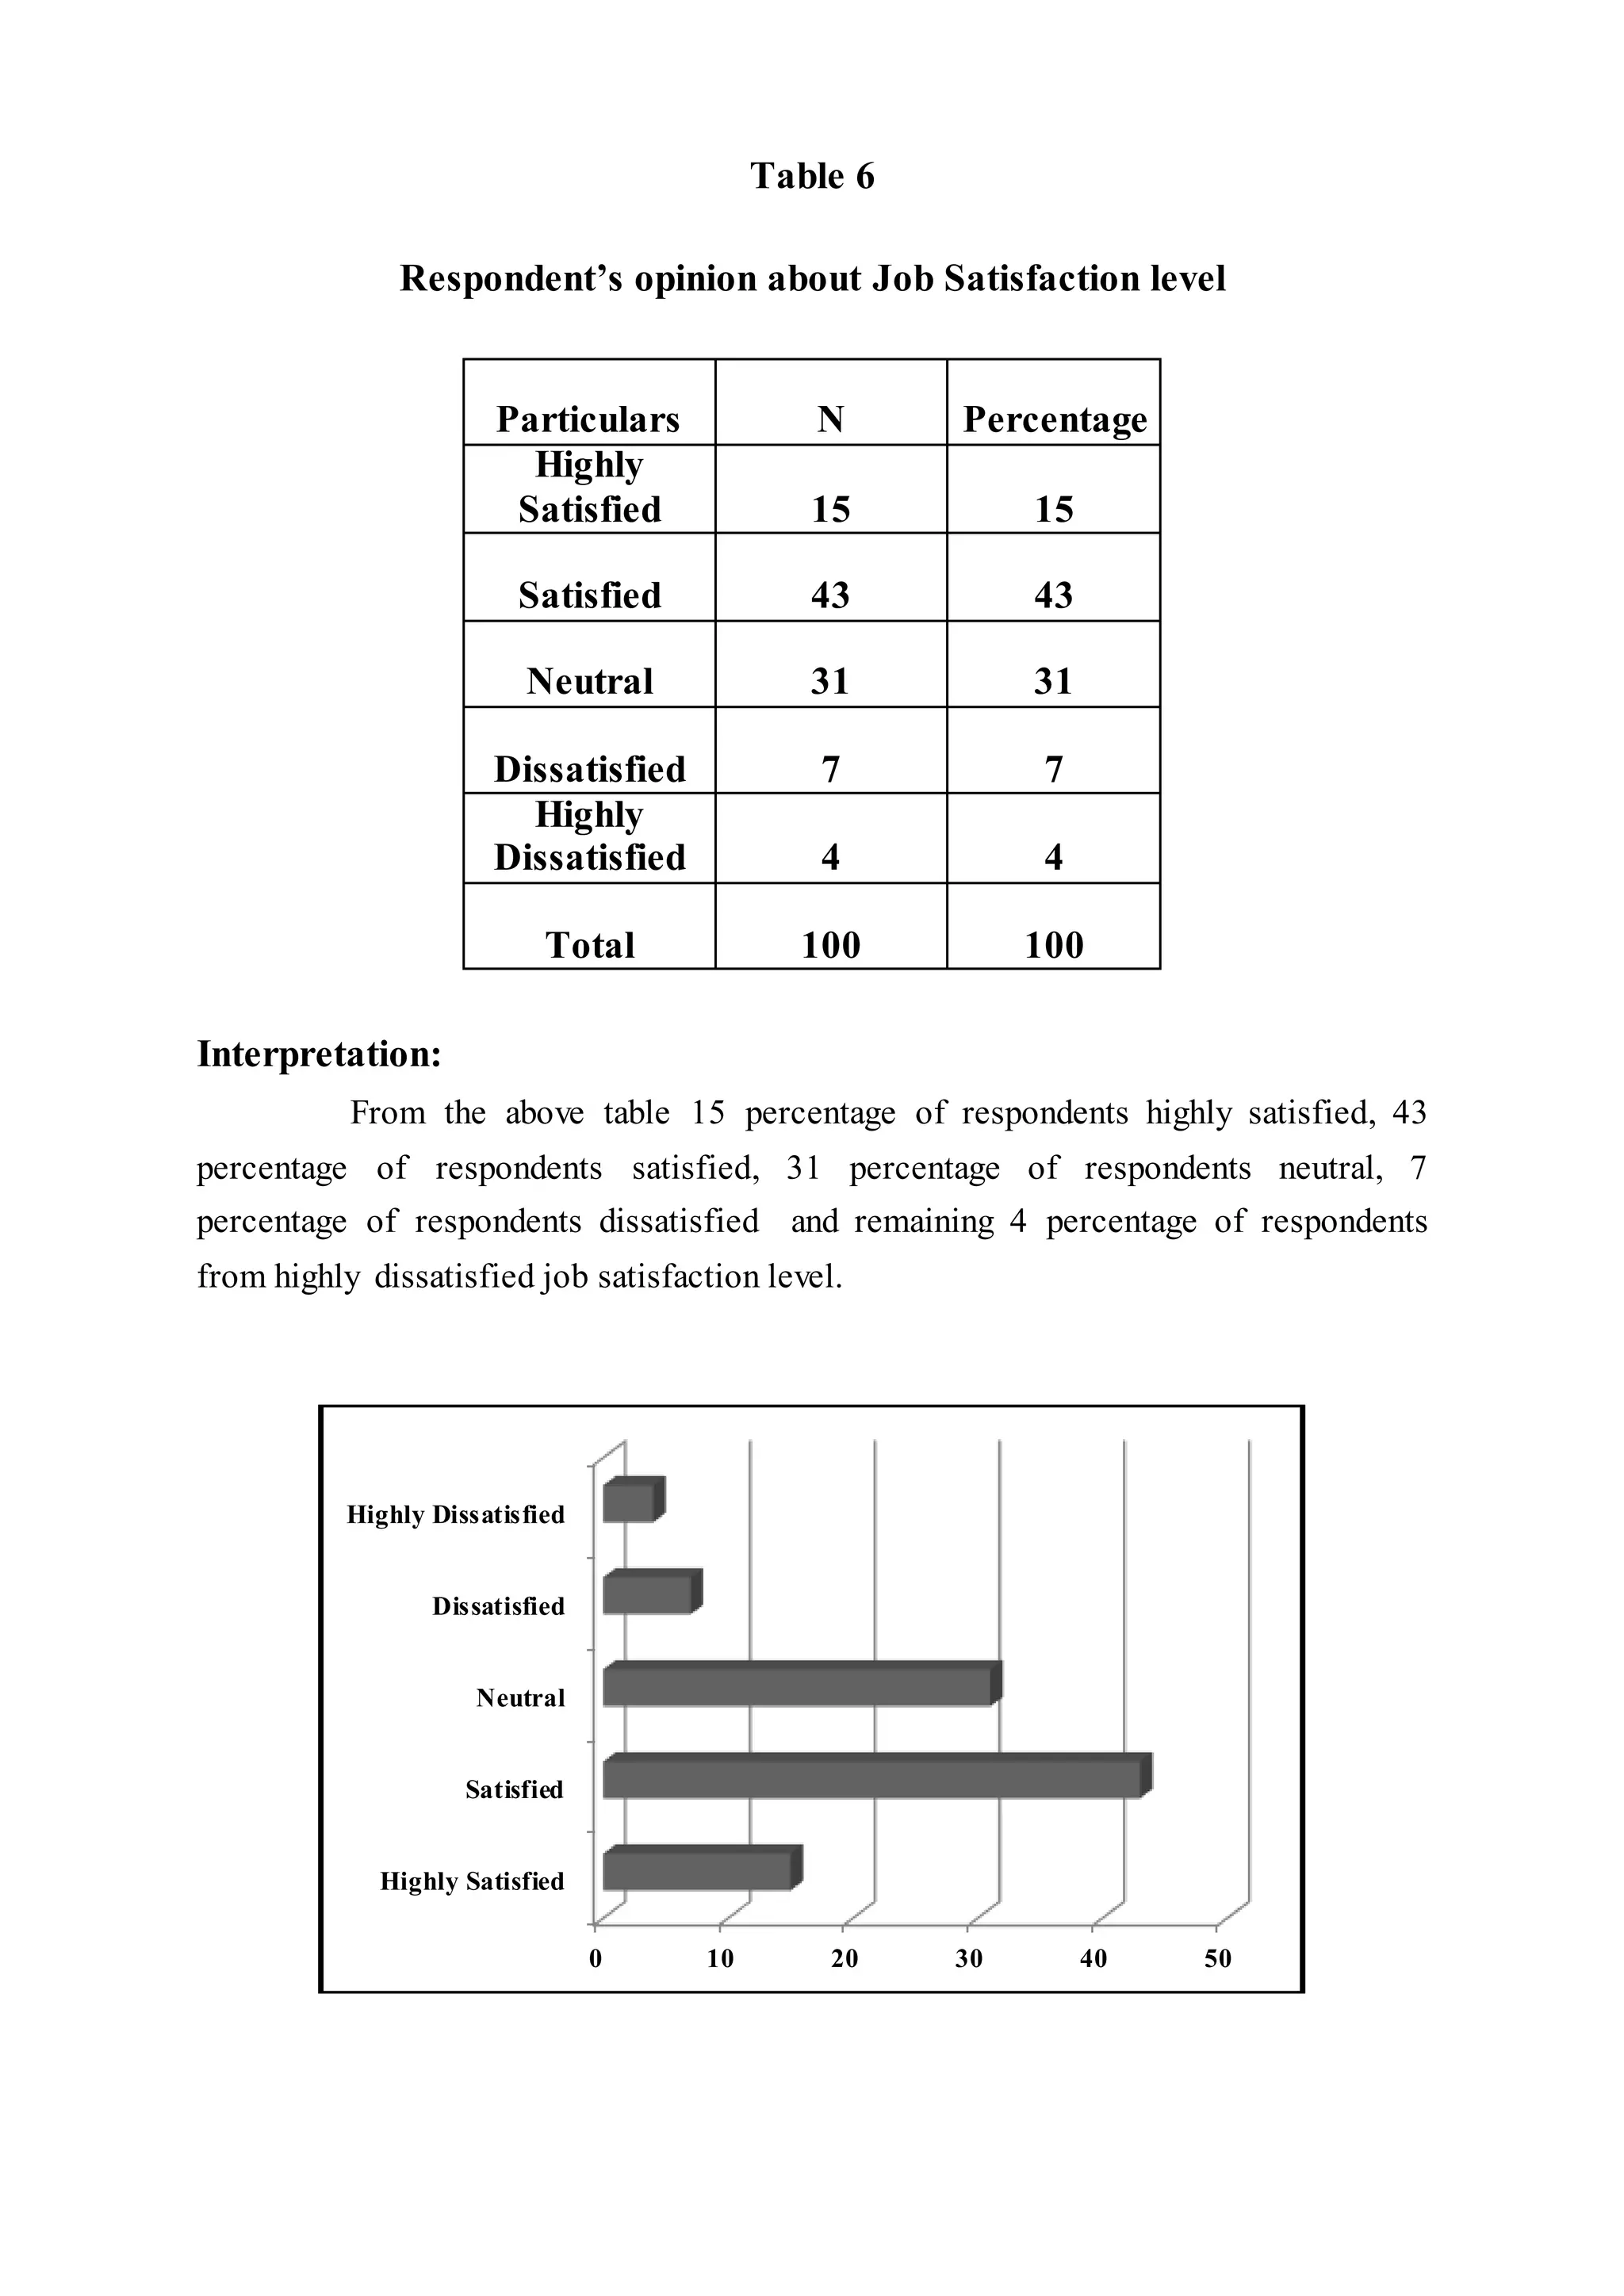
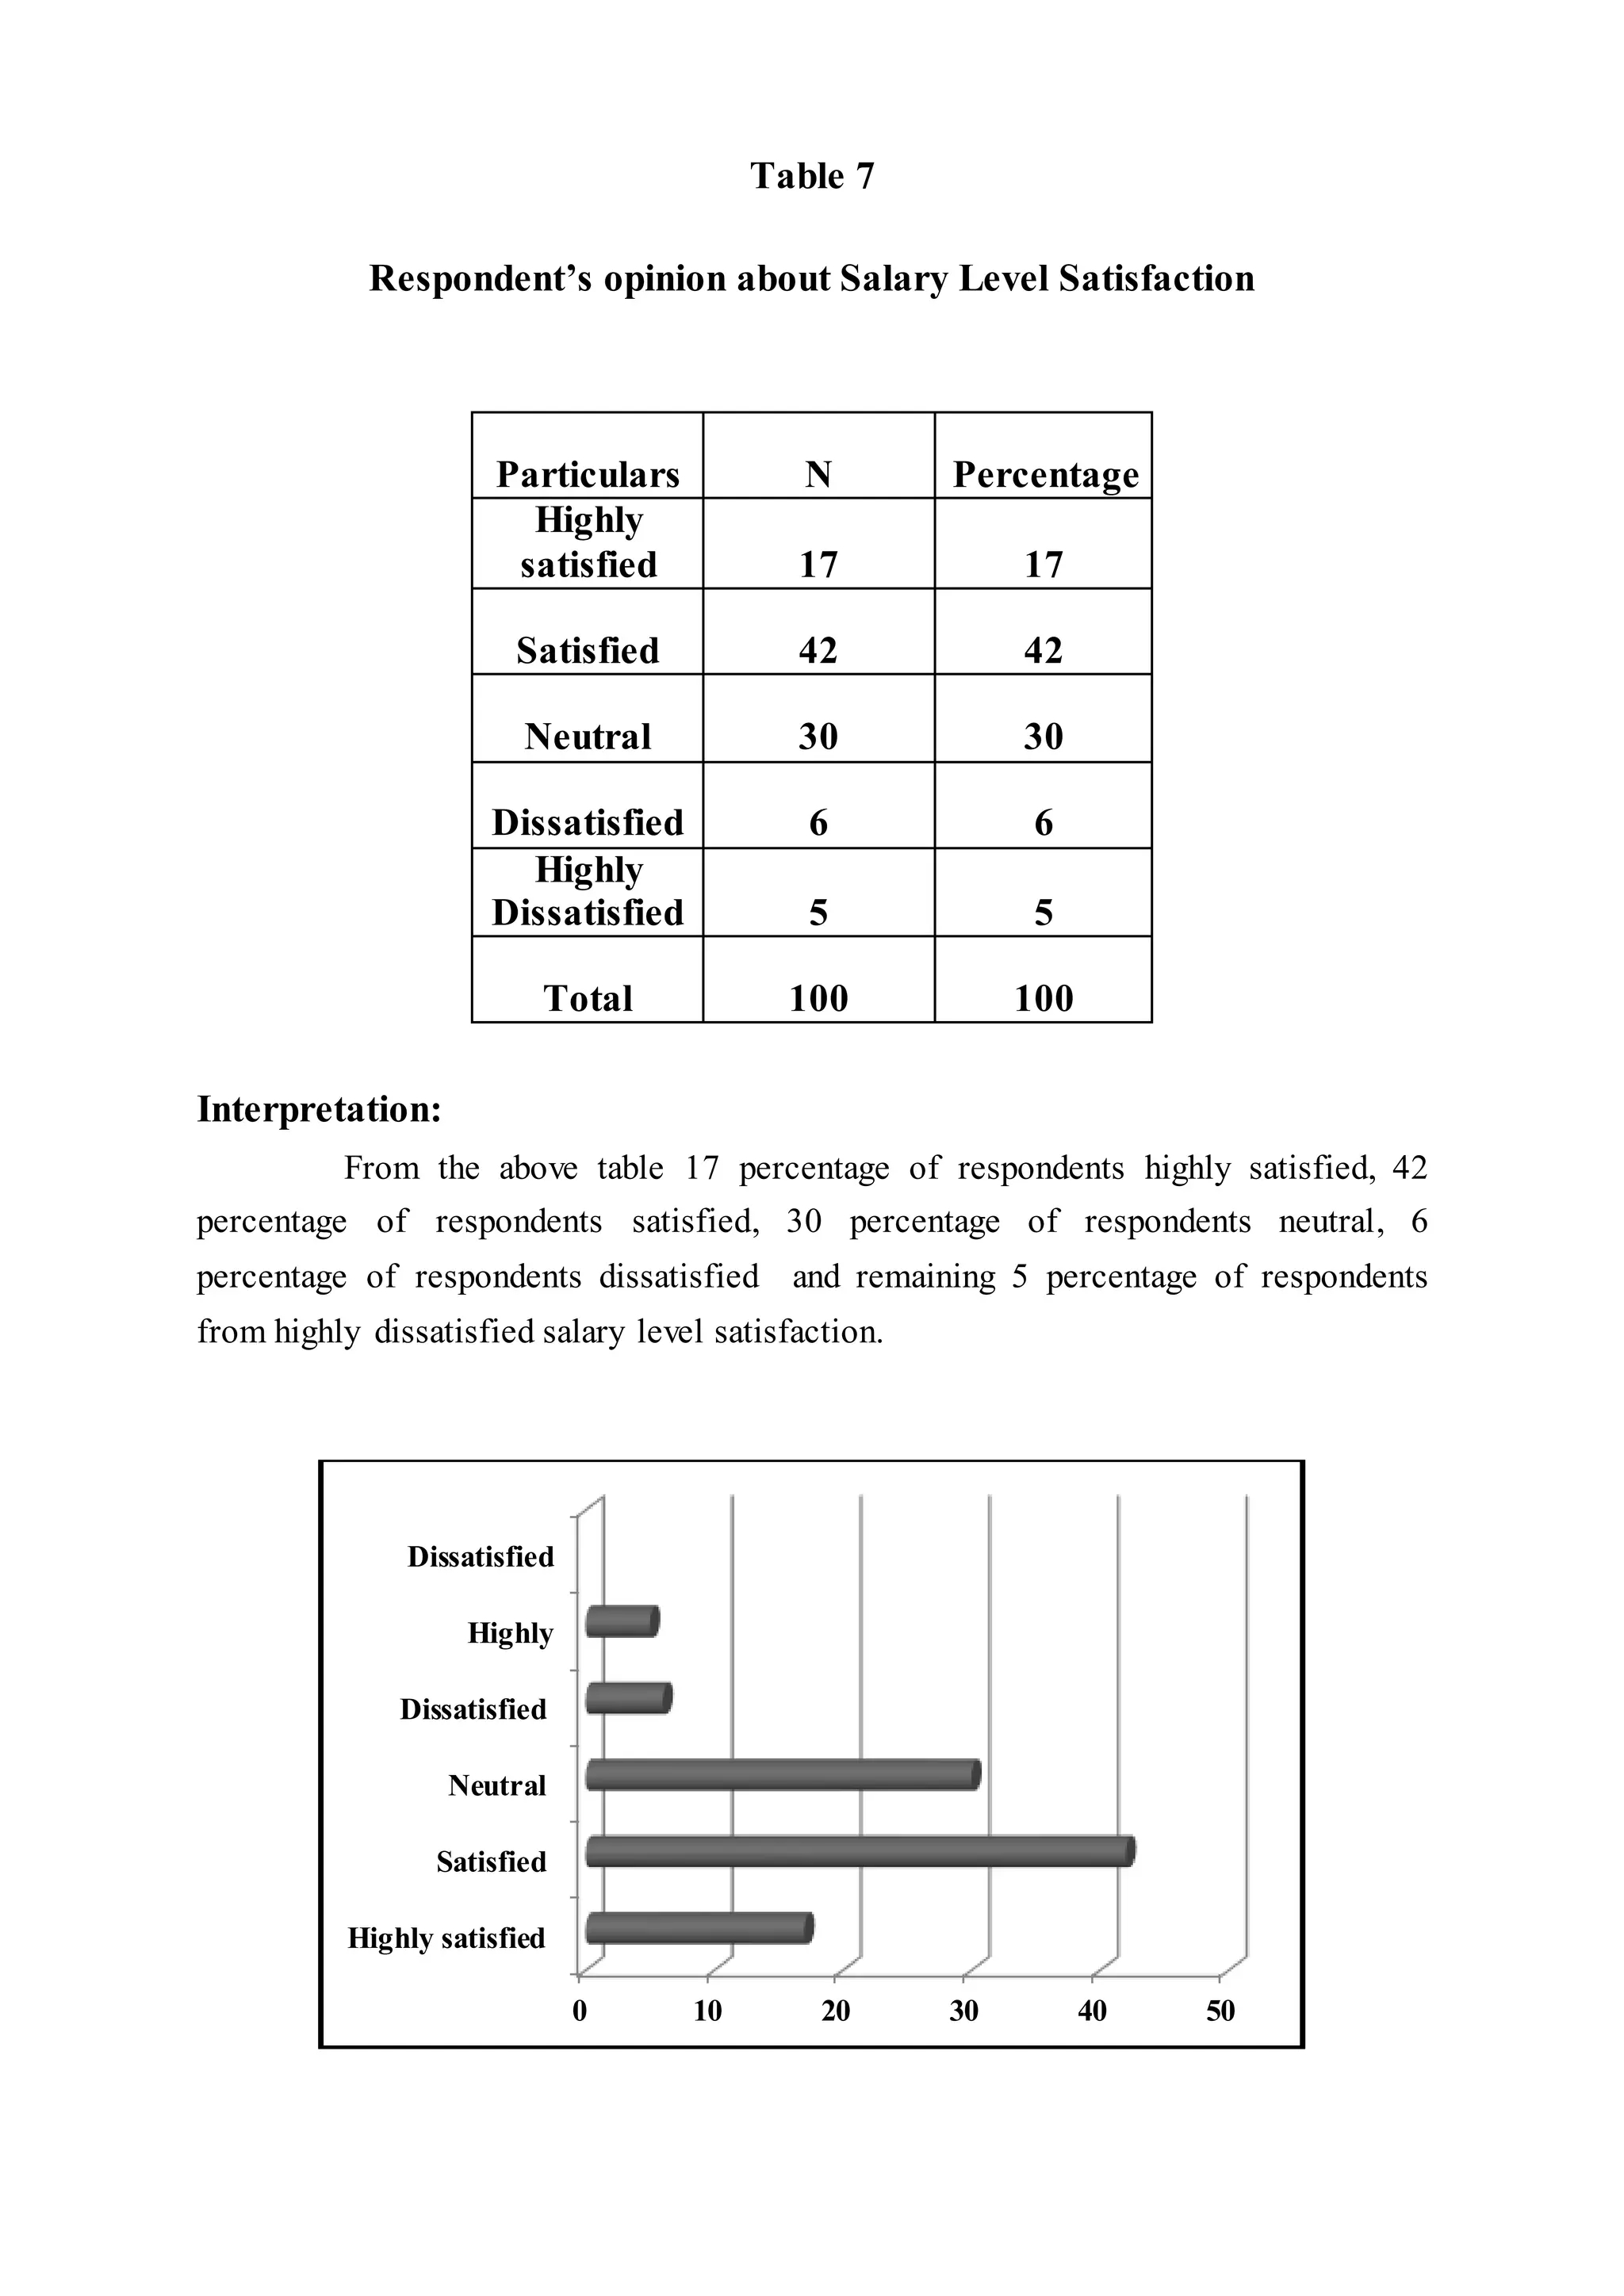
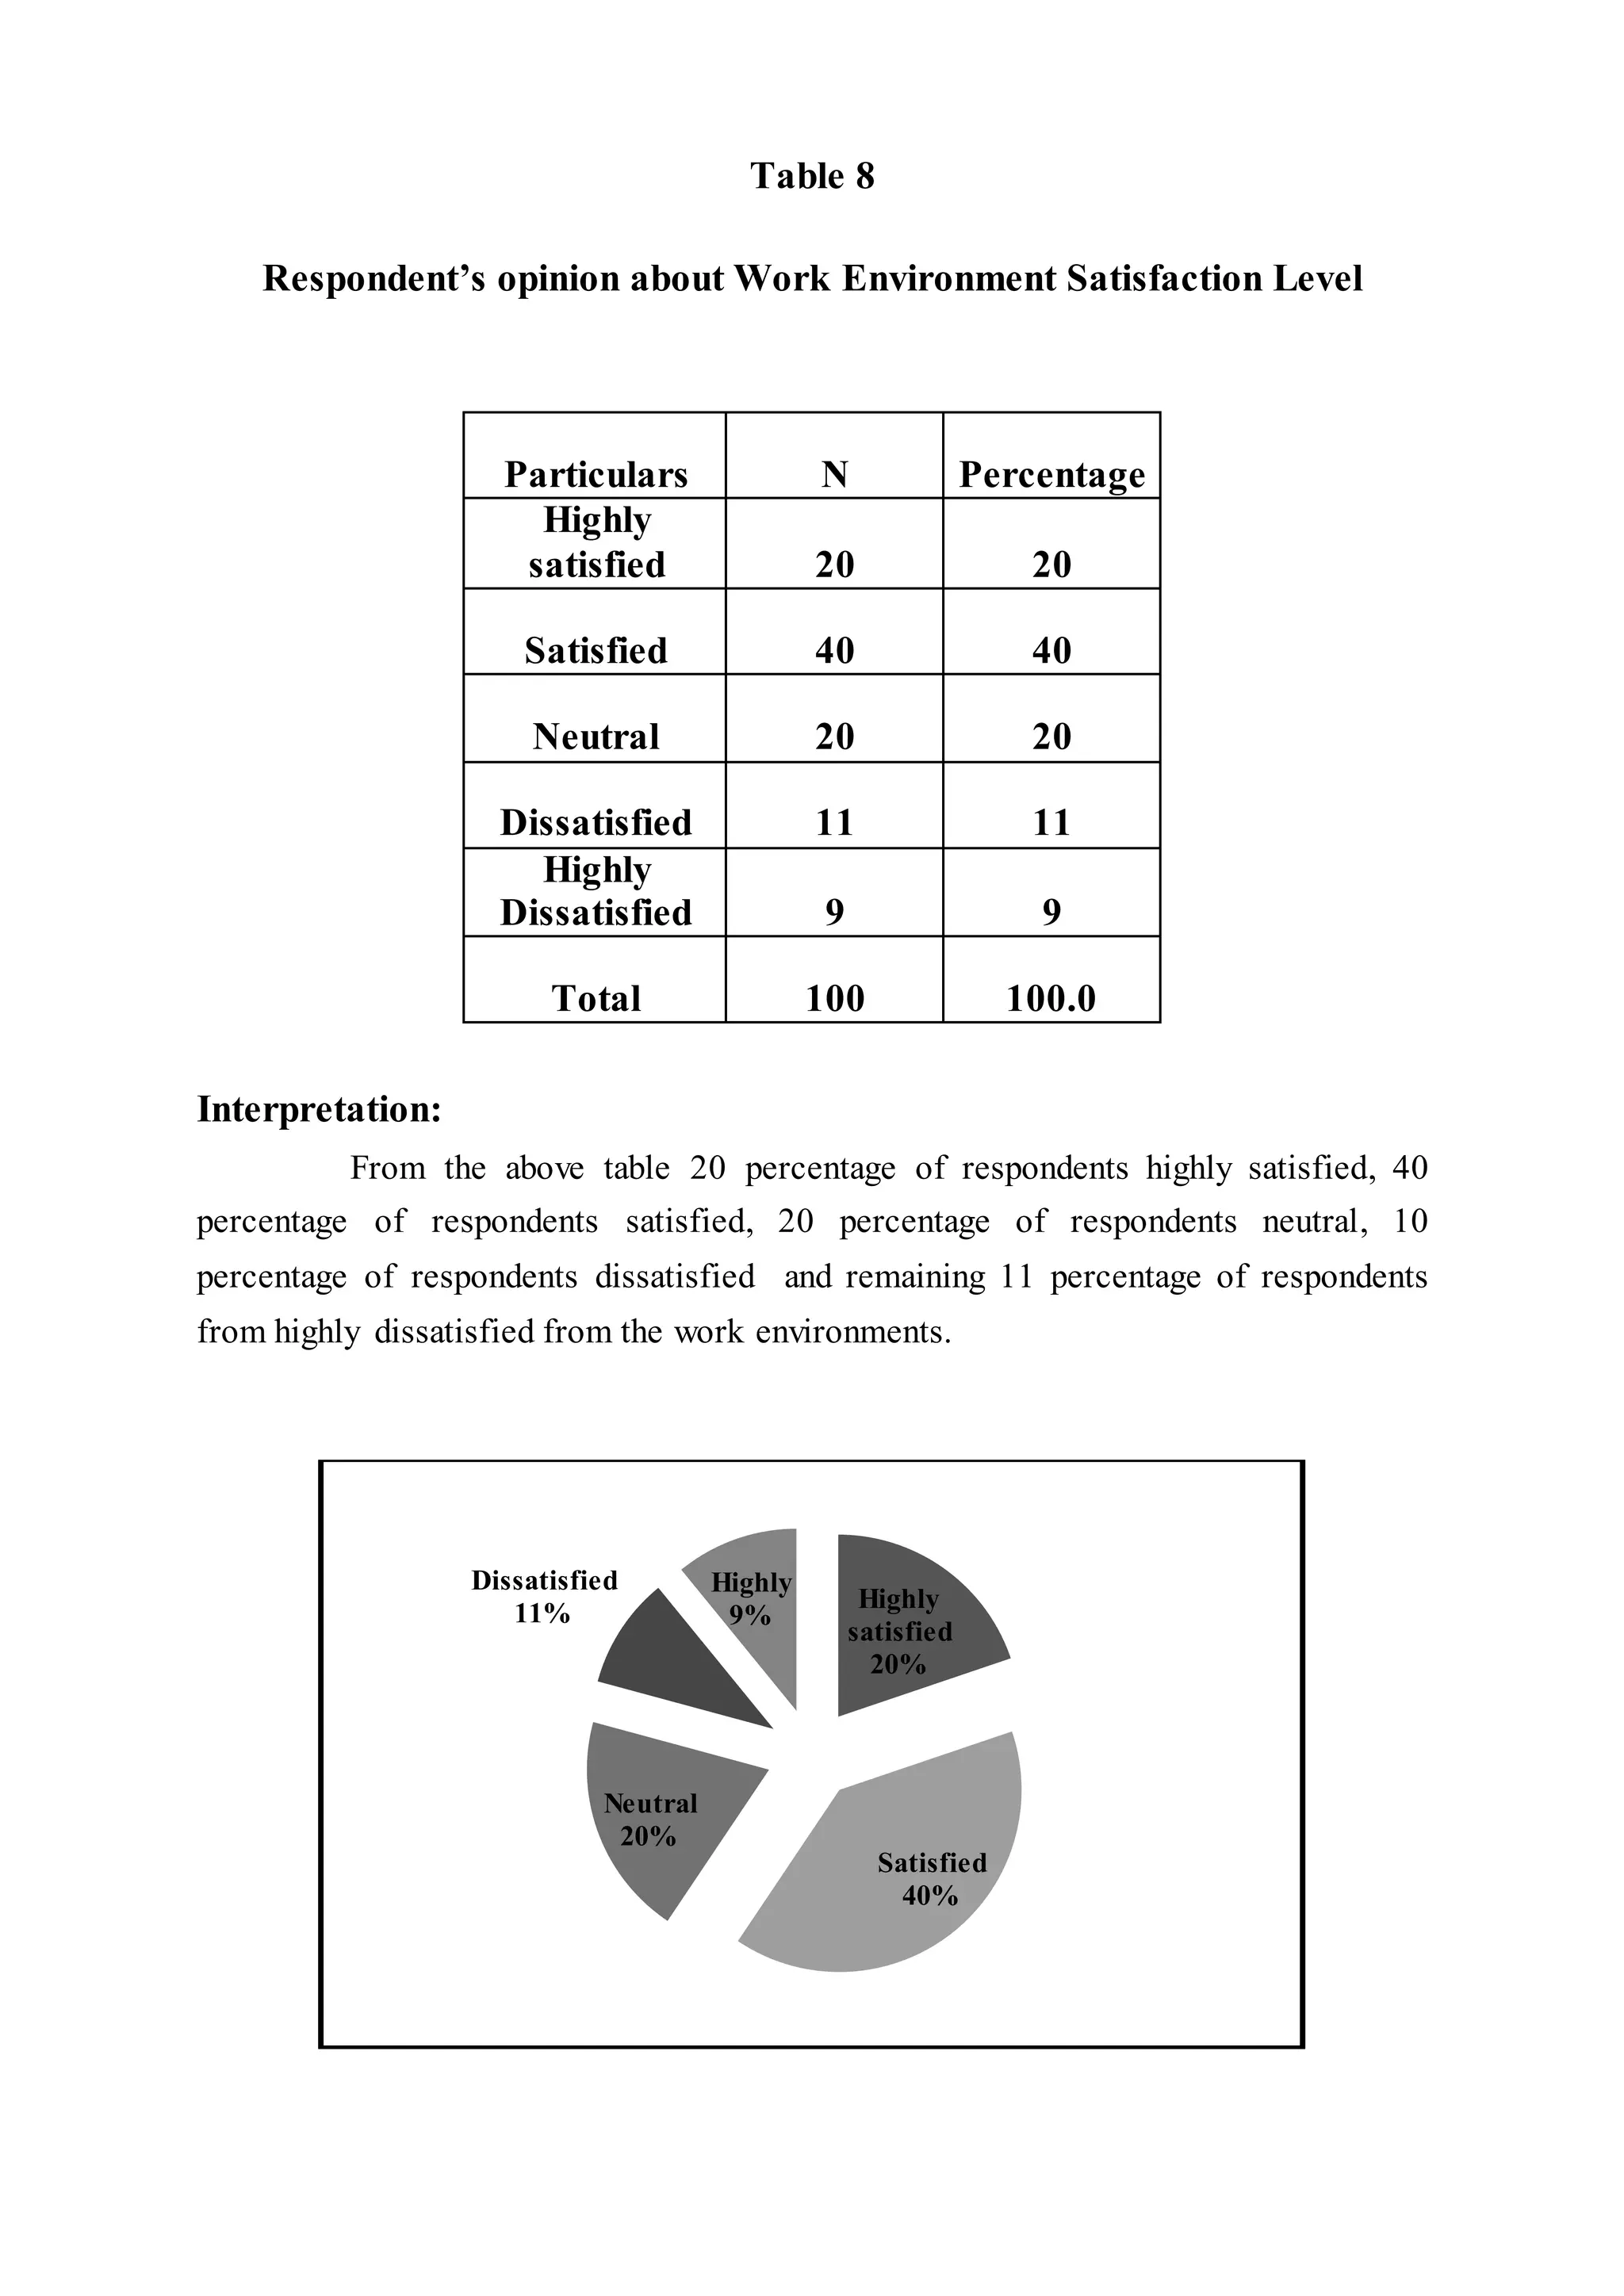
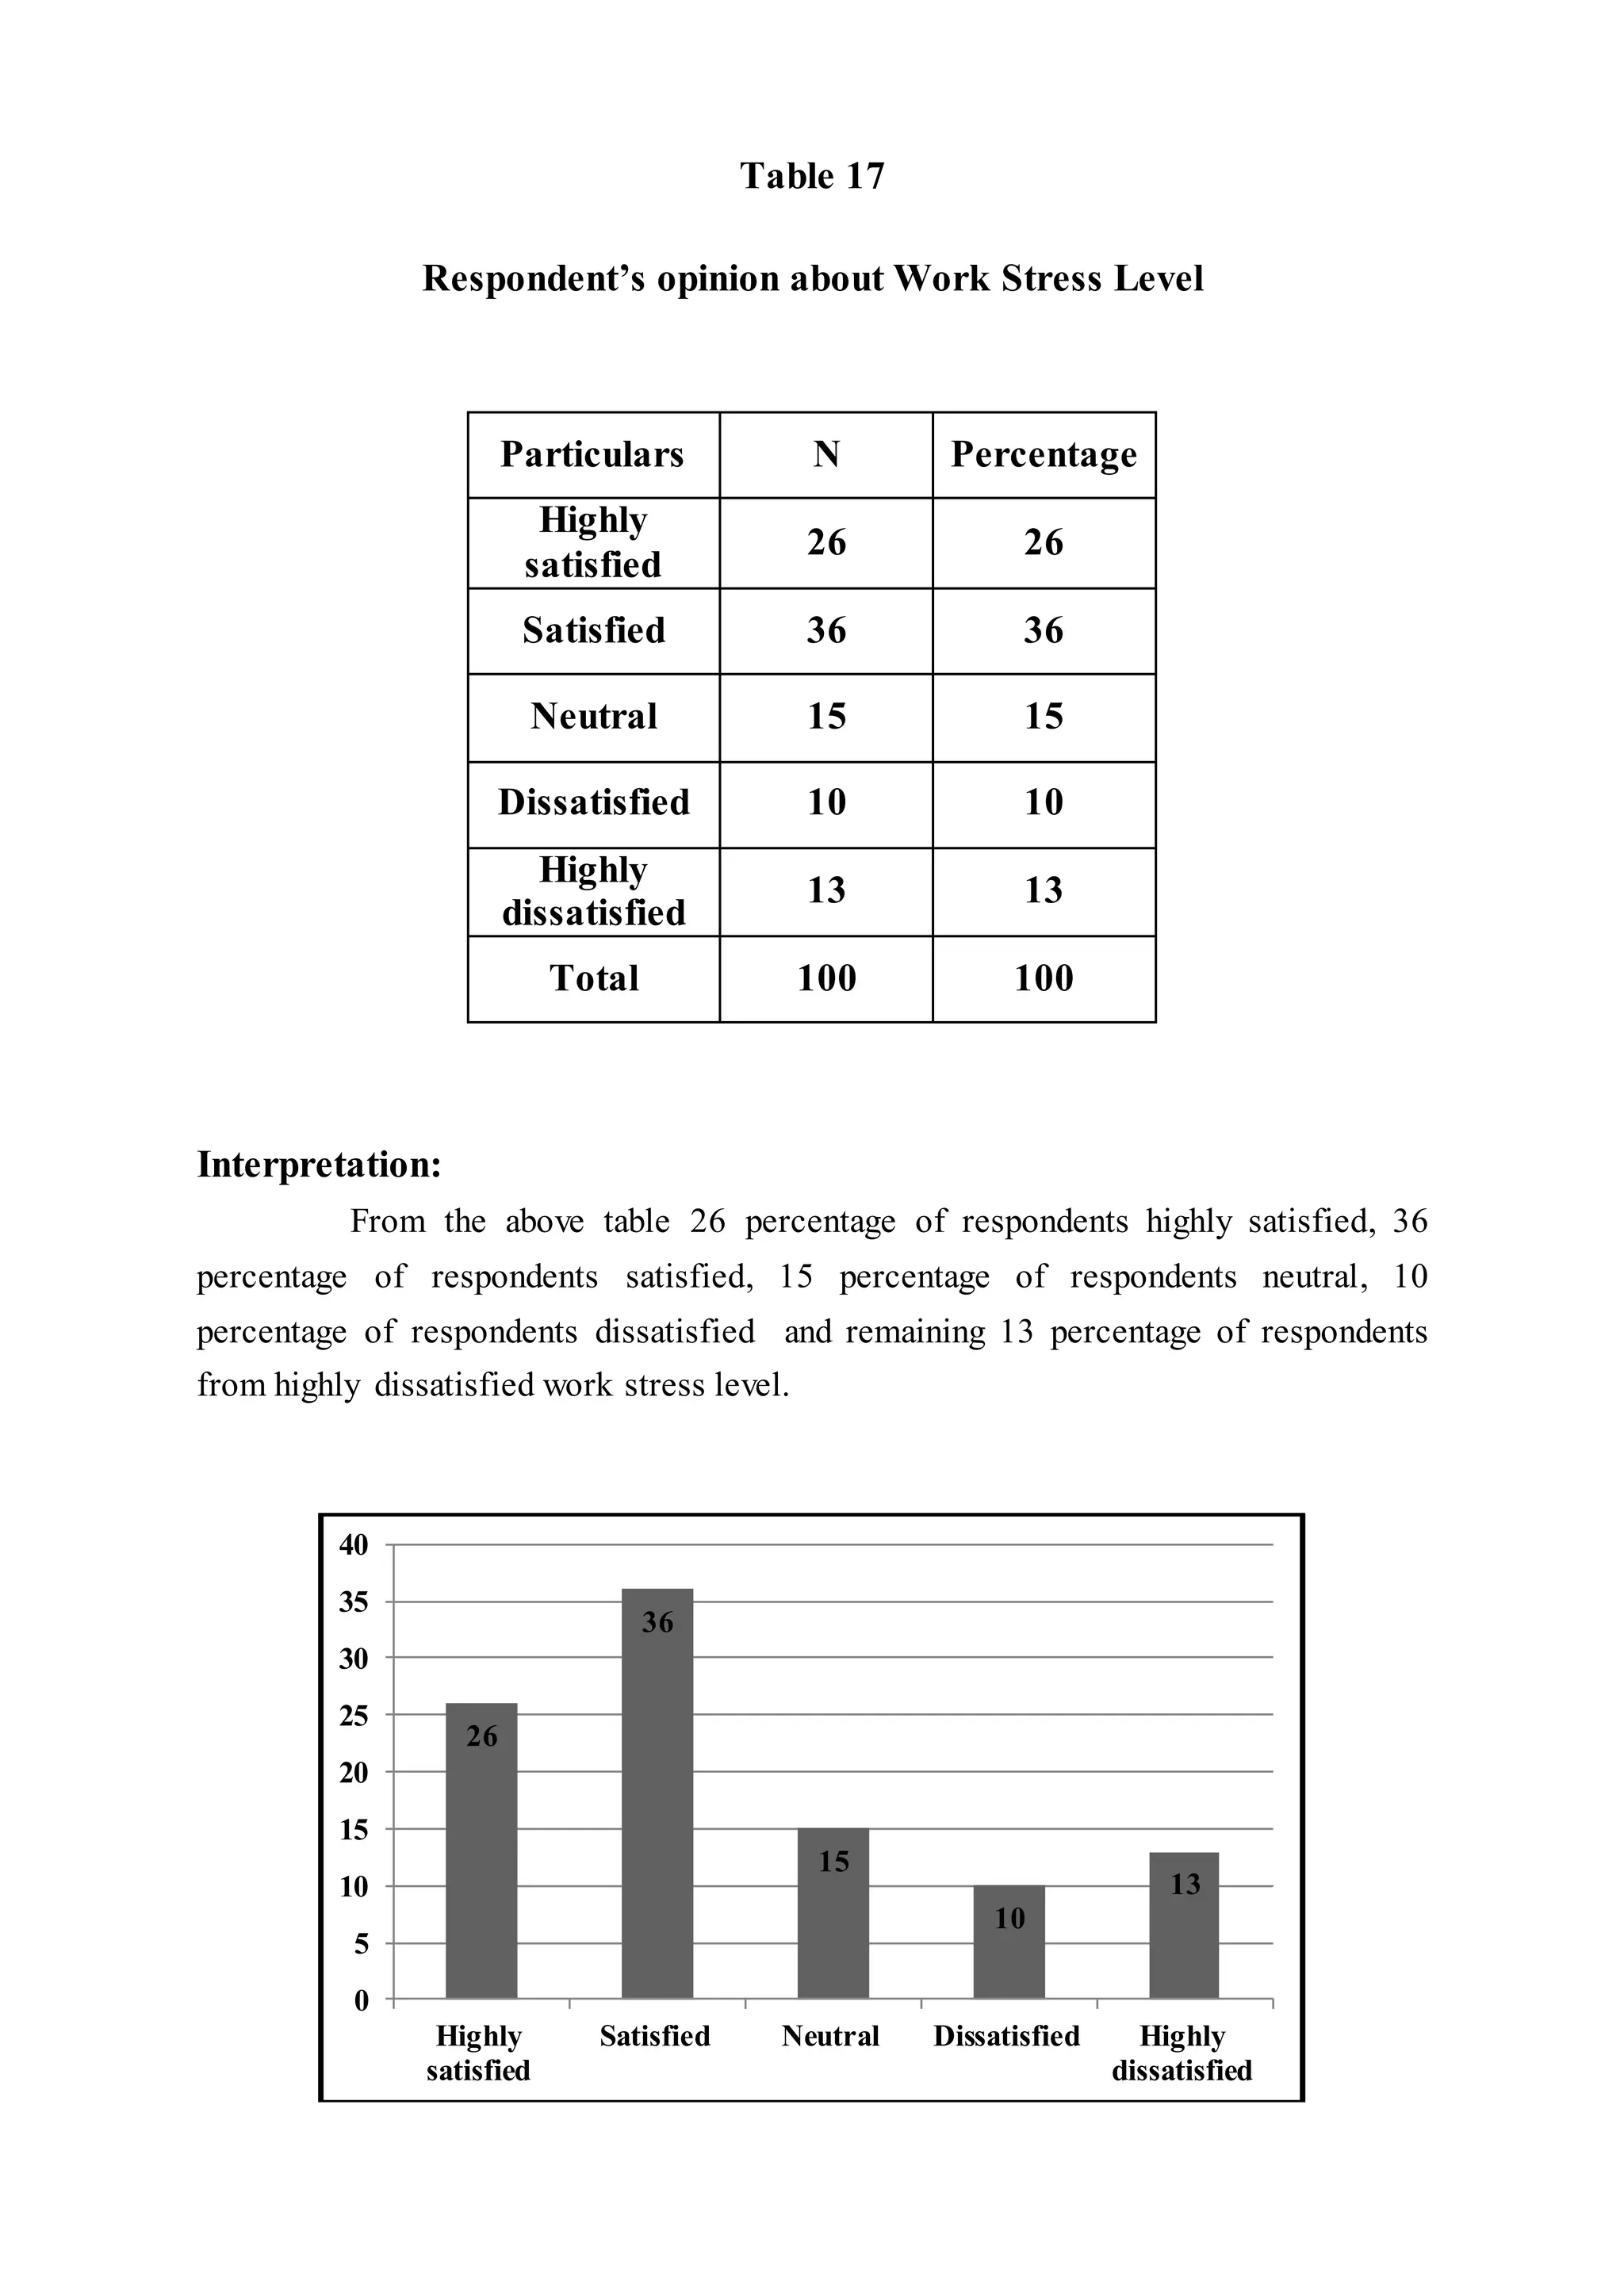
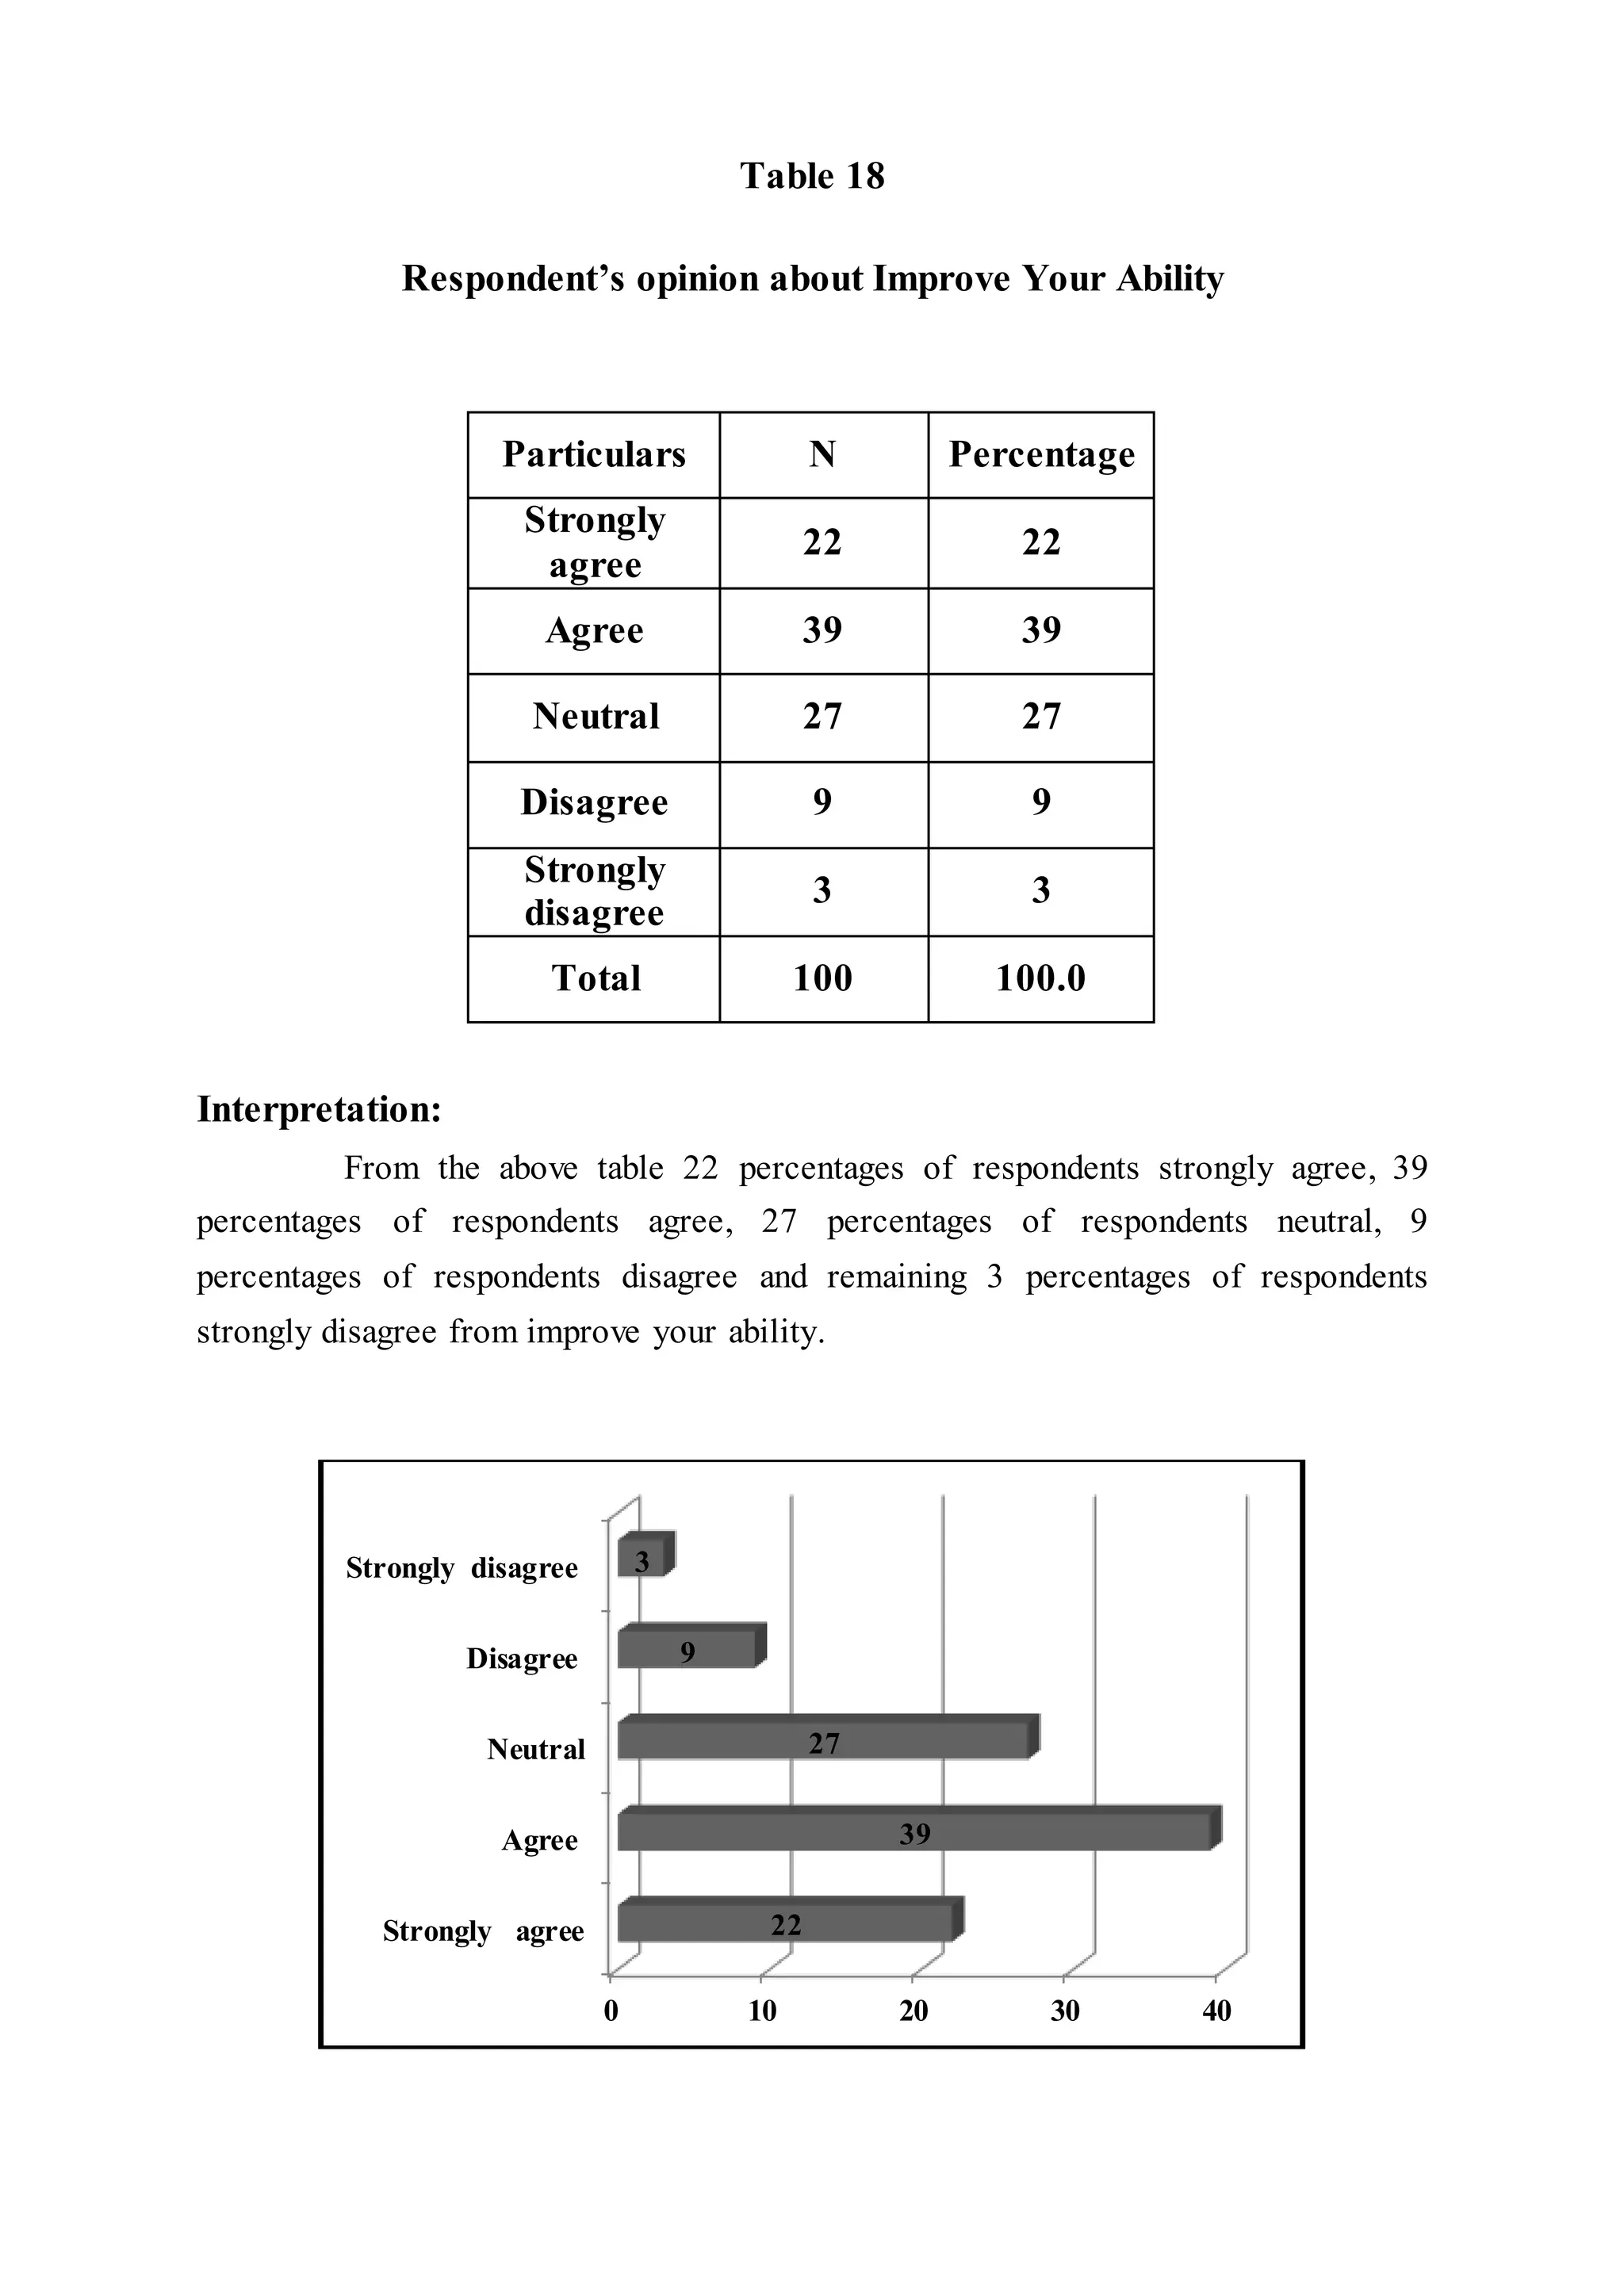
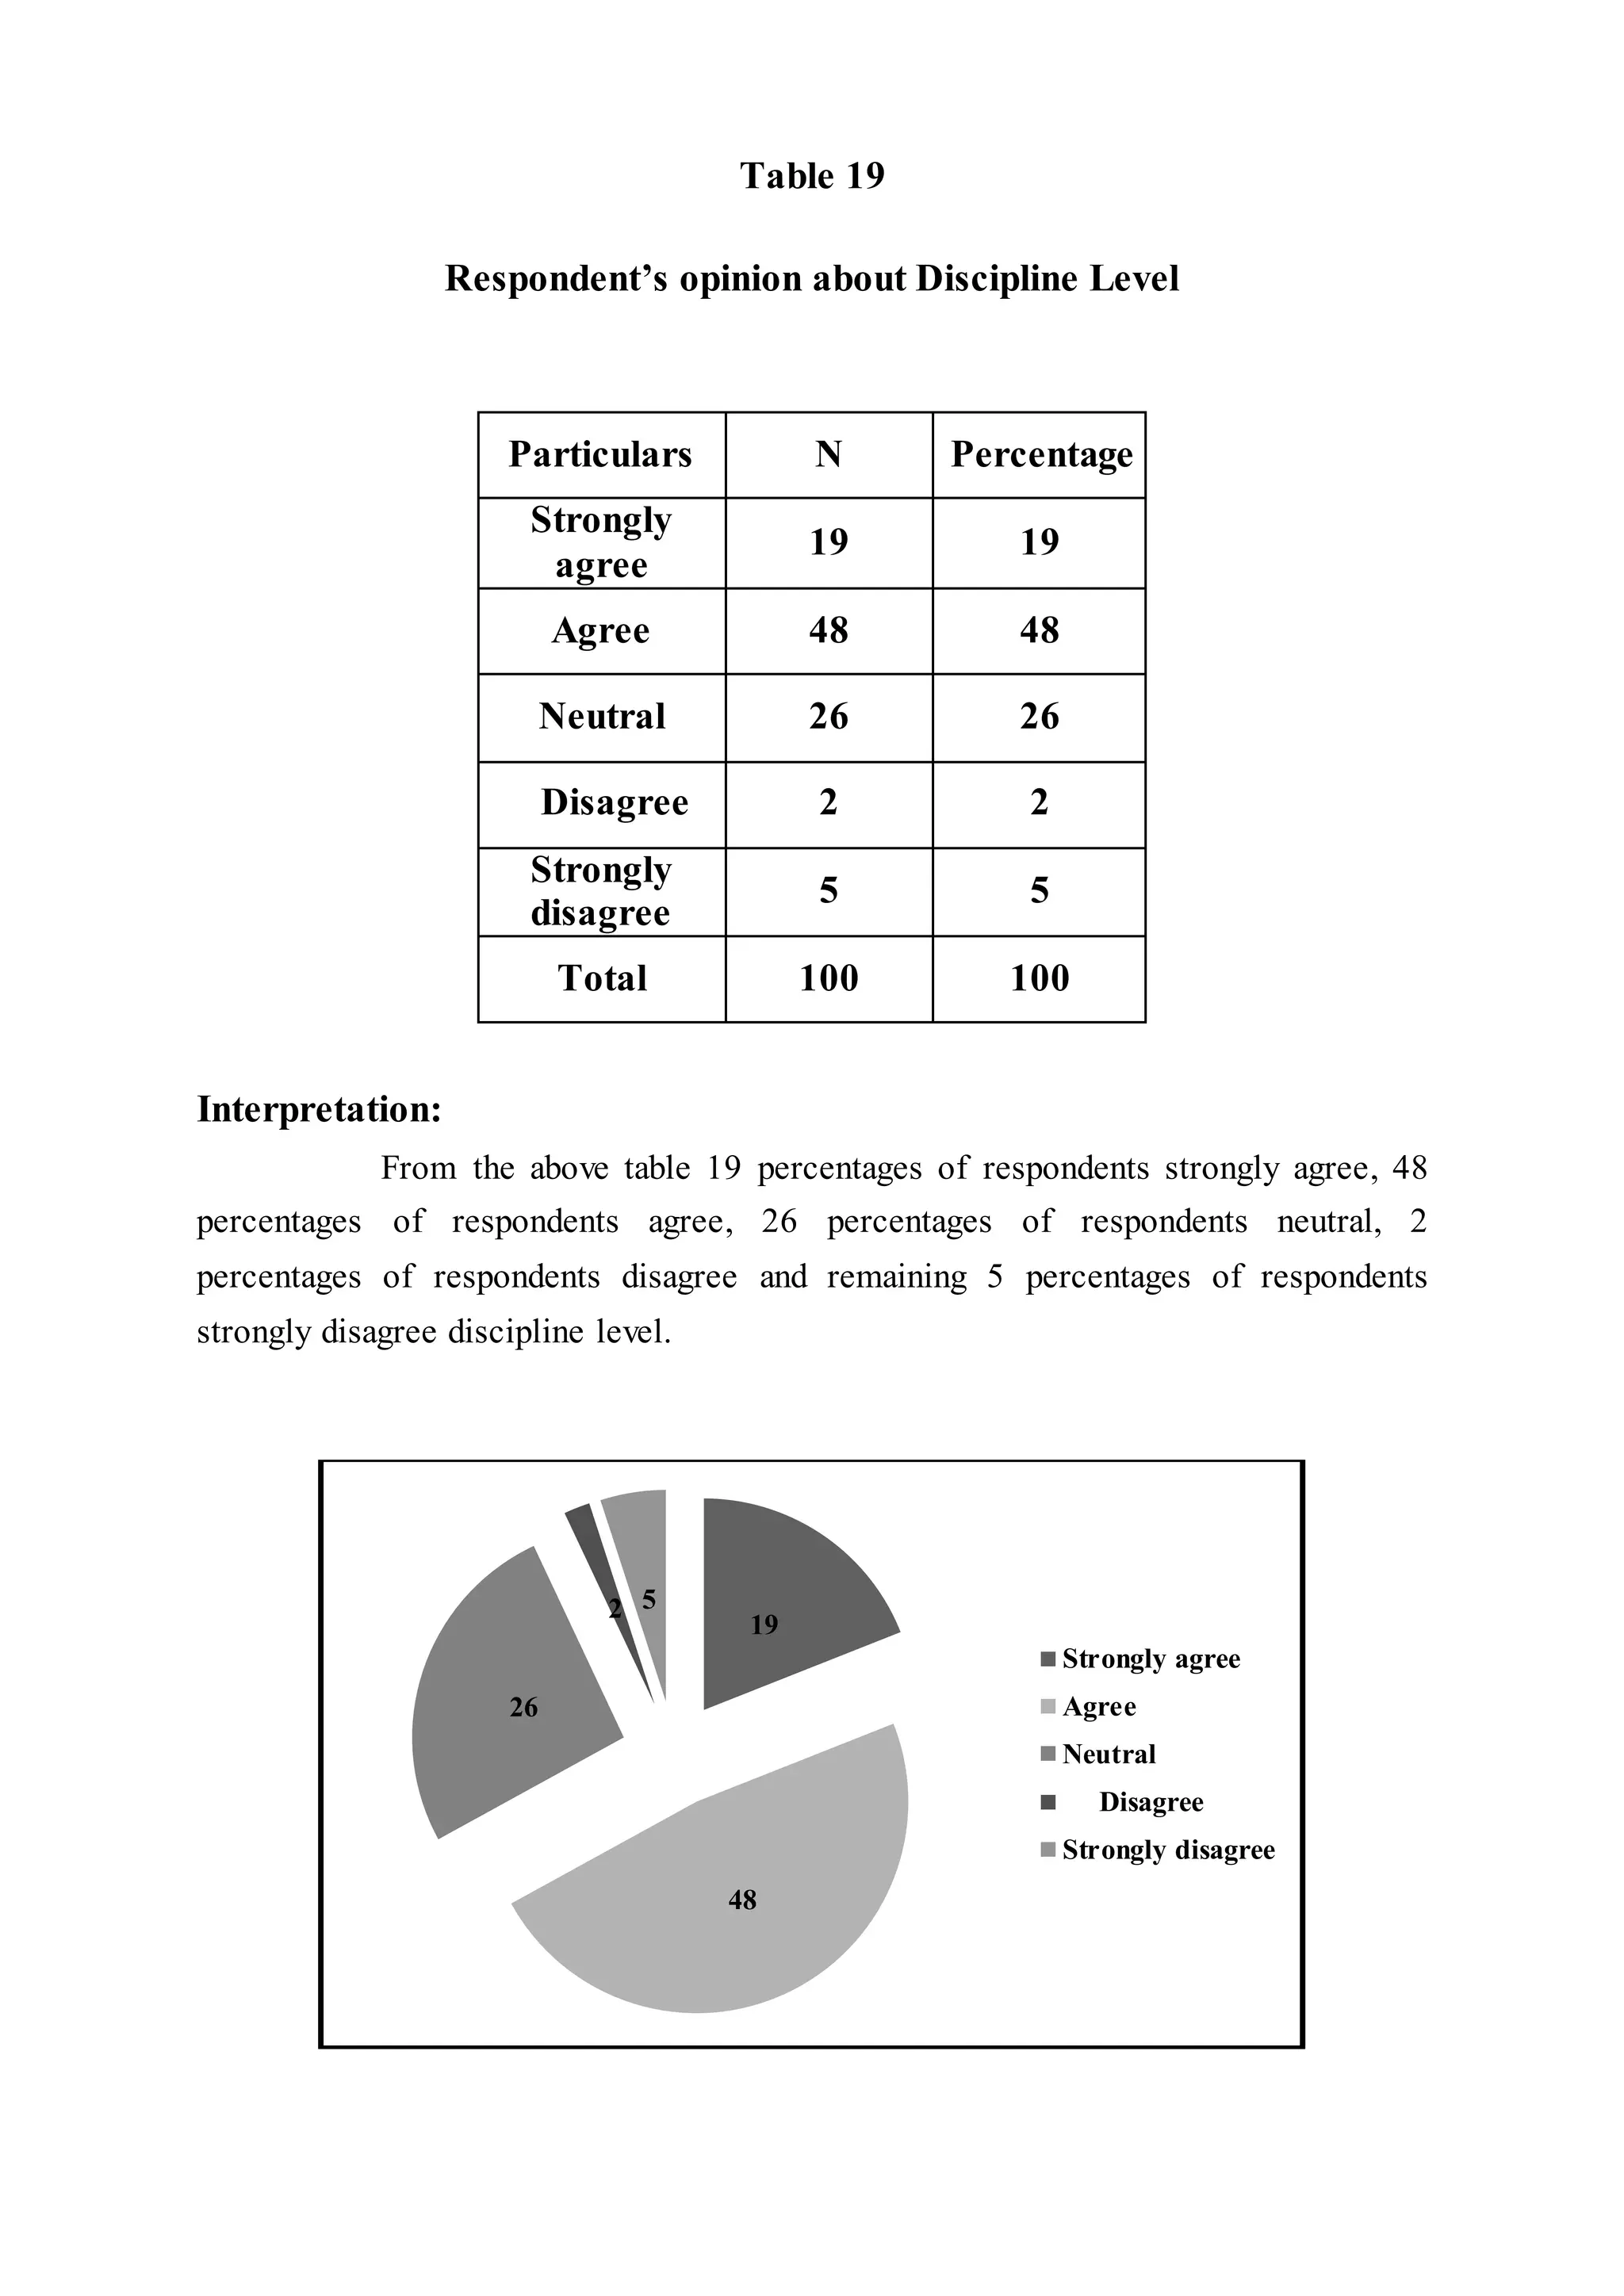
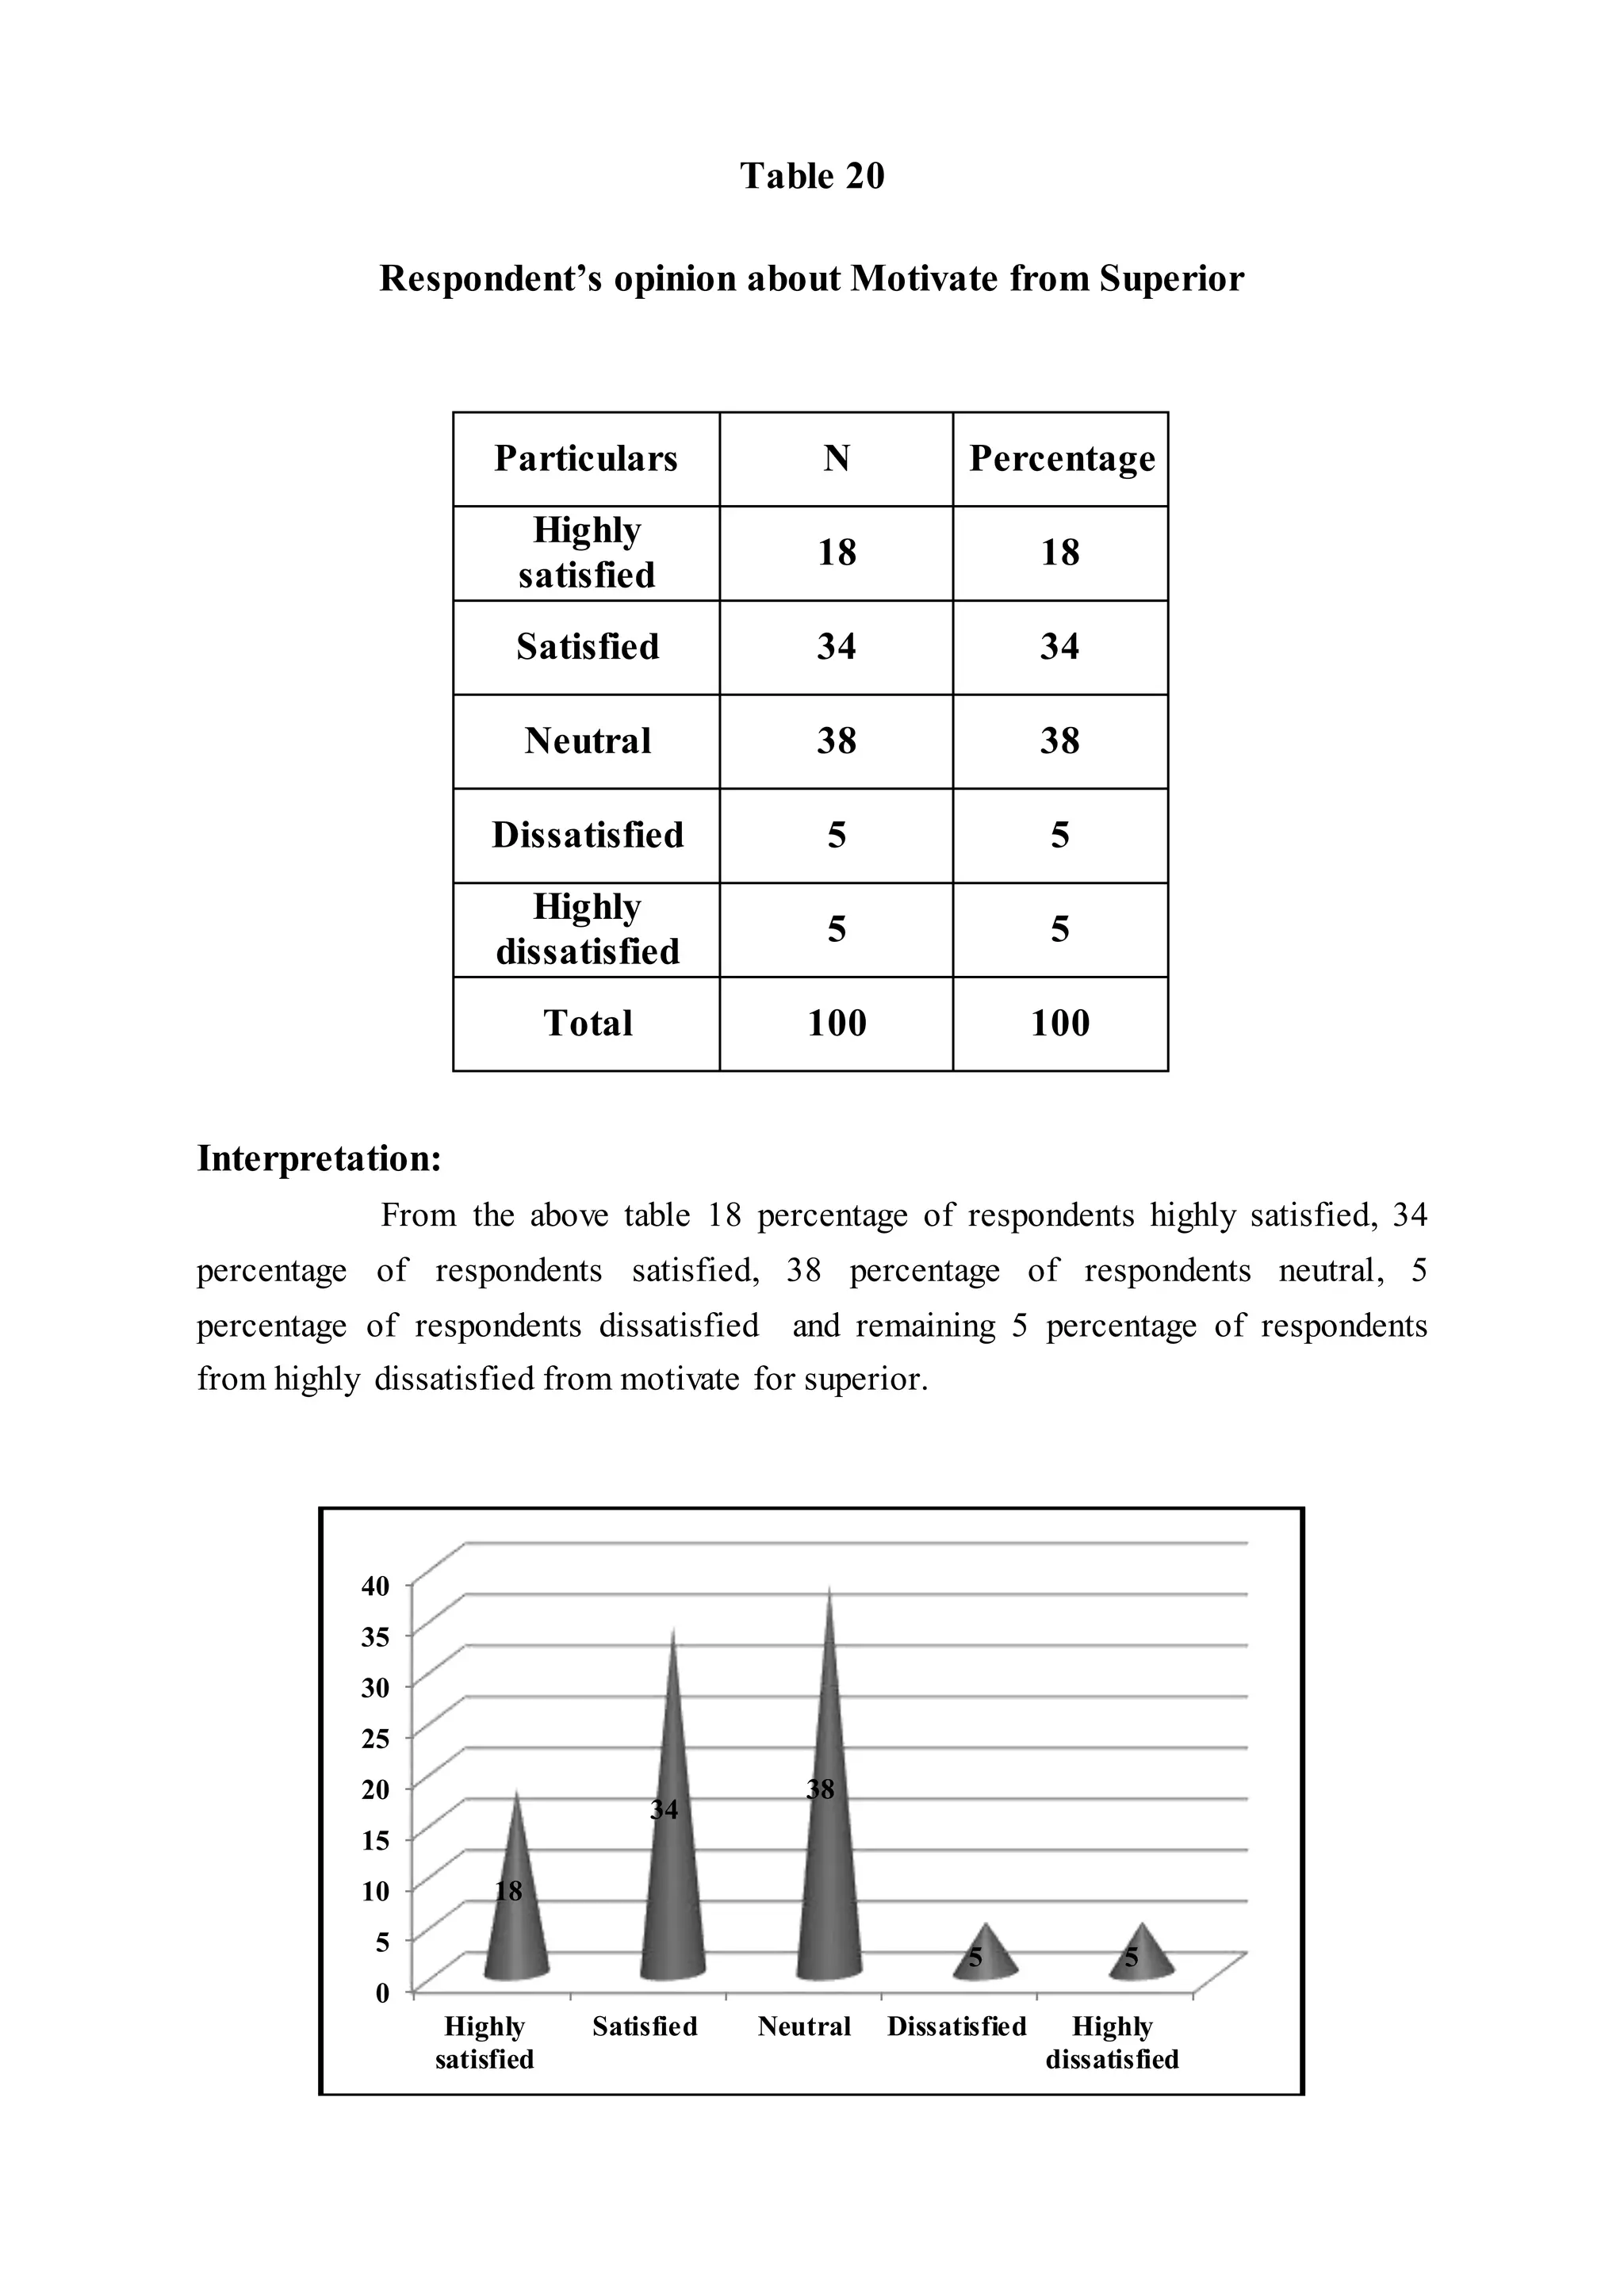
Table – 1
Distribution of the respondents on the basis of Gender
Particular N Percent
Male 84 84
Female 16 16
Total 100 100
Interpretation:
From the above table 84 percentages of respondent’s male and remaining,
16 percentages of respondents of female.
0
10
20
30
40
50
60
70
80
90
Male Female
Table – 2
Distribution of the respondents on the basis of Age
Particulars N Percent
Blow 20 14 14
20-30 22 22
30-40 27 27
Above 40 37 37
Total 100 100
Interpretation:
From the above table 14 percentage of respondents blow 20 age, 22
percentage of respondents 20-30 age, 27 percentage of respondents 30- 40 and
remaining 37 percentage of respondents above 40 age.
0
5
10
15
20
25
30
35
40
Blow 20 20-30 30-40 Above 40
Table – 3
Distribution of the respondents on the basis of Educational Qualification
Particulars Percent
10 22
12 16
Graduate
21
Diploma 24
Others 17
Total 100
Interpretation:
From the above table 22 percentages of respondents 10th, 16 percentages of
respondents 12th, 21 percentage of respondent graduate, 24 percentages of respondents
diploma and remaining 17 percentage of respondents of other qualification.
22
16
21
24
17
10
12
Graduate
Diploma
Others
Table – 4
Distribution of the respondents on the basis of Monthly income
Particulars N Percent
Below 10000 17 17
10000-15000 29 29
15000-25000 31 31
Above 25000 23 23
Total 100 100
Interpretation:
From the above table 17 percentage of respondents below 10000, 29
percentage of respondents 10000- 15000, 31 percentage of respondents 15000- 25000
and remaining 23 percentage of respondents above 25000 income.
0
5
10
15
20
25
30
35
Below 10000 10000-15000 15000-25000 Above 25000
Table – 5
Distribution of the respondents on the basis of Job Experience
Particulars N Percent
5-10 Years 21 21
10-20 Years 25 25
20-30 Years 37 37
30 Above 17 17
Total 100 100
Interpretation:
Describe the job experience of respondents 21 percentage are from 5- 10
years, 25 percentage of respondents 10- 20 years, 37 percentage of respondents 20-30
and remaining 17 percentage of respondents from 30 above job experience.
0 5 10 15 20 25 30 35 40
5-10 Years
10-20 Years
20-30 Years
30 Above
Table 6
Respondent’s opinion about Job Satisfaction level
Particulars N Percentage
Highly
Satisfied 15 15
Satisfied 43 43
Neutral 31 31
Dissatisfied 7 7
Highly
Dissatisfied 4 4
Total 100 100
Interpretation:
From the above table 15 percentage of respondents highly satisfied, 43
percentage of respondents satisfied, 31 percentage of respondents neutral, 7
percentage of respondents dissatisfied and remaining 4 percentage of respondents
from highly dissatisfied job satisfaction level.
0 10 20 30 40 50
Highly Satisfied
Satisfied
Neutral
Dissatisfied
Highly Dissatisfied
Table 7
Respondent’s opinion about Salary Level Satisfaction
Particulars N Percentage
Highly
satisfied 17 17
Satisfied 42 42
Neutral 30 30
Dissatisfied 6 6
Highly
Dissatisfied 5 5
Total 100 100
Interpretation:
From the above table 17 percentage of respondents highly satisfied, 42
percentage of respondents satisfied, 30 percentage of respondents neutral, 6
percentage of respondents dissatisfied and remaining 5 percentage of respondents
from highly dissatisfied salary level satisfaction.
0 10 20 30 40 50
Highly satisfied
Satisfied
Neutral
Dissatisfied
Highly
Dissatisfied
Table 8
Respondent’s opinion about Work Environment Satisfaction Level
Particulars N Percentage
Highly
satisfied 20 20
Satisfied 40 40
Neutral 20 20
Dissatisfied 11 11
Highly
Dissatisfied 9 9
Total 100 100.0
Interpretation:
From the above table 20 percentage of respondents highly satisfied, 40
percentage of respondents satisfied, 20 percentage of respondents neutral, 10
percentage of respondents dissatisfied and remaining 11 percentage of respondents
from highly dissatisfied from the work environments.
Highly
satisfied
20%
Satisfied
40%
Neutral
20%
Dissatisfied
11%
Highly
9%
Table 9
Respondent’s opinion about Superior and Subordinates Relationship
Particulars N Percentage
Strongly
agree 18 18
Agree 35 35
Neutral 32 32
Disagree 10 10
Strongly
disagree 5 5
Total 100 100.0
Interpretation:
From the above table 18 percentages of respondents strongly agree, 35
percentages of respondents agree, 32 percentages of respondents neutral, 10
percentages of respondents disagree and remaining 5 percentages of respondents
strongly disagree from excellent superior and subordinates relationship.
0
5
10
15
20
25
30
35
40
Strongly agree Agree Neutral Disagree Strongly
disagree
Table 10
Respondent’s opinion about Bonus and Fringe Benefits
Particulars N Percentage
Highly
Satisfied 27 27
Satisfied 36 36
Neutral 23 23
Dissatisfied 7 7
Highly
Dissatisfied 7 7
Total 100 100
Interpretation:
From the above table 27 percentage of respondents highly satisfied, 36
percentage of respondents satisfied, 23 percentage of respondents neutral, 7
percentage of respondents dissatisfied and remaining 7 percentage of respondents
from highly dissatisfied from bonus benefits.
0
5
10
15
20
25
30
35
40
Highly Satisfied Satisfied Neutral Dissatisfied Highly
Dissatisfied
Table 11
Respondent’s opinion about Work Hours
Particulars N Percentage
Strongly
agree 20 20
Agree 30 30
Neutral 38 38
Disagree 9 9
Strongly
disagree 3 3
Total 100 100
Interpretation:
From the above table 20 percentages of respondents strongly agree, 30
percentages of respondents agree, 38 percentages of respondents neutral, 9
percentages of respondents disagree and remaining 3 percentages of respondents
strongly disagree from work hours.
0
5
10
15
20
25
30
35
40
Strongly
agree
Agree Neutral Disagree Strongly
disagree
Table 12
Respondent’s opinion about over Time Work
Particulars N Percentage
Highly
satisfied 20 20
Satisfied 32 32
Neutral 33 33
Dissatisfied 11 11
Highly
dissatisfied 4 4
Total 100 100
Interpretation:
From the above table 20 percentage of respondents highly
satisfied, 32 percentage of respondents satisfied, 33 percentage of respondents neutral,
11 percentage of respondents dissatisfied and remaining 4 percentage of respondents
from highly dissatisfied over time work.
Highly
satisfied
20%
Satisfied
32%
Neutral
33%
Dissatisfied
11%
Highly
dissatisfied
4%
Percentage
Table 13
Respondent’s opinion about Medical Assistance
Particulars N Percentage
Strongly
agree 15 15
Agree 31 31
Neutral 40 40
Disagree 8 8
Strongly
disagree 6 6
Total 100 100
Interpretation:
From the above table 15 percentages of respondents strongly agree, 31
percentages of respondents agree, 40 percentages of respondents neutral, 8
percentages of respondents disagree and remaining 6 percentages of respondents
strongly disagree from medical assistance.
0
5
10
15
20
25
30
35
40
Strongly
agree
Agree Neutral Disagree Strongly
disagree
Table 14
Respondent’s opinion about Accident Compensation
Particulars N Percentage
Highly
satisfied 21 21
satisfied 34 34
Neutral 36 36
Dissatisfied 6 6
Highly
Dissatisfied 3 3
Total 100 100.0
Interpretation:
From the above table 21 percentage of respondents highly satisfied, 34
percentage of respondents satisfied, 36 percentage of respondents neutral, 6
percentage of respondents dissatisfied and remaining 3 percentage of respondents
from highly dissatisfied accident compensation.
0 10 20 30 40
Highly satisfied
satisfied
Neutral
Dissatisfied
Highly Dissatisfied
Table 15
Respondent’s opinion about Working Condition and Facilities
Particulars N Percentage
Highly
satisfied 20 20
Satisfied 34 34
Neutral 36 36
Dissatisfied 7 7
Highly
dissatisfied 3 3
Total 100 100
Interpretation:
From the above table 20 percentage of respondents highly satisfied, 34
percentage of respondents satisfied, 36 percentage of respondents neutral, 7
percentage of respondents dissatisfied and remaining 3 percentage of respondents
from highly dissatisfied from working condition and facilities.
0 10 20 30 40
Highly satisfied
Satisfied
Neutral
Dissatisfied
Highly dissatisfied
Table 16
Respondent’s opinion about Responsibility of Job
Particulars N Percentage
Highly
satisfied
29 29
Satisfied 42 42
Neutral 20 20
Dissatisfied 4 4
Highly
dissatisfied
5 5
Total 100 100.0
Interpretation:
From the above table 29 percentage of respondents highly satisfied, 42
percentage of respondents satisfied, 20 percentage of respondents neutral, 4
percentage of respondents dissatisfied and remaining 5 percentage of respondents
from highly dissatisfied from responsibility of job.
0
5
10
15
20
25
30
35
40
45
Highly
satisfied
Satisfied Neutral Dissatisfied Highly
dissatisfied
Table 17
Respondent’s opinion about Work Stress Level
Particulars N Percentage
Highly
satisfied
26 26
Satisfied 36 36
Neutral 15 15
Dissatisfied 10 10
Highly
dissatisfied
13 13
Total 100 100
Interpretation:
From the above table 26 percentage of respondents highly satisfied, 36
percentage of respondents satisfied, 15 percentage of respondents neutral, 10
percentage of respondents dissatisfied and remaining 13 percentage of respondents
from highly dissatisfied work stress level.
26
36
15
10
13
0
5
10
15
20
25
30
35
40
Highly
satisfied
Satisfied Neutral Dissatisfied Highly
dissatisfied
Table 18
Respondent’s opinion about Improve Your Ability
Particulars N Percentage
Strongly
agree
22 22
Agree 39 39
Neutral 27 27
Disagree 9 9
Strongly
disagree
3 3
Total 100 100.0
Interpretation:
From the above table 22 percentages of respondents strongly agree, 39
percentages of respondents agree, 27 percentages of respondents neutral, 9
percentages of respondents disagree and remaining 3 percentages of respondents
strongly disagree from improve your ability.
0 10 20 30 40
Strongly agree
Agree
Neutral
Disagree
Strongly disagree
22
39
27
9
3
Table 19
Respondent’s opinion about Discipline Level
Particulars N Percentage
Strongly
agree
19 19
Agree 48 48
Neutral 26 26
Disagree 2 2
Strongly
disagree
5 5
Total 100 100
Interpretation:
From the above table 19 percentages of respondents strongly agree, 48
percentages of respondents agree, 26 percentages of respondents neutral, 2
percentages of respondents disagree and remaining 5 percentages of respondents
strongly disagree discipline level.
19
48
26
2 5
Strongly agree
Agree
Neutral
Disagree
Strongly disagree
Table 20
Respondent’s opinion about Motivate from Superior
Particulars N Percentage
Highly
satisfied
18 18
Satisfied 34 34
Neutral 38 38
Dissatisfied 5 5
Highly
dissatisfied
5 5
Total 100 100
Interpretation:
From the above table 18 percentage of respondents highly satisfied, 34
percentage of respondents satisfied, 38 percentage of respondents neutral, 5
percentage of respondents dissatisfied and remaining 5 percentage of respondents
from highly dissatisfied from motivate for superior.
0
5
10
15
20
25
30
35
40
Highly
satisfied
Satisfied Neutral Dissatisfied Highly
dissatisfied
18
34
38
5 5
Table 21
Respondent’s opinion about Use New Technology
Particulars N Percentage
Strongly
agree
10 10
Agree 41 41
Neutral 39 39
Disagree 7 7
Strongly
disagree
3 3
Total 100 100
Interpretation:
From the above table 10 percentages of respondents strongly agree, 41
percentages of respondents agree, 39 percentages of respondents neutral, 7
percentages of respondents disagree and remaining 3 percentages of respondents
strongly disagree from use new technology.
0
5
10
15
20
25
30
35
40
45
Strongly
agree
Agree Neutral Disagree Strongly
disagree
10
41 39
7
3
Table 22
Respondent’s opinion about Training Method
Particulars N Percentage
Strongly
agree
13 13
Agree 38 38
Neutral 35 35
Disagree 10 10
Strongly
disagree
4 4
Total 100 100
Interpretation:
From the above table 13 percentages of respondents strongly agree, 38
percentages of respondents agree, 35 percentages of respondents neutral, 10
percentages of respondents disagree and remaining 4 percentages of respondents
strongly disagree from training methods.
0
5
10
15
20
25
30
35
40
Strongly
agree
Agree Neutral Disagree Strongly
disagree
13
38 35
10
4
Table 23
Respondent’s opinion about Training Provide Current Job
Particulars N Percentage
Highly
satisfied
17 17
Satisfied 37 37
Neutral 35 35
Dissatisfied 7 7
Highly
dissatisfied
4 4
Total 100 100.0
Interpretation:
From the above table 17 percentage of respondents highly satisfied, 37
percentage of respondents satisfied, 35 percentage of respondents neutral, 7
percentage of respondents dissatisfied and remaining 4 percentage of respondents
from highly dissatisfied from training current job.
17
37
35
7
4
0
5
10
15
20
25
30
35
40
Highly
satisfied
Satisfied Neutral Dissatisfied Highly
dissatisfied
Table 24
Respondent’s opinion about Career Development
Particulars N Percentage
Highly
satisfied
19 19
Satisfied 40 40
Neutral 31 31
Dissatisfied 6 6
Highly
dissatisfied
4 4
Total 100 100
Interpretation:
From the above table 19 percentage of respondents highly satisfied, 40
percentage of respondents satisfied, 31 percentage of respondents neutral, 6
percentage of respondents dissatisfied and remaining 4 percentage of respondents
from highly dissatisfied career development.
0 10 20 30 40
Highly satisfied
Satisfied
Neutral
Dissatisfied
Highly dissatisfied
19
40
31
6
4
Table 25
Respondent’s opinion about Use Skills and Ability
Particulars N Percentage
Strongly
agree
20 20
Agree 45 45
Neutral 28 28
Disagree 5 5
Strongly
disagree
2 2
Total 100 100
Interpretation:
From the above table 20 percentages of respondents strongly agree, 45
percentages of respondents agree, 28 percentages of respondents neutral, 5
percentages of respondents disagree and remaining 2 percentages of respondents
strongly disagree from use skills and ability.
0
5
10
15
20
25
30
35
40
45
Strongly
agree
Agree Neutral Disagree Strongly
disagree
20
45
28
5 2
Table 26
Respondent’s opinion about Welfare and Safety Measures
Particulars N Percentage
Strongly
agree
28 28
Agree 41 41
Neutral 23 23
Disagree 3 3
Strongly
disagree
5 5
Total 100 100
Interpretation:
From the above table 28 percentages of respondents strongly agree, 41
percentages of respondents agree, 23 percentages of respondents neutral, 3
percentages of respondents disagree and remaining 5 percentages of respondents
strongly disagree from welfare and safety measures.
0
5
10
15
20
25
30
35
40
45
Strongly
agree
Agree Neutral Disagree Strongly
disagree
28
41
23
3 5

Inter table

  • 1.
    Table – 1 Distributionof the respondents on the basis of Gender Particular N Percent Male 84 84 Female 16 16 Total 100 100 Interpretation: From the above table 84 percentages of respondent’s male and remaining, 16 percentages of respondents of female. 0 10 20 30 40 50 60 70 80 90 Male Female
  • 2.
    Table – 2 Distributionof the respondents on the basis of Age Particulars N Percent Blow 20 14 14 20-30 22 22 30-40 27 27 Above 40 37 37 Total 100 100 Interpretation: From the above table 14 percentage of respondents blow 20 age, 22 percentage of respondents 20-30 age, 27 percentage of respondents 30- 40 and remaining 37 percentage of respondents above 40 age. 0 5 10 15 20 25 30 35 40 Blow 20 20-30 30-40 Above 40
  • 3.
    Table – 3 Distributionof the respondents on the basis of Educational Qualification Particulars Percent 10 22 12 16 Graduate 21 Diploma 24 Others 17 Total 100 Interpretation: From the above table 22 percentages of respondents 10th, 16 percentages of respondents 12th, 21 percentage of respondent graduate, 24 percentages of respondents diploma and remaining 17 percentage of respondents of other qualification. 22 16 21 24 17 10 12 Graduate Diploma Others
  • 4.
    Table – 4 Distributionof the respondents on the basis of Monthly income Particulars N Percent Below 10000 17 17 10000-15000 29 29 15000-25000 31 31 Above 25000 23 23 Total 100 100 Interpretation: From the above table 17 percentage of respondents below 10000, 29 percentage of respondents 10000- 15000, 31 percentage of respondents 15000- 25000 and remaining 23 percentage of respondents above 25000 income. 0 5 10 15 20 25 30 35 Below 10000 10000-15000 15000-25000 Above 25000
  • 5.
    Table – 5 Distributionof the respondents on the basis of Job Experience Particulars N Percent 5-10 Years 21 21 10-20 Years 25 25 20-30 Years 37 37 30 Above 17 17 Total 100 100 Interpretation: Describe the job experience of respondents 21 percentage are from 5- 10 years, 25 percentage of respondents 10- 20 years, 37 percentage of respondents 20-30 and remaining 17 percentage of respondents from 30 above job experience. 0 5 10 15 20 25 30 35 40 5-10 Years 10-20 Years 20-30 Years 30 Above
  • 6.
    Table 6 Respondent’s opinionabout Job Satisfaction level Particulars N Percentage Highly Satisfied 15 15 Satisfied 43 43 Neutral 31 31 Dissatisfied 7 7 Highly Dissatisfied 4 4 Total 100 100 Interpretation: From the above table 15 percentage of respondents highly satisfied, 43 percentage of respondents satisfied, 31 percentage of respondents neutral, 7 percentage of respondents dissatisfied and remaining 4 percentage of respondents from highly dissatisfied job satisfaction level. 0 10 20 30 40 50 Highly Satisfied Satisfied Neutral Dissatisfied Highly Dissatisfied
  • 7.
    Table 7 Respondent’s opinionabout Salary Level Satisfaction Particulars N Percentage Highly satisfied 17 17 Satisfied 42 42 Neutral 30 30 Dissatisfied 6 6 Highly Dissatisfied 5 5 Total 100 100 Interpretation: From the above table 17 percentage of respondents highly satisfied, 42 percentage of respondents satisfied, 30 percentage of respondents neutral, 6 percentage of respondents dissatisfied and remaining 5 percentage of respondents from highly dissatisfied salary level satisfaction. 0 10 20 30 40 50 Highly satisfied Satisfied Neutral Dissatisfied Highly Dissatisfied
  • 8.
    Table 8 Respondent’s opinionabout Work Environment Satisfaction Level Particulars N Percentage Highly satisfied 20 20 Satisfied 40 40 Neutral 20 20 Dissatisfied 11 11 Highly Dissatisfied 9 9 Total 100 100.0 Interpretation: From the above table 20 percentage of respondents highly satisfied, 40 percentage of respondents satisfied, 20 percentage of respondents neutral, 10 percentage of respondents dissatisfied and remaining 11 percentage of respondents from highly dissatisfied from the work environments. Highly satisfied 20% Satisfied 40% Neutral 20% Dissatisfied 11% Highly 9%
  • 9.
    Table 9 Respondent’s opinionabout Superior and Subordinates Relationship Particulars N Percentage Strongly agree 18 18 Agree 35 35 Neutral 32 32 Disagree 10 10 Strongly disagree 5 5 Total 100 100.0 Interpretation: From the above table 18 percentages of respondents strongly agree, 35 percentages of respondents agree, 32 percentages of respondents neutral, 10 percentages of respondents disagree and remaining 5 percentages of respondents strongly disagree from excellent superior and subordinates relationship. 0 5 10 15 20 25 30 35 40 Strongly agree Agree Neutral Disagree Strongly disagree
  • 10.
    Table 10 Respondent’s opinionabout Bonus and Fringe Benefits Particulars N Percentage Highly Satisfied 27 27 Satisfied 36 36 Neutral 23 23 Dissatisfied 7 7 Highly Dissatisfied 7 7 Total 100 100 Interpretation: From the above table 27 percentage of respondents highly satisfied, 36 percentage of respondents satisfied, 23 percentage of respondents neutral, 7 percentage of respondents dissatisfied and remaining 7 percentage of respondents from highly dissatisfied from bonus benefits. 0 5 10 15 20 25 30 35 40 Highly Satisfied Satisfied Neutral Dissatisfied Highly Dissatisfied
  • 11.
    Table 11 Respondent’s opinionabout Work Hours Particulars N Percentage Strongly agree 20 20 Agree 30 30 Neutral 38 38 Disagree 9 9 Strongly disagree 3 3 Total 100 100 Interpretation: From the above table 20 percentages of respondents strongly agree, 30 percentages of respondents agree, 38 percentages of respondents neutral, 9 percentages of respondents disagree and remaining 3 percentages of respondents strongly disagree from work hours. 0 5 10 15 20 25 30 35 40 Strongly agree Agree Neutral Disagree Strongly disagree
  • 12.
    Table 12 Respondent’s opinionabout over Time Work Particulars N Percentage Highly satisfied 20 20 Satisfied 32 32 Neutral 33 33 Dissatisfied 11 11 Highly dissatisfied 4 4 Total 100 100 Interpretation: From the above table 20 percentage of respondents highly satisfied, 32 percentage of respondents satisfied, 33 percentage of respondents neutral, 11 percentage of respondents dissatisfied and remaining 4 percentage of respondents from highly dissatisfied over time work. Highly satisfied 20% Satisfied 32% Neutral 33% Dissatisfied 11% Highly dissatisfied 4% Percentage
  • 13.
    Table 13 Respondent’s opinionabout Medical Assistance Particulars N Percentage Strongly agree 15 15 Agree 31 31 Neutral 40 40 Disagree 8 8 Strongly disagree 6 6 Total 100 100 Interpretation: From the above table 15 percentages of respondents strongly agree, 31 percentages of respondents agree, 40 percentages of respondents neutral, 8 percentages of respondents disagree and remaining 6 percentages of respondents strongly disagree from medical assistance. 0 5 10 15 20 25 30 35 40 Strongly agree Agree Neutral Disagree Strongly disagree
  • 14.
    Table 14 Respondent’s opinionabout Accident Compensation Particulars N Percentage Highly satisfied 21 21 satisfied 34 34 Neutral 36 36 Dissatisfied 6 6 Highly Dissatisfied 3 3 Total 100 100.0 Interpretation: From the above table 21 percentage of respondents highly satisfied, 34 percentage of respondents satisfied, 36 percentage of respondents neutral, 6 percentage of respondents dissatisfied and remaining 3 percentage of respondents from highly dissatisfied accident compensation. 0 10 20 30 40 Highly satisfied satisfied Neutral Dissatisfied Highly Dissatisfied
  • 15.
    Table 15 Respondent’s opinionabout Working Condition and Facilities Particulars N Percentage Highly satisfied 20 20 Satisfied 34 34 Neutral 36 36 Dissatisfied 7 7 Highly dissatisfied 3 3 Total 100 100 Interpretation: From the above table 20 percentage of respondents highly satisfied, 34 percentage of respondents satisfied, 36 percentage of respondents neutral, 7 percentage of respondents dissatisfied and remaining 3 percentage of respondents from highly dissatisfied from working condition and facilities. 0 10 20 30 40 Highly satisfied Satisfied Neutral Dissatisfied Highly dissatisfied
  • 16.
    Table 16 Respondent’s opinionabout Responsibility of Job Particulars N Percentage Highly satisfied 29 29 Satisfied 42 42 Neutral 20 20 Dissatisfied 4 4 Highly dissatisfied 5 5 Total 100 100.0 Interpretation: From the above table 29 percentage of respondents highly satisfied, 42 percentage of respondents satisfied, 20 percentage of respondents neutral, 4 percentage of respondents dissatisfied and remaining 5 percentage of respondents from highly dissatisfied from responsibility of job. 0 5 10 15 20 25 30 35 40 45 Highly satisfied Satisfied Neutral Dissatisfied Highly dissatisfied
  • 17.
    Table 17 Respondent’s opinionabout Work Stress Level Particulars N Percentage Highly satisfied 26 26 Satisfied 36 36 Neutral 15 15 Dissatisfied 10 10 Highly dissatisfied 13 13 Total 100 100 Interpretation: From the above table 26 percentage of respondents highly satisfied, 36 percentage of respondents satisfied, 15 percentage of respondents neutral, 10 percentage of respondents dissatisfied and remaining 13 percentage of respondents from highly dissatisfied work stress level. 26 36 15 10 13 0 5 10 15 20 25 30 35 40 Highly satisfied Satisfied Neutral Dissatisfied Highly dissatisfied
  • 18.
    Table 18 Respondent’s opinionabout Improve Your Ability Particulars N Percentage Strongly agree 22 22 Agree 39 39 Neutral 27 27 Disagree 9 9 Strongly disagree 3 3 Total 100 100.0 Interpretation: From the above table 22 percentages of respondents strongly agree, 39 percentages of respondents agree, 27 percentages of respondents neutral, 9 percentages of respondents disagree and remaining 3 percentages of respondents strongly disagree from improve your ability. 0 10 20 30 40 Strongly agree Agree Neutral Disagree Strongly disagree 22 39 27 9 3
  • 19.
    Table 19 Respondent’s opinionabout Discipline Level Particulars N Percentage Strongly agree 19 19 Agree 48 48 Neutral 26 26 Disagree 2 2 Strongly disagree 5 5 Total 100 100 Interpretation: From the above table 19 percentages of respondents strongly agree, 48 percentages of respondents agree, 26 percentages of respondents neutral, 2 percentages of respondents disagree and remaining 5 percentages of respondents strongly disagree discipline level. 19 48 26 2 5 Strongly agree Agree Neutral Disagree Strongly disagree
  • 20.
    Table 20 Respondent’s opinionabout Motivate from Superior Particulars N Percentage Highly satisfied 18 18 Satisfied 34 34 Neutral 38 38 Dissatisfied 5 5 Highly dissatisfied 5 5 Total 100 100 Interpretation: From the above table 18 percentage of respondents highly satisfied, 34 percentage of respondents satisfied, 38 percentage of respondents neutral, 5 percentage of respondents dissatisfied and remaining 5 percentage of respondents from highly dissatisfied from motivate for superior. 0 5 10 15 20 25 30 35 40 Highly satisfied Satisfied Neutral Dissatisfied Highly dissatisfied 18 34 38 5 5
  • 21.
    Table 21 Respondent’s opinionabout Use New Technology Particulars N Percentage Strongly agree 10 10 Agree 41 41 Neutral 39 39 Disagree 7 7 Strongly disagree 3 3 Total 100 100 Interpretation: From the above table 10 percentages of respondents strongly agree, 41 percentages of respondents agree, 39 percentages of respondents neutral, 7 percentages of respondents disagree and remaining 3 percentages of respondents strongly disagree from use new technology. 0 5 10 15 20 25 30 35 40 45 Strongly agree Agree Neutral Disagree Strongly disagree 10 41 39 7 3
  • 22.
    Table 22 Respondent’s opinionabout Training Method Particulars N Percentage Strongly agree 13 13 Agree 38 38 Neutral 35 35 Disagree 10 10 Strongly disagree 4 4 Total 100 100 Interpretation: From the above table 13 percentages of respondents strongly agree, 38 percentages of respondents agree, 35 percentages of respondents neutral, 10 percentages of respondents disagree and remaining 4 percentages of respondents strongly disagree from training methods. 0 5 10 15 20 25 30 35 40 Strongly agree Agree Neutral Disagree Strongly disagree 13 38 35 10 4
  • 23.
    Table 23 Respondent’s opinionabout Training Provide Current Job Particulars N Percentage Highly satisfied 17 17 Satisfied 37 37 Neutral 35 35 Dissatisfied 7 7 Highly dissatisfied 4 4 Total 100 100.0 Interpretation: From the above table 17 percentage of respondents highly satisfied, 37 percentage of respondents satisfied, 35 percentage of respondents neutral, 7 percentage of respondents dissatisfied and remaining 4 percentage of respondents from highly dissatisfied from training current job. 17 37 35 7 4 0 5 10 15 20 25 30 35 40 Highly satisfied Satisfied Neutral Dissatisfied Highly dissatisfied
  • 24.
    Table 24 Respondent’s opinionabout Career Development Particulars N Percentage Highly satisfied 19 19 Satisfied 40 40 Neutral 31 31 Dissatisfied 6 6 Highly dissatisfied 4 4 Total 100 100 Interpretation: From the above table 19 percentage of respondents highly satisfied, 40 percentage of respondents satisfied, 31 percentage of respondents neutral, 6 percentage of respondents dissatisfied and remaining 4 percentage of respondents from highly dissatisfied career development. 0 10 20 30 40 Highly satisfied Satisfied Neutral Dissatisfied Highly dissatisfied 19 40 31 6 4
  • 25.
    Table 25 Respondent’s opinionabout Use Skills and Ability Particulars N Percentage Strongly agree 20 20 Agree 45 45 Neutral 28 28 Disagree 5 5 Strongly disagree 2 2 Total 100 100 Interpretation: From the above table 20 percentages of respondents strongly agree, 45 percentages of respondents agree, 28 percentages of respondents neutral, 5 percentages of respondents disagree and remaining 2 percentages of respondents strongly disagree from use skills and ability. 0 5 10 15 20 25 30 35 40 45 Strongly agree Agree Neutral Disagree Strongly disagree 20 45 28 5 2
  • 26.
    Table 26 Respondent’s opinionabout Welfare and Safety Measures Particulars N Percentage Strongly agree 28 28 Agree 41 41 Neutral 23 23 Disagree 3 3 Strongly disagree 5 5 Total 100 100 Interpretation: From the above table 28 percentages of respondents strongly agree, 41 percentages of respondents agree, 23 percentages of respondents neutral, 3 percentages of respondents disagree and remaining 5 percentages of respondents strongly disagree from welfare and safety measures. 0 5 10 15 20 25 30 35 40 45 Strongly agree Agree Neutral Disagree Strongly disagree 28 41 23 3 5