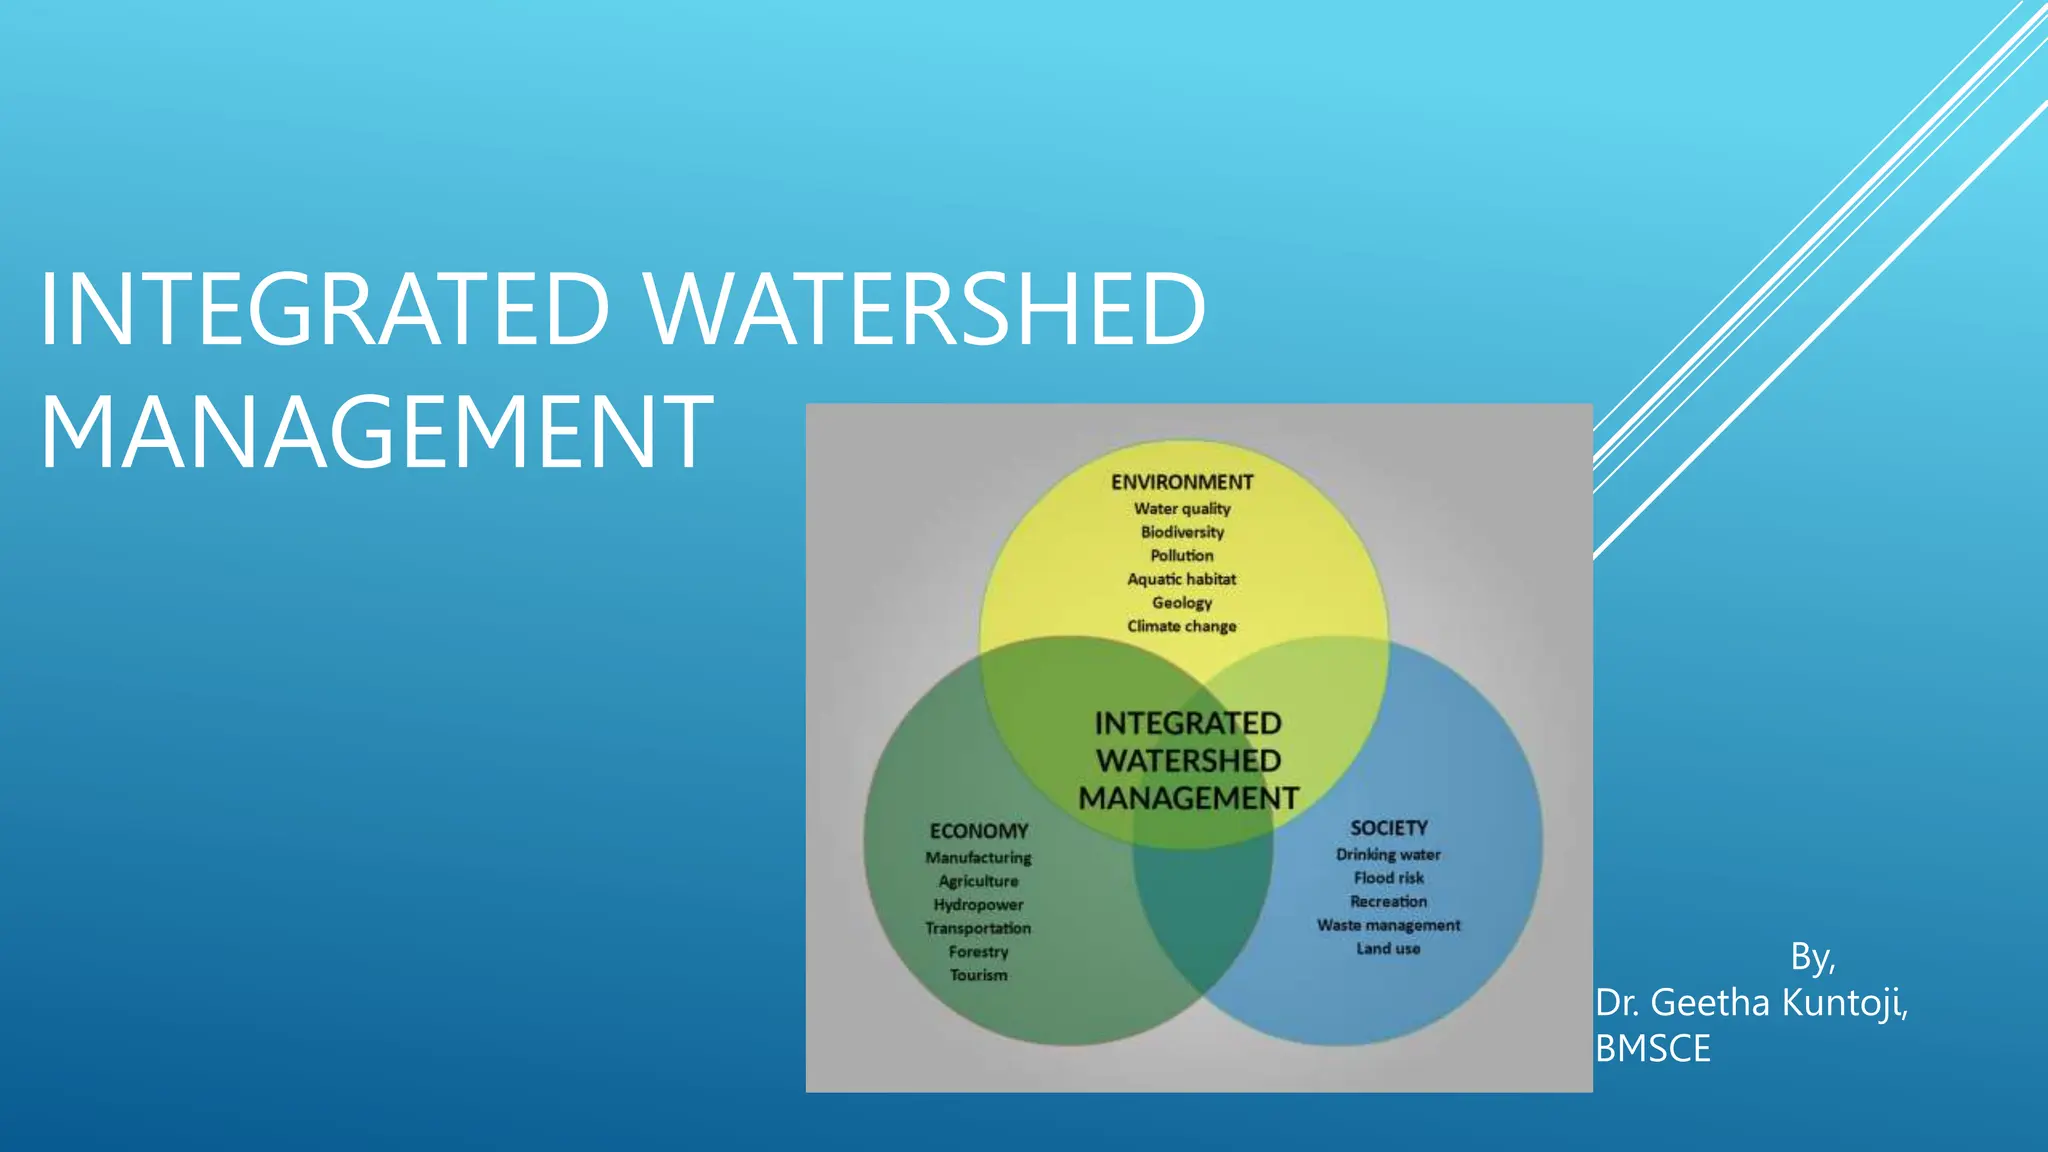
INTEGRATED WATERSHED
MANAGEMENT
By,
Dr. Geetha Kuntoji,
BMSCE
 IntegratedWater Resources Management
(IWRM) is a process that promotes the
coordinated development and management
of water, land and related resources in order
to maximize economic and social welfare in
an equitable manner without compromising
the sustainability of vital ecosystems.
 IWRM is based on the three principles: social
equity, economic efficiency and
environmental sustainability.
 Example: There are four central components
of integrated water resource management:
storm water management, wastewater
treatment, water supply, and conservation
existing water sources. Water Supply -
for human use comes from two primary
sources-surface water and groundwater.
Integrated Water Resource Management (IWRM),
also known as One Water, is an approach to
managing water that looks holistically at the planning
and management of water supply, wastewater, and
storm water systems. IWRM focuses on the water
cycle as a single connected system and promotes
coordinated development and management of water,
land, and related resources to maximize the economic
and social benefits while minimizing impacts on the
environment.
From this page, you can search for resources that
provide background, and policy guidance on
integrated water resource management, as well as
examples of regulations, reports, and functional
plans. And you can filter these search results by
resource type and various geographic characteristics.
Image by storyset on Freepik
Integratedresource management
(IRM), by definition, is “a
planning and decision making
process that coordinates
resource use so that the long-
term sustainable benefits are
optimized and conflicts among
users are minimized.
To strengthen institutions and
coordinating mechanisms for
land and land resources, so that
they are fully able to implement
policies and systems.
 Natural Resource Management (NRM) refers to the
sustainable utilization of major natural resources,
such as land, water, air, minerals, forests, fisheries,
and wild flora and fauna. Together, these resources
provide the ecosystem services that provide better
quality to human life.IWRM is based on the three
principles: social equity, economic efficiency and
environmental sustainability.
 sustainable management of land resources;
 maintaining and enhancing water assets;
 protecting and enhancing the marine and coastal
environment;
 conserving and recovering biodiversity;
 enhancing skills, capacity, and engagement;
 delivering high-quality planning that leads to effective
action.
 Case Study: Current integrated catchment
management policy and management settings in the
Murray–Darling Basin by John Riddiford 2021
Agricultural Practice: The main aim of watershed management
is to conserve the soil, plant, and water resources of a
catchment while benefiting humanity. All environmental,
social, and economic concerns are combined to treat watersheds
in an integrated manner.
Watershed development refers to the conservation;
regeneration and the judicious use of all the natural
resources particularly land, water, vegetation and
animals and human development within the
watershed
M.D. Tomer, in Encyclopedia of Soils in the Environment, 2005
 Integrated farming is a form of agriculture aimed at
minimizing the use of inputs from outside the farm by
implementing a variety of production enterprises, long
and diversified crop rotations, crop residue or animal
excreta restitution to the soil.
 Soil conservation is the practice of minimizing soil loss
while maximizing agricultural production. It includes
agronomic or mechanical practices aimed at reducing
erosion to natural, geological rates, in equilibrium with
long-term soil formation rates. maintaining and
enhancing water assets;
 “Soil erosion is the natural process in which the topsoil
of a field is carried away by physical sources such as
wind and water.”
 Erosion is the removal and transport of soil by wind,
water or mechanical means. This can happen naturally
in three ways: surface erosion, gully erosion, and soil
mass movement. Surface erosion is caused primarily by
the action of raindrops and wind across the soil surface.
Raindrops are the primary agents of erosion.
 Conservation Tillage. Conservation tillage consists of a variety of
practices used in agriculture to reduce wind and water erosion.
 Contour Farming, Strip Cropping, Windbreaks,Crop Rotation, Cover
Conjunctive Water Management is an approach to water
resources management in which surface water, groundwater and
other components of the water cycle are considered as one
single resource, and therefore are managed in closest possible
coordination, in order to maximize overall benefits from water
at the short.
Conjunctive use is a term used to describe the planned use of
both surface water and groundwater resources to maximize total
water availability in a region long-term.
The two principal components of a conjunctive water
management program are recharging of the groundwater basin
and recovery of water through groundwater pumping.
Rainwater harvesting (RWH) is the collection and storage of
rain, rather than allowing it to run off. Rainwater is collected
from a roof-like surface and redirected to a tank, cistern, deep
pit (well, shaft, or borehole), aquifer, or a reservoir with
percolation, so that it seeps down and restores the ground water.
 Rainwater harvesting systems consists of the following
components:
 Catchment- Used to collect and store the captured rainwater.
 Conveyance system – It is used to transport the harvested water
from the catchment to the recharge zone.
 Flush- It is used to flush out the first spell of rain.
 Filter – Used for filtering the collected rainwater and removing
pollutants.
 Tanks and the recharge structures: Used to store the filtered water
which is ready to use.
 The process of rainwater harvesting involves the collection and the
storage of rainwater with the help of artificially designed systems
that run off naturally or man-made catchment areas like- the
rooftop, compounds, rock surface, hill slopes, artificially repaired
impervious or semi-pervious land surface.
 Several factors play a vital role in the amount of water harvested.
Some of these factors are:
The quantum of runoff, Features of the catchments, Impact on the
environment, Availability of the technology, The capacity of the
storage tanks, Types of the roof, its slope and its materials
 The frequency, quantity and the quality of the rainfall
 The speed and ease with which the rainwater penetrates through
the subsoil to recharge the groundwater.
Water reuse (also commonly known as water recycling or water
reclamation) reclaims water from a variety of sources then treats and
reuses it for beneficial purposes such as agriculture and irrigation,
potable water supplies, groundwater replenishment, industrial
processes, and environmental restoration.
How to : Turn off the taps while brushing teeth and use small mug while
shaving. Use toilets which require less water for flushing. We should
make sure that not even a single tap in the home is leaking. Don't throw
the waste water in the open as the same may be used for watering plants
at home.
Community-based natural resource management: an approach to natural
resource management that involves the full participation of indigenous
peoples' and local communities and resource users in decision-making
activities, and the incorporation of local institutions, customary
practices, and knowledge systems.
Scholars agreed that greater efficiency, efficacy and legitimacy of
policies and local democracy can be achieved by meaningfully
involving the local communities in transboundary water governance and
for building transboundary flood resilient communities
The people who participate in watershed management are villagers,
farmers and common people. They are the participants, beneficiaries
and promoters of any development works in the watershed. Their full
cooperation and participation is at the root of success of any project.
They may participate in different modes.
sector or other entity. This participation allows major risks to be spread
among several different parties to ensure one group does not have full
financial responsibility.
The private sector is an essential partner in sustainable water
management and governance, i.e. the foundation on which Sustainable
Development Goal (SDG) as a whole (“ensure availability and
sustainable management of water and sanitation for all”) and the
broader water-related goals can be met: for food, health.
The private water sector plays an important role in financing water
resource management through investment in service delivery in water
supply and sanitation, and irrigation (typically when the source for
irrigation water is groundwater).
Moving from economic growth to sustainable development is the
imperative of our time. This shift will not happen in a water-insecure
world. In Securing Water, Sustaining Growth, the Organisation for
Economic Co-operation and Development and the Global Water
Partnership estimate that water risks cost more.
https://www.intechopen.com/chapters/72574 : Case study on Unit 1
arid and semi arid regions watershed management.
https://www.slideshare.net/RambabuPalaka/introduction-to-watershed-
management?next_slideshow=57105276 and instruction to Watershed
Management unit 1.
Physiographic Characteristics of Watershed
The Watershed
A watershed represents land area usually contains a well-connected stream
network and well defined outlet or discharge point, where the representative area
drains when rainfall occurs. In other words, area of the land over which runoff
generates and then drains into stream at a given location is called watershed or
catchment area. Watershed is also known as drainage basin, catchment area etc.
The Watershed
(Source:
http://fergusonfoundation.
org/btw-students/what-is-a-
watershed/accessed on 2
October 2013)
1 Area of the Watershed
The area of watershed is also known as the drainage area and it is the most
important watershed characteristic for hydrologic analysis. The runoff from
watershed is generated after the interaction of precipitation with the watershed
area. Watershed area is important parameters in hydrological model to estimate the
volume of runoff. The area of watershed is delineated either manually using
toposheets or through digital elevation model derived using geographic
information system (GIS). Once the watershed has been delineated, its area can be
determined using planimeter or can be approximated using GIS.
Delineation of Watershed
(Source: http://cas.umkc.
edu/geosciences/env-
sci/module9/h20shed.
GIF accessed on 2 October 2013)
The size of a watershed may vary from a few hectares to thousands of
square kilometer. Table 1 provides a system of classifying watersheds at
different levels of aggregation.
Category Number
Size Ranges
('oooha.)
Regions 6 25,000-100,000
Basins 35 3,000-25,000
Catchments 112 1,000-3,000
Sub-Catchments 500 200-1,000
Watersheds 3,237 50-200
Sub-watersheds 12,000 10-50
Milli-watersheds 72,000 1-10
Micro-watersheds 400,000 0.5-1
System of Classification of Watersheds in India (Source: Bali, 1979)
Length of Watershed
Length of watershed is defined as the longest distance between
outlet and any point on the perimeter. This length is usually
measured to compute the time dependent parameters of watershed
such as time of concentration (time taken to reach the runoff
generated from remotest point of watershed to outlet).Time
dependent parameters of watershed are useful in determining time
for peak flow required to establish the hydrograph of the watershed.
The watershed length is therefore measured along the principal flow
path from the watershed perimeter to the outlet. Since the channel
does not start from the watershed boundary, it is determined by
extending the main channel to the boundary and then measuring the
length of the channel.
Example.1: Main channel passes through points A, B, D, E and J.
The length of AB is 1.8 km, BD is 1.3 km, DE is 1.7 km and EJ is
1.8 km. The remotest point of the watershed is K which is 0.8 km
far from the start of main channel, i.e., point J. What will be the
watershed length?
Slope of Watershed
Watershed slope reflects the rate of change of elevation with respect to distance along the
principal flow path. It is usually calculated as the elevation difference between the highest
and lowest elevation of the point of the watershed divided by watershed length. Watershed
slope affects time of concentration, as well as time to peak.
Example 2: In continuation of example 1: K, A and J is having elevations of 578m, 316 m,
532 m respectively. Calculate the watershed slope, channel slope and overland slope?
Soln: Watershed slope = elevation difference between point K and A divided by watershed
length i.e. (578-316)/7.4 = 262/7.4 = 35.4 m per km = 3.54%
Channel slope = elevation difference between point J and A divided by channel length i.e.
(532-316)/6.6 = 216/6.6 = 32.73 m per km = 3.27%
Overland slope = elevation difference between point K and J divided by length of overland
flow i.e. (578-532)/0.8 = 57.5 m per km = 5.75%
In this case overland slope is higher than channel slope, hence on field soil conservation
activities such as trenching and bunding etc. should be prioritize over drop structures etc.
Shape of Watershed
Watershed shape basically determines the shape of the
resulting hydrograph. Watersheds have an infinite variety
of shapes, and the shape supposedly reflects the way that
runoff will accumulated at the outlet. A circular
watershed would result in runoff from various parts of
the watershed reaching the outlet at the same time. An
elliptical watershed having the outlet at one end of the
major axis and having the same area as the circular
watershed would cause the runoff to be spread out over
time, thus producing a smaller flood peak than that of the
circular watershed. Fig showing the basin effects on
hydrograph shape.
(Source:http://www.bbc.co.uk/scotland/education/int/geog/rivers/
images/hydrographs/hydro2.gif accessed on 3 October 2013)
Stream Order
The order of stream is hierarchical arrangement of different streams
in the watershed. The first order streams are the originating streams
and mostly in the forms of G1 or G2 type gullies. On confluence of
two first order streams, downstream is called second order stream.
If second order stream is confluences with first order stream, the
stream still is second order. However, if two second order streams
confluences, then 3 order stream comes in existence. The general
rule is that when two same order stream confluences, next order
stream comes into existence. Most of the watersheds are having 3rd
order streams. However, the big catchment, the stream order may
be of 5th and higher.
Formula to determine different shape factor of watersheds
And its effect on hydrograph (Source: Chow, 1964)
A number of watershed
parameters have been
developed to reflect
basin shape. Following
are a few typical
parameters:
SL.
No
Characteristics Formula Effect on hydrograph shape (refer figure below)
1 Stream order Hierarchical
Higher stream order increases time of concentration,
time to peak and base time
2 Stream length Length of the stream
Higher the length, higher the time of concentration,
time to peak and base time
3 Bifurcation ratio
Rb = Bifurcation ratio,
nu = number of stream
segment of order u
nu+1 = number of stream
segment of order u+1
Higher the length, higher the time of concentration,
time to peak and base time
4 Relief ratio
Rh = relief ratio;
H = total relief of watershed
in
kilometer and
Lb = watershed length, km
Higher relief reduces time to peak and increases peak
discharge
5 Drainage density
D = drainage density;
Lu = total stream length of all
orders, km and
A = watershed area, km2
Higher drainage density increase time to peak and peak
discharge
6 Form factor
Rf = Form factor,
A = watershed area, km2
Lb= watershed length, km
Higher form factor increases peak discharge and
reduces time of concentration and base time
7 Circularity ratio
Rc = circularity ration,
A = watershed area,km2 and
P watershed perimeter, km
As circulatory ration approaches to unity, time of
concentration and peak discharge increases.
8 Elongation ratio
Re = Elongation ratio,
A = area of watershed, km2
Lb = watershed length, km
Higher elongation ration increases concentration time
and time to peak.
9
Length of
overland flow
(Horton, 1945)
Lg = length of overland flow,
km
D = Drainage density, km-1
More length of overland flow increases time of
concentration, time to peak and reduces peak discharge.
Steps for Watershed Delineation
Step 1. Identify the point with respect to which the watershed is to be marked(the exit point
or outlet). In Fig, this is the point marked "A".
(Source: http://echo2.epfl.ch/VICAIRE/mod_1a/chapt_
8/pictures/Figure87.gif, accessed on 3 October 2013)
Watershed Maps
There are several watershed maps describing different characteristics of
watershed. These are also known as thematic maps. The map include
elevation map (contour map), land use/land cover map, slope map, soil
map, flow direction map, watershed delineation map etc. These
thematic maps are overlaid in order to determine the specific
characteristics of watershed. The GIS is often used in the overlaying
process and map calculations.
Delineating Watershed Boundary from Toposheet
Topographical maps provide information about the lay of the land. The
special feature of topographical maps (or toposheets) is that along with
direction, scale and legend, they also provide information about the
relief of the land using contour lines(contour lines are imaginary lines
joining points on the same elevation). It also contains the information
of drainage network, water harvesting structures, land use, soil type
villages and urban settlements, roads.
A typical toposheet is shown in Fig.Toposheets are made on the basis of latitudes and
longitudes. Every part of India has been mapped by the Survey of India, using latitudes
and longitudes to classify the country into a grid. Toposheets are available mainly on 3
scales: 1:1,000,000, 1:2, 50,000 and 1:50,000. For some special areas toposheets on
1:25,000 are also available.
(Source: http://www.lib.utexas.edu/maps/ams/india/ams
150117indiapakistan.jpg , accessed on 3 October 2013) (Source: BACPE, 2007)
Step 2. Mark out drainage lines of various orders, which drain into this common point
(Fig.).The way to do this is to begin from the exit point (A) and move along the drainage
line to its origin. Mark out nearby drainage lines which do not drain to this common point.
Different colours can be used to distinguish drainage lines belonging to our watershed from
drainage lines outside our area.
Step 3. From the exit point, draw a line around the drainage system, enclosing all drainage
lines which drain to point A and leaving out other drainage lines which do not drain to point
A (see Fig). This boundary line will terminate at the exit point. This line demarcating the
watershed boundary is called a ridge line. A ridge line is an imaginary line joining all points
of higher elevation in a selected watershed and separating the watershed from other
watersheds
Precautions
•Remember to be very careful when outlining drainage lines,
particularly when including drainage lines which fall in the watershed
and leaving out those that do not.
•Remember that a toposheet shows several other lines (such as roads,
telephone lines), which on a photocopy will look similar to a contour
line. So exercise care.
•Ensure that the watershed boundary (the ridge line) never crosses any
drainage line inside the watershed. If this has happened, be sure that it
is a mistake and correct it.
Automatic Delineation of Watershed
The watersheds can also be delineated automatically using modern
computing tools such as GIS. GIS needs digital elevation map (DEM)
for automatic delineation of watershed. In this case the contour features
from toposheets are scanned and accordingly digitized using either
screen digitizer or table digitizer. Respective elevations are assigned to
the digitized contour. After elevations are assigned, the outlet is defined
using latitude and longitude.
• The GIS calculates the flow direction map, slope map, flow accumulation map and
computes drainage network and using these maps along with drainage network,
• GIS finally delineate watershed. However, watershed delineated using GIS should be
cross checked with the toposheet. Nowadays DEM are available at various websites as a
free resource (eg: http://www.bhuvan.nrsc.gov.in/bhuvan_links.php, etc.), such as SRTM
(Shuttle Radar Topographic Mapping) or ASTER (Advanced Space born Thermal
Emission and Reflection) and can be used to delineate the watershed. The DEM from
SRTM or ASTER source usually has 1 meter elevation interval and 30 and 90 m
resolution in grid form. The 30 m resolution suggest singular elevation value for 0.09 ha
(30mX30m) and similarly 90 meter resolution suggest singular elevation value for 0.81
ha (90mX90m). Though the automatic delineation is free from human interventions and
errors and produces same result every time. However, these are limitations as well.
Accuracy is largely dependent on resolution (Higher the resolution, greater the accuracy).
Higher resolution data requires higher computing and data transfer infrastructure along
with highly skilled personnel. This may significantly increase the cost of delineation.
Step 2 Figure
Step 3 Figure
References
•Baba Amte Center for People’s Empowerment. (2007). Watershed manual for National Rural Employment
Guarantee Act. Min. of Rural Development. Govt. of India.
•Bali, Y.P. (1979). Watershed Management—Concept and Strategy, in P.N.Bhatt (ed.), Watershed Management,
Lectures Delivered at Short Course, Dehradun: Central Soil and Water Conservation Research and Training
Institute.
•Chow, V.T. (1964). Applied Hydrology. McGraw-Hill, New York.
•Das, G. (2000). Hydrology and Soil Conservation Engineering. Prentice Hall of India, New Delhi, India.
•Subramanya, K. (2010). Engineering Hydrology. 3rd ed. Tata McGraw-Hill, New Delhi, India.
Internet References
•http://www.thebigger.com/biology/resources/what-is-the-conservation-of-soil/ : accessed on 08.11.2012
•http://www.mbgnet.net/fresh/rivers/shed.htm:accessed on 08.11.2012
•http://fergusonfoundation.org/btw-students/what-is-a-watershed/ : accessed on 03.10.2013
•http://cas.umkc.edu/geosciences/env-sci/module9/h20shed.GIF : accessed on 03.10.2013
•http://www.bbc.co.uk/scotland/education/int/geog/rivers/images/hydrographs/hydro2.gif :
accessed on 03.10.2013
•http://echo2.epfl.ch/VICAIRE/mod_1a/chapt_8/pictures/Figure87.gif : accessed on 03.10.2013
UNIT 2: INTRODUCTION
What is watershed Modelling approach?
A watershed system model simulates both the natural and human systems of a
watershed and the interactions between different components of the human-nature
system. Modeling natural systems usually involves hydrology, ecology,
meteorology, land surface science, cryospheric science, and other natural science
disciplines.
Global advances in economies and standards of living have resulted in a growing
dependency on water resources. Many societies have experienced water scarcity as
a result of current patterns with societal advances; these are associated with factors
such as population growth, increased urbanization and industrialization, increased
energy use, increased irrigation associated with advances in agriculture
productivity, desertification, global warming and poor water quality. Improved
understanding of how each of these factors influences water supply, demand and
quality require improved abilities to understand the underlying processes and their
impact on water availability and use. This entails employing a holistic approach
which integrates hydrologic processes at the watershed scale to determine an
overall watershed response to both user demands and changing climates.
Read from the link about different models
https://www.intechopen.com/chapters/43179
System concept of watershed Modeling:
Watershed modelling is an essential component for water resources management.
Surface hydrologic response in a watershed can be thought as a combination of
routing elements and runoff production units. This study develops a watershed
model using control system concept in MATLAB Simulink module.
What are the different hydrological processes occurring in a watershed?
1. Rainfall-runoff modelling describes the process of generating streamflow
hydrograph resulted from the excess rainfall onto the catchment, after considering
various hydrological processes such as precipitation, evaporation, transpiration,
groundwater, and interflow
2. These processes include precipitation, interception, evaporation, infiltration, soil
moisture storage and hillslope flow, overland flow, and groundwater. The
processes and their spatial and temporal variability are described at both the stand
and watershed scales.
3.

INTEGRATED WATERSHED MANAGEMENT by Geetha K.pptx

  • 1.
  • 2.
     IntegratedWater ResourcesManagement (IWRM) is a process that promotes the coordinated development and management of water, land and related resources in order to maximize economic and social welfare in an equitable manner without compromising the sustainability of vital ecosystems.  IWRM is based on the three principles: social equity, economic efficiency and environmental sustainability.  Example: There are four central components of integrated water resource management: storm water management, wastewater treatment, water supply, and conservation existing water sources. Water Supply - for human use comes from two primary sources-surface water and groundwater. Integrated Water Resource Management (IWRM), also known as One Water, is an approach to managing water that looks holistically at the planning and management of water supply, wastewater, and storm water systems. IWRM focuses on the water cycle as a single connected system and promotes coordinated development and management of water, land, and related resources to maximize the economic and social benefits while minimizing impacts on the environment. From this page, you can search for resources that provide background, and policy guidance on integrated water resource management, as well as examples of regulations, reports, and functional plans. And you can filter these search results by resource type and various geographic characteristics. Image by storyset on Freepik Integratedresource management (IRM), by definition, is “a planning and decision making process that coordinates resource use so that the long- term sustainable benefits are optimized and conflicts among users are minimized. To strengthen institutions and coordinating mechanisms for land and land resources, so that they are fully able to implement policies and systems.
  • 3.
     Natural ResourceManagement (NRM) refers to the sustainable utilization of major natural resources, such as land, water, air, minerals, forests, fisheries, and wild flora and fauna. Together, these resources provide the ecosystem services that provide better quality to human life.IWRM is based on the three principles: social equity, economic efficiency and environmental sustainability.  sustainable management of land resources;  maintaining and enhancing water assets;  protecting and enhancing the marine and coastal environment;  conserving and recovering biodiversity;  enhancing skills, capacity, and engagement;  delivering high-quality planning that leads to effective action.  Case Study: Current integrated catchment management policy and management settings in the Murray–Darling Basin by John Riddiford 2021 Agricultural Practice: The main aim of watershed management is to conserve the soil, plant, and water resources of a catchment while benefiting humanity. All environmental, social, and economic concerns are combined to treat watersheds in an integrated manner. Watershed development refers to the conservation; regeneration and the judicious use of all the natural resources particularly land, water, vegetation and animals and human development within the watershed M.D. Tomer, in Encyclopedia of Soils in the Environment, 2005
  • 4.
     Integrated farmingis a form of agriculture aimed at minimizing the use of inputs from outside the farm by implementing a variety of production enterprises, long and diversified crop rotations, crop residue or animal excreta restitution to the soil.  Soil conservation is the practice of minimizing soil loss while maximizing agricultural production. It includes agronomic or mechanical practices aimed at reducing erosion to natural, geological rates, in equilibrium with long-term soil formation rates. maintaining and enhancing water assets;  “Soil erosion is the natural process in which the topsoil of a field is carried away by physical sources such as wind and water.”  Erosion is the removal and transport of soil by wind, water or mechanical means. This can happen naturally in three ways: surface erosion, gully erosion, and soil mass movement. Surface erosion is caused primarily by the action of raindrops and wind across the soil surface. Raindrops are the primary agents of erosion.  Conservation Tillage. Conservation tillage consists of a variety of practices used in agriculture to reduce wind and water erosion.  Contour Farming, Strip Cropping, Windbreaks,Crop Rotation, Cover Conjunctive Water Management is an approach to water resources management in which surface water, groundwater and other components of the water cycle are considered as one single resource, and therefore are managed in closest possible coordination, in order to maximize overall benefits from water at the short. Conjunctive use is a term used to describe the planned use of both surface water and groundwater resources to maximize total water availability in a region long-term. The two principal components of a conjunctive water management program are recharging of the groundwater basin and recovery of water through groundwater pumping. Rainwater harvesting (RWH) is the collection and storage of rain, rather than allowing it to run off. Rainwater is collected from a roof-like surface and redirected to a tank, cistern, deep pit (well, shaft, or borehole), aquifer, or a reservoir with percolation, so that it seeps down and restores the ground water.
  • 5.
     Rainwater harvestingsystems consists of the following components:  Catchment- Used to collect and store the captured rainwater.  Conveyance system – It is used to transport the harvested water from the catchment to the recharge zone.  Flush- It is used to flush out the first spell of rain.  Filter – Used for filtering the collected rainwater and removing pollutants.  Tanks and the recharge structures: Used to store the filtered water which is ready to use.  The process of rainwater harvesting involves the collection and the storage of rainwater with the help of artificially designed systems that run off naturally or man-made catchment areas like- the rooftop, compounds, rock surface, hill slopes, artificially repaired impervious or semi-pervious land surface.  Several factors play a vital role in the amount of water harvested. Some of these factors are: The quantum of runoff, Features of the catchments, Impact on the environment, Availability of the technology, The capacity of the storage tanks, Types of the roof, its slope and its materials  The frequency, quantity and the quality of the rainfall  The speed and ease with which the rainwater penetrates through the subsoil to recharge the groundwater. Water reuse (also commonly known as water recycling or water reclamation) reclaims water from a variety of sources then treats and reuses it for beneficial purposes such as agriculture and irrigation, potable water supplies, groundwater replenishment, industrial processes, and environmental restoration. How to : Turn off the taps while brushing teeth and use small mug while shaving. Use toilets which require less water for flushing. We should make sure that not even a single tap in the home is leaking. Don't throw the waste water in the open as the same may be used for watering plants at home. Community-based natural resource management: an approach to natural resource management that involves the full participation of indigenous peoples' and local communities and resource users in decision-making activities, and the incorporation of local institutions, customary practices, and knowledge systems. Scholars agreed that greater efficiency, efficacy and legitimacy of policies and local democracy can be achieved by meaningfully involving the local communities in transboundary water governance and for building transboundary flood resilient communities The people who participate in watershed management are villagers, farmers and common people. They are the participants, beneficiaries and promoters of any development works in the watershed. Their full cooperation and participation is at the root of success of any project. They may participate in different modes.
  • 6.
    sector or otherentity. This participation allows major risks to be spread among several different parties to ensure one group does not have full financial responsibility. The private sector is an essential partner in sustainable water management and governance, i.e. the foundation on which Sustainable Development Goal (SDG) as a whole (“ensure availability and sustainable management of water and sanitation for all”) and the broader water-related goals can be met: for food, health. The private water sector plays an important role in financing water resource management through investment in service delivery in water supply and sanitation, and irrigation (typically when the source for irrigation water is groundwater). Moving from economic growth to sustainable development is the imperative of our time. This shift will not happen in a water-insecure world. In Securing Water, Sustaining Growth, the Organisation for Economic Co-operation and Development and the Global Water Partnership estimate that water risks cost more. https://www.intechopen.com/chapters/72574 : Case study on Unit 1 arid and semi arid regions watershed management. https://www.slideshare.net/RambabuPalaka/introduction-to-watershed- management?next_slideshow=57105276 and instruction to Watershed Management unit 1.
  • 7.
    Physiographic Characteristics ofWatershed The Watershed A watershed represents land area usually contains a well-connected stream network and well defined outlet or discharge point, where the representative area drains when rainfall occurs. In other words, area of the land over which runoff generates and then drains into stream at a given location is called watershed or catchment area. Watershed is also known as drainage basin, catchment area etc. The Watershed (Source: http://fergusonfoundation. org/btw-students/what-is-a- watershed/accessed on 2 October 2013) 1 Area of the Watershed The area of watershed is also known as the drainage area and it is the most important watershed characteristic for hydrologic analysis. The runoff from watershed is generated after the interaction of precipitation with the watershed area. Watershed area is important parameters in hydrological model to estimate the volume of runoff. The area of watershed is delineated either manually using toposheets or through digital elevation model derived using geographic information system (GIS). Once the watershed has been delineated, its area can be determined using planimeter or can be approximated using GIS. Delineation of Watershed (Source: http://cas.umkc. edu/geosciences/env- sci/module9/h20shed. GIF accessed on 2 October 2013) The size of a watershed may vary from a few hectares to thousands of square kilometer. Table 1 provides a system of classifying watersheds at different levels of aggregation. Category Number Size Ranges ('oooha.) Regions 6 25,000-100,000 Basins 35 3,000-25,000 Catchments 112 1,000-3,000 Sub-Catchments 500 200-1,000 Watersheds 3,237 50-200 Sub-watersheds 12,000 10-50 Milli-watersheds 72,000 1-10 Micro-watersheds 400,000 0.5-1 System of Classification of Watersheds in India (Source: Bali, 1979)
  • 8.
    Length of Watershed Lengthof watershed is defined as the longest distance between outlet and any point on the perimeter. This length is usually measured to compute the time dependent parameters of watershed such as time of concentration (time taken to reach the runoff generated from remotest point of watershed to outlet).Time dependent parameters of watershed are useful in determining time for peak flow required to establish the hydrograph of the watershed. The watershed length is therefore measured along the principal flow path from the watershed perimeter to the outlet. Since the channel does not start from the watershed boundary, it is determined by extending the main channel to the boundary and then measuring the length of the channel. Example.1: Main channel passes through points A, B, D, E and J. The length of AB is 1.8 km, BD is 1.3 km, DE is 1.7 km and EJ is 1.8 km. The remotest point of the watershed is K which is 0.8 km far from the start of main channel, i.e., point J. What will be the watershed length? Slope of Watershed Watershed slope reflects the rate of change of elevation with respect to distance along the principal flow path. It is usually calculated as the elevation difference between the highest and lowest elevation of the point of the watershed divided by watershed length. Watershed slope affects time of concentration, as well as time to peak. Example 2: In continuation of example 1: K, A and J is having elevations of 578m, 316 m, 532 m respectively. Calculate the watershed slope, channel slope and overland slope? Soln: Watershed slope = elevation difference between point K and A divided by watershed length i.e. (578-316)/7.4 = 262/7.4 = 35.4 m per km = 3.54% Channel slope = elevation difference between point J and A divided by channel length i.e. (532-316)/6.6 = 216/6.6 = 32.73 m per km = 3.27% Overland slope = elevation difference between point K and J divided by length of overland flow i.e. (578-532)/0.8 = 57.5 m per km = 5.75% In this case overland slope is higher than channel slope, hence on field soil conservation activities such as trenching and bunding etc. should be prioritize over drop structures etc. Shape of Watershed Watershed shape basically determines the shape of the resulting hydrograph. Watersheds have an infinite variety of shapes, and the shape supposedly reflects the way that runoff will accumulated at the outlet. A circular watershed would result in runoff from various parts of the watershed reaching the outlet at the same time. An elliptical watershed having the outlet at one end of the major axis and having the same area as the circular watershed would cause the runoff to be spread out over time, thus producing a smaller flood peak than that of the circular watershed. Fig showing the basin effects on hydrograph shape. (Source:http://www.bbc.co.uk/scotland/education/int/geog/rivers/ images/hydrographs/hydro2.gif accessed on 3 October 2013)
  • 9.
    Stream Order The orderof stream is hierarchical arrangement of different streams in the watershed. The first order streams are the originating streams and mostly in the forms of G1 or G2 type gullies. On confluence of two first order streams, downstream is called second order stream. If second order stream is confluences with first order stream, the stream still is second order. However, if two second order streams confluences, then 3 order stream comes in existence. The general rule is that when two same order stream confluences, next order stream comes into existence. Most of the watersheds are having 3rd order streams. However, the big catchment, the stream order may be of 5th and higher. Formula to determine different shape factor of watersheds And its effect on hydrograph (Source: Chow, 1964) A number of watershed parameters have been developed to reflect basin shape. Following are a few typical parameters: SL. No Characteristics Formula Effect on hydrograph shape (refer figure below) 1 Stream order Hierarchical Higher stream order increases time of concentration, time to peak and base time 2 Stream length Length of the stream Higher the length, higher the time of concentration, time to peak and base time 3 Bifurcation ratio Rb = Bifurcation ratio, nu = number of stream segment of order u nu+1 = number of stream segment of order u+1 Higher the length, higher the time of concentration, time to peak and base time 4 Relief ratio Rh = relief ratio; H = total relief of watershed in kilometer and Lb = watershed length, km Higher relief reduces time to peak and increases peak discharge 5 Drainage density D = drainage density; Lu = total stream length of all orders, km and A = watershed area, km2 Higher drainage density increase time to peak and peak discharge 6 Form factor Rf = Form factor, A = watershed area, km2 Lb= watershed length, km Higher form factor increases peak discharge and reduces time of concentration and base time 7 Circularity ratio Rc = circularity ration, A = watershed area,km2 and P watershed perimeter, km As circulatory ration approaches to unity, time of concentration and peak discharge increases. 8 Elongation ratio Re = Elongation ratio, A = area of watershed, km2 Lb = watershed length, km Higher elongation ration increases concentration time and time to peak. 9 Length of overland flow (Horton, 1945) Lg = length of overland flow, km D = Drainage density, km-1 More length of overland flow increases time of concentration, time to peak and reduces peak discharge.
  • 10.
    Steps for WatershedDelineation Step 1. Identify the point with respect to which the watershed is to be marked(the exit point or outlet). In Fig, this is the point marked "A". (Source: http://echo2.epfl.ch/VICAIRE/mod_1a/chapt_ 8/pictures/Figure87.gif, accessed on 3 October 2013) Watershed Maps There are several watershed maps describing different characteristics of watershed. These are also known as thematic maps. The map include elevation map (contour map), land use/land cover map, slope map, soil map, flow direction map, watershed delineation map etc. These thematic maps are overlaid in order to determine the specific characteristics of watershed. The GIS is often used in the overlaying process and map calculations. Delineating Watershed Boundary from Toposheet Topographical maps provide information about the lay of the land. The special feature of topographical maps (or toposheets) is that along with direction, scale and legend, they also provide information about the relief of the land using contour lines(contour lines are imaginary lines joining points on the same elevation). It also contains the information of drainage network, water harvesting structures, land use, soil type villages and urban settlements, roads. A typical toposheet is shown in Fig.Toposheets are made on the basis of latitudes and longitudes. Every part of India has been mapped by the Survey of India, using latitudes and longitudes to classify the country into a grid. Toposheets are available mainly on 3 scales: 1:1,000,000, 1:2, 50,000 and 1:50,000. For some special areas toposheets on 1:25,000 are also available. (Source: http://www.lib.utexas.edu/maps/ams/india/ams 150117indiapakistan.jpg , accessed on 3 October 2013) (Source: BACPE, 2007) Step 2. Mark out drainage lines of various orders, which drain into this common point (Fig.).The way to do this is to begin from the exit point (A) and move along the drainage line to its origin. Mark out nearby drainage lines which do not drain to this common point. Different colours can be used to distinguish drainage lines belonging to our watershed from drainage lines outside our area. Step 3. From the exit point, draw a line around the drainage system, enclosing all drainage lines which drain to point A and leaving out other drainage lines which do not drain to point A (see Fig). This boundary line will terminate at the exit point. This line demarcating the watershed boundary is called a ridge line. A ridge line is an imaginary line joining all points of higher elevation in a selected watershed and separating the watershed from other watersheds
  • 11.
    Precautions •Remember to bevery careful when outlining drainage lines, particularly when including drainage lines which fall in the watershed and leaving out those that do not. •Remember that a toposheet shows several other lines (such as roads, telephone lines), which on a photocopy will look similar to a contour line. So exercise care. •Ensure that the watershed boundary (the ridge line) never crosses any drainage line inside the watershed. If this has happened, be sure that it is a mistake and correct it. Automatic Delineation of Watershed The watersheds can also be delineated automatically using modern computing tools such as GIS. GIS needs digital elevation map (DEM) for automatic delineation of watershed. In this case the contour features from toposheets are scanned and accordingly digitized using either screen digitizer or table digitizer. Respective elevations are assigned to the digitized contour. After elevations are assigned, the outlet is defined using latitude and longitude. • The GIS calculates the flow direction map, slope map, flow accumulation map and computes drainage network and using these maps along with drainage network, • GIS finally delineate watershed. However, watershed delineated using GIS should be cross checked with the toposheet. Nowadays DEM are available at various websites as a free resource (eg: http://www.bhuvan.nrsc.gov.in/bhuvan_links.php, etc.), such as SRTM (Shuttle Radar Topographic Mapping) or ASTER (Advanced Space born Thermal Emission and Reflection) and can be used to delineate the watershed. The DEM from SRTM or ASTER source usually has 1 meter elevation interval and 30 and 90 m resolution in grid form. The 30 m resolution suggest singular elevation value for 0.09 ha (30mX30m) and similarly 90 meter resolution suggest singular elevation value for 0.81 ha (90mX90m). Though the automatic delineation is free from human interventions and errors and produces same result every time. However, these are limitations as well. Accuracy is largely dependent on resolution (Higher the resolution, greater the accuracy). Higher resolution data requires higher computing and data transfer infrastructure along with highly skilled personnel. This may significantly increase the cost of delineation. Step 2 Figure Step 3 Figure References •Baba Amte Center for People’s Empowerment. (2007). Watershed manual for National Rural Employment Guarantee Act. Min. of Rural Development. Govt. of India. •Bali, Y.P. (1979). Watershed Management—Concept and Strategy, in P.N.Bhatt (ed.), Watershed Management, Lectures Delivered at Short Course, Dehradun: Central Soil and Water Conservation Research and Training Institute. •Chow, V.T. (1964). Applied Hydrology. McGraw-Hill, New York. •Das, G. (2000). Hydrology and Soil Conservation Engineering. Prentice Hall of India, New Delhi, India. •Subramanya, K. (2010). Engineering Hydrology. 3rd ed. Tata McGraw-Hill, New Delhi, India. Internet References •http://www.thebigger.com/biology/resources/what-is-the-conservation-of-soil/ : accessed on 08.11.2012 •http://www.mbgnet.net/fresh/rivers/shed.htm:accessed on 08.11.2012 •http://fergusonfoundation.org/btw-students/what-is-a-watershed/ : accessed on 03.10.2013 •http://cas.umkc.edu/geosciences/env-sci/module9/h20shed.GIF : accessed on 03.10.2013 •http://www.bbc.co.uk/scotland/education/int/geog/rivers/images/hydrographs/hydro2.gif : accessed on 03.10.2013 •http://echo2.epfl.ch/VICAIRE/mod_1a/chapt_8/pictures/Figure87.gif : accessed on 03.10.2013
  • 12.
  • 13.
    What is watershedModelling approach? A watershed system model simulates both the natural and human systems of a watershed and the interactions between different components of the human-nature system. Modeling natural systems usually involves hydrology, ecology, meteorology, land surface science, cryospheric science, and other natural science disciplines. Global advances in economies and standards of living have resulted in a growing dependency on water resources. Many societies have experienced water scarcity as a result of current patterns with societal advances; these are associated with factors such as population growth, increased urbanization and industrialization, increased energy use, increased irrigation associated with advances in agriculture productivity, desertification, global warming and poor water quality. Improved understanding of how each of these factors influences water supply, demand and quality require improved abilities to understand the underlying processes and their impact on water availability and use. This entails employing a holistic approach which integrates hydrologic processes at the watershed scale to determine an overall watershed response to both user demands and changing climates. Read from the link about different models https://www.intechopen.com/chapters/43179 System concept of watershed Modeling: Watershed modelling is an essential component for water resources management. Surface hydrologic response in a watershed can be thought as a combination of routing elements and runoff production units. This study develops a watershed model using control system concept in MATLAB Simulink module. What are the different hydrological processes occurring in a watershed? 1. Rainfall-runoff modelling describes the process of generating streamflow hydrograph resulted from the excess rainfall onto the catchment, after considering various hydrological processes such as precipitation, evaporation, transpiration, groundwater, and interflow 2. These processes include precipitation, interception, evaporation, infiltration, soil moisture storage and hillslope flow, overland flow, and groundwater. The processes and their spatial and temporal variability are described at both the stand and watershed scales. 3.