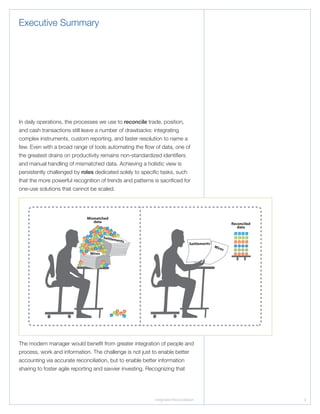
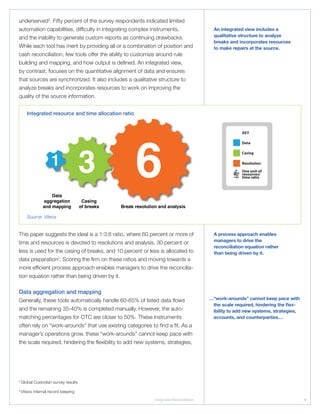
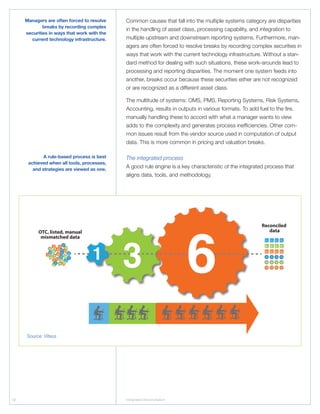
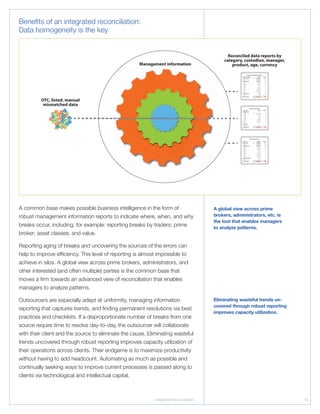
The document discusses the benefits of an integrated reconciliation process over the current state of siloed reconciliation systems and processes. It argues that integrating data, casing breaks, and resolution into a single process allows managers to gain a holistic view of reconciliation and address inefficiencies. Specifically:
1) Currently, managers use many different specialized systems that do not integrate, requiring manual workarounds. This hinders the ability to analyze patterns in mismatched data and improve processes.
2) An integrated process combines strategies, staff, and tools into a single workflow from data to resolution. This allows managers to derive standardized information and reports across asset classes.
3) The ideal integrated process allocates more time and resources to
This white paper discusses the importance of data integration in mergers and acquisitions. It outlines a data excellence framework to enable smooth integration of acquired companies. The framework defines business rules, data quality dimensions, and roles to ensure critical business rules are followed and optimal data quality is achieved during integration. Following this framework is crucial to fully realize the expected benefits of an acquisition by integrating data correctly according to business needs.
Riding The Technology Wave - Effective Dashboard Data VisualizationLisa McCorkle, Ph.D.
This document discusses effective dashboard design for data visualization. It begins by introducing the concept of data dashboards and their purpose in consolidating important data for decision making. It then describes three categories of dashboards: strategic, operational, and analytical. Strategic dashboards provide a high-level view of performance over months or years, operational dashboards require timely data to monitor daily measures, and analytical dashboards examine complex data relationships over various timeframes. The document concludes by discussing best practices for visualizing data on dashboards, such as using charts, graphs and key performance indicators (KPIs) that clearly and efficiently convey comparisons and status. Color coding and interactive elements can also help users quickly understand and act on the data.
Data and the enterprise mission: putting data at the corecorfinancial
Data matters to Financial Services firms. It is their stock-in-trade, a strategic asset that without an accurate and timely data set they cannot operate effectively, they cannot price risk fully and their capital allocation calls are unlikely to be optimal. Data is the ultimate collateral of these firms. For many, it requires a transformational change in their systems, technology and processes How then do you embed strategic data into your enterprise architecture?
Read 2 minute guide
Unified data management is becoming strategically important for companies to gain insights from large and diverse data in real time. Effective data management solutions can support business operations and analytics to improve processes and decision making. However, developing a unified strategy is challenging and requires collaboration between IT and business users. When both perspectives are incorporated into creating governance policies and selecting tools, companies can better integrate, access, and leverage their data to increase competitiveness.
Data Quality in the Banking Industry: Turning Regulatory Compliance into Busi...Precisely
During the last 15 years, regulatory requirements in financial services have grown substantially in order to reduce the risk of global, systemic economic failure. Quality data provided through effective data governance and data quality processes is central to achieving effective compliance reporting. Not only does data quality help ensure accurate reporting, but successful compliance significantly enhances other business decisions which rely on high quality data.
This webinar looks at the ramp up in reporting complexity, how successful compliance is linked to data governance and data quality, and how data quality helps empower financial institutions to make better decisions to increase revenue and decrease expense.
View this webinar on-demand for a discussion on:
• Tracing the background for regulatory reporting and key financial regulations
• Understanding how data quality helps institutions succeed with regulatory reporting compliance
• How regulatory reporting improves data for other business decisions
• How financial institutions leverage Trillium DQ to deliver quality data
Gaining financial and operational efficiencies through centralized processing. Lisa Baergen, APR
Centralized processing and divisional accounting has become a popular area of investigation for many multi-location/ multi-entity organizations
who struggle with the challenges of optimizing operational efficiencies and control within their disconnected organizations.
This White Paper takes a look at the challenges companies face with multiple entities today, some of the common solutions offered and will also suggest a framework for determining the critical components of centralized processing that are vital to your organization’s health.
American Megatrends Knowledge Management System is a powerful and easy to use system to manage your corporate knowledgebase. AMI KMS helps organizations
to create a systematic process by which content can be created,captured, shared, and leveraged by the organization.
- Tracy L. Hockensmith has over 17 years of experience in data analysis, business intelligence development, and customer segmentation. She has expertise in SQL, SSIS, SSAS, SSRS, and data warehousing.
- She has worked as a data analyst and technical solutions consultant for Hewlett Packard/Healthways, developing business intelligence databases, reports, and dashboards using Microsoft BI tools.
- Prior to that, she held various data analysis and reporting roles at Healthways, Inc, where she analyzed healthcare claims data and recommended improvements to clinical and operational strategies.
Governance and Architecture in Data IntegrationAnalytiX DS
This document discusses starting a data governance program in an agile way using AnalytiXTM Mapping ManagerTM. It describes AnalytiXTM Mapping ManagerTM as an enterprise mapping tool that can manage all metadata related to data integration projects, including documenting mappings, business rules, and providing traceability and auditability of data. Implementing AnalytiXTM Mapping ManagerTM can help satisfy regulatory compliance needs like those in the Sarbanes-Oxley Act by providing a centralized metadata repository and standardizing processes. Starting a data governance program with AnalytiXTM Mapping ManagerTM can help address metadata management gaps and jumpstart governance in a flexible manner.
White Paper-1-AnalytiX Mapping Manager-Governance And Architecture In Data In...AnalytixDataServices
The document discusses starting a data governance program in an agile way using AnalytiXTM Mapping ManagerTM. It describes AnalytiXTM Mapping ManagerTM as a tool that can help address metadata management gaps, document data mappings and rules, and establish data stewardship to enable regulatory compliance. Implementing AnalytiXTM Mapping ManagerTM allows jumping starting a data governance program by providing standardized metadata management, version control, and data lineage tracing across data integration projects.
This newsletter article discusses the development of HR Insight Management through increasing use of data analytics and artificial intelligence. It argues that HR reporting currently relies on small datasets and focuses on operational metrics. To improve strategic decision making, HR needs to leverage big data, smart data, and advanced analytics including predictive modeling, scenario planning, and AI. This would allow for more proactive workforce planning, risk management, and business insights. The article outlines a four-level framework for maturing an organization's data and analytics capabilities towards a fully deployed HR Insights Management function.
This document discusses trends in business intelligence (BI) and how adopting an agile approach can help address challenges in BI initiatives. It identifies a lack of flexibility as a key reason why many BI initiatives fail despite investments. The document advocates for adopting agile BI best practices like having automated and unified BI technologies that are pervasive and limitless. It recommends that organizations structure themselves to support agile BI with a hub-and-spoke model and business ownership of governance. Overall, the document argues that agility will be crucial for BI over the next decade to enable flexibility in responding to changing business needs.
This slide show was for a project in my MIS class this past semester. Obviously most will not understand this presentation but I'm hoping I can get some feedback/criticism/advice on how to put together some slides for a "formal professional" business presentation while not looking like a robot!
Personally I'm not a big fan of the template and its definitely not my best possible work. But considering it was a group project and the group politics I didn't have a choice.
IT plays a critical role in managing big data and selecting infrastructure to support current and future analytics needs. CIOs can lead IT reactively to needs or proactively implement strategic solutions. This document outlines key elements of a strategic big data analytics architecture, including in-database analytics, in-memory processing, and Hadoop, and criteria for evaluating solutions like analytical speed and flexibility. CIOs who implement strategic solutions that meet business needs can raise IT's profile in the organization.
The document discusses the MIS structure of digital firms. It notes that with advancements in internet, web communications, and information technology, business processes now cross organizational boundaries and make operations digital. All supply chain processes from ordering to delivery are now digital. This covers areas like ERP, SCM, and CRM. It also discusses how traditional hierarchical organizational structures are being replaced by flatter structures in digital firms to allow for more flexibility, delegation of decision making, and a more outcome-driven culture. Employees can now work more flexible hours and locations through technology.
Small and medium enterprise business solutions using data visualizationjournalBEEI
The small and medium enterprise (SME) companies optimize performance using different automated systems to highlight the operations concerns. However, lack of efficient visualization in reporting results in slow feedbacks, difficulties in extracting root cause, and minimal corrective actions. To complicate matters, the data heterogeneity has intensely increased, and it is produced in a fast manner making it unmanageable if the traditional methods of analytics are applied. Hence, we propose the use of a dashboard that can summarize the operational events using real-time data based on the data visualization approach. This proposed solution summarizes the raw data, which allows the user to make informed decisions that can give a positive impact on business performance. An interactive intelligent dashboard for SME (iid-SME) is developed to tackle issues such as measurement of cases completed, the duration of time needed to solve a case, the individual performance of handling cases and other tasks as a proof of concept. From the result, the implementation of the iid-SME approach simplifies the conveyance of the message and helps the SME personnel to make decisions. With the positive feedback obtained, it is envisaged that such a solution can be further employed for SME improvement for better profit and decision making.
This chapter discusses decision support systems (DSS) and how they differ from traditional management information systems (MIS). DSS provide interactive support to managers during semistructured decision making through tools like analytical models, databases, and computer modeling. MIS produce predefined reports to support more structured decisions. The chapter outlines several types of DSS including executive information systems, enterprise portals, online analytical processing (OLAP), geographic information systems, and data visualization systems. It also discusses how various analytical techniques can be used in DSS to support decision making.
Using Business Intelligence: The Strategic Use of Analytics in GovernmentIBM Government
IBM Center for the Business of Government addresses the value of analytics for measurably improving each of four government sector: health care, logistics, revenue management, and intelligence. Using the business strategy of leveraging analytics to promote promote change, these sectors can run as efficiently as any successful business.
DC Salesforce1 Tour Data Governance Lunch Best Practices deckBeth Fitzpatrick
The document provides guidance on data governance and stewardship best practices. It begins by outlining the importance of having accurate and relevant data to drive business growth. It then discusses getting started with data governance, including assessing data assets, understanding governance options, and planning an approach. The document provides numerous tips for setting up a data governance program, such as establishing a governance structure and processes, defining roles and responsibilities, and developing a high-level rollout plan. It also offers best practices for improving data quality through techniques like validation rules, dependent picklists, approval workflows, and regular data cleansing activities.
The document discusses Management Information Systems (MIS). It defines MIS as the study of people, technology, organizations, and the relationships between them. The goal of MIS is to help organizations realize maximum benefit from investments in personnel, equipment, and business processes. MIS uses information systems at all levels of businesses to collect, process, store, and disseminate data needed for daily operations and strategic decision making. The document also discusses typical career paths for MIS professionals and the traits that make someone well-suited for a career in MIS.
Challenges in integrating various DBMS during SAP implementationVignesh Ravichandran
1) The document discusses challenges in integrating data from different databases and data sources during an ERP (SAP) implementation. Key challenges include social issues in getting departments to share data, the large volume and scope of transactional data, complexity when integrating different data structures, and data quality issues.
2) A case study describes a company that faced data quality problems when merging financial data from a parent company during an SAP implementation. reconciling cash-based and accrual-based accounting ledgers was difficult.
3) Other challenges discussed include query performance issues when integrating data from multiple dynamic sources and lack of information makes optimization difficult for the data integration system.
Management Information System (MIS, DSS, TPS, E-Marketing System) of RAKGRSRAKGRS
1.Management information system is the lifeblood of any organization.
2.Decision Making System:Board of directors examines different decision making models.
To maximize creativity and logic in decision making.
To acquire decision making tips and techniques that can accelerate and improve results.
3.E-Marketing System:Marketing through internet.
The document discusses various topics related to organizations and information systems including:
- Definitions of organizations from technical and behavioral perspectives
- Structural characteristics of organizations like division of labor and standard operating procedures
- Changing roles of information systems in organizations and how they lead to automation and virtual organizations
- Decision making processes at different levels and models like rational, political, and "garbage can"
- Use of information technology for competitive advantage at business, firm, and industry levels through strategies
- Importance of managing strategic transitions when adopting new information systems technologies
This presentation contains our view on how data can be Strategically managed and stewarded in an organization, and the categories where rules can be applied to facilitate that process.
A management information system (MIS) provides managers with information to aid in decision making and managing an organization. An MIS integrates various subsystems, such as transaction processing, reporting, and decision support systems. It draws data from internal databases and external sources to generate reports for managers at different levels. These reports include scheduled, indicator, demand, and exception reports to help with planning, controlling, and decision making.
Keys to extract value from the data analytics life cycleGrant Thornton LLP
Regulatory mandates driving transparency and financial objectives requiring accurate understanding of customer needs have heightened the importance of data analytics to unprecedented levels making it a critical element of doing business.
The document discusses various topics related to information systems and management including:
1. It outlines different types of information systems such as transaction processing systems, management information systems, and enterprise systems.
2. It describes how information systems support business functions like operations, management, and competitive advantage.
3. It discusses challenges of managing information technology and developing information system solutions.
The document discusses the need for a new web-based financial modeling platform to address risks and issues with traditional spreadsheet-based modeling. Such a platform would provide compliance with regulations, assurance of data integrity, return on investment, and efficient processes. It would formalize modeling artifacts and transactions to speed up analysis, simplify communication, and reduce errors and fraud compared to error-prone spreadsheets. Adopting such a platform could help organizations gain competitive advantages through more accurate and timely insights.
How Finance is driving growth in the Digital Age via OpenTextOpenText
In the digital age, finance business processes are shifting from batch to real-time, retrospective to predictive, and internally-focused to customer-centric. Innovative companies can drive growth by focusing on the revenue stream from an outside-in perspective. Learn more from OpenText at http://www.opentext.com/campaigns/rundigital/digitize-business/sap-finance/sap-finance-wod
The document discusses how leading finance teams are supercharging financial reporting by enhancing their finance architectures. It provides examples of common goals and constraints faced by CFOs, such as reducing costs and complexity while improving transparency. It then describes how top performers are addressing these by focusing on timeliness, data centricity, and financial control. The document also outlines six common problems with typical finance systems and provides a case study of how one company addressed these issues to better understand profit drivers through integrated transaction data and standardized reporting processes.
The document discusses how leading finance teams are supercharging financial reporting by enhancing their finance architectures. It provides examples of common goals and constraints faced by CFOs, such as reducing costs and complexity while improving transparency. It then describes how top performers are addressing these by focusing on timeliness, data centricity, and financial control. The document also outlines six common problems with typical finance systems and provides a case study of how one company addressed these issues to provide more insightful reporting and analytics.
The document discusses how leading finance teams are supercharging financial reporting by enhancing their finance architectures. It provides examples of common goals and constraints faced by CFOs, such as reducing costs and complexity while improving transparency. It then describes how top performers integrate data across systems using a standardized layer, centralized accounting rules, and a transaction-level sub-ledger to gain insights. A case study shows how one company automated processes, integrated 90+ systems, implemented profitability engines, and linked operational and finance data to empower analysts. Finally, it outlines best practices such as having a single source of accurate finance data and giving finance control over accounting rules and reporting processes.
Turning your Excel Business Process Workflows into an Automated Business Inte...OAUGNJ
Many organizations have evolved key internal business processes built on top of Microsoft Excel. These cross-functional workflows involve several organizational units responsible for collecting business system transactions, modifying this raw data, consolidating, transforming, pivoting and preparing data into a published set of Reports & Graphs – all in MS Excel. Such workflows are a burden to organizations – not repeatable, costly, time-consuming, inflexible and hard to scale, and evolve to become more complex over time. Business critical processes such as financial analysis, operational analysis and revenue analysis are often supported this way. Attempting to replace such systems can be quite daunting and a barrier to replace. The goal of this session is to present an easy to understand methodology and use cases to demonstrate how to move from an operational workflow in Excel to truly automated Business Intelligence.
Industrial Restructuration Avoiding the M&A Nightmare.Datonix.it
Mergers and acquisitions often fail to create value due to data complexity and subjective opinions rather than objective data insights. Most M&A deals do not deliver sustainable added value, with 70-90% failing according to research. For M&A to succeed, organizations must address data complexity early on by improving data accuracy and management through tools like analytical appliances and cloud processing to unify and validate data for strategic decision making. Only with high quality, unified data can the anticipated synergies of M&A deals be fully realized.
Road to Financial Transparency White PaperJeff Lovett
This document discusses strategies for CFOs to improve financial transparency and reporting through next-generation finance system architectures. It outlines key challenges CFOs face in meeting demands for increased transparency and analytics while reducing costs. The document then describes three building blocks for next-generation financial reporting: an accounting hub to reconcile transactional and general ledger data, a calculation engine platform to enable custom metrics and cost/revenue allocations, and hierarchy management to allow multi-dimensional analysis of business data. It argues that a centralized data repository integrating various financial and operational data sources is needed to achieve transparency and efficiencies.
This document provides an overview of strategies for accelerated data conversion and effective long-term data management. It discusses the importance of understanding data lifecycles and having tools that can validate data during conversion, enable ongoing maintenance, and allow for reorganization during business changes. Key aspects include configuring validation rules during conversion, developing "get clean, stay clean" processes for maintenance, and having repeatable strategies for rollouts and reorganizations to continually update data as an organization evolves. Managing data through its entire lifecycle is critical to reducing risks and ensuring project and business success.
This document discusses the business case for advanced data visualization (ADV). It argues that ADV provides benefits like enabling users to process larger amounts of data more efficiently and detect trends more easily. ADV enhances the computer-human interface by increasing user awareness and focus. It allows enterprises to optimize human capital and performance. The document outlines best practices for implementing ADV, including making solutions agile, interactive, collaborative, and relevant to specific business needs.
This white paper discusses the importance of data integration in mergers and acquisitions. It outlines a data excellence framework to enable smooth integration of acquired companies. The framework defines business rules, data quality dimensions, and roles to ensure critical business rules are followed and optimal data quality is achieved during integration. Following this framework is crucial to fully realize the expected benefits of an acquisition by integrating data correctly according to business needs.
Data Governance for EPM Systems with Oracle DRMUS-Analytics
In this training session, data governance guru Greg Briscoe explains how to deploy an enterprise data governance initiative utilizing Oracle's Data Relationship Management (DRM) application.
In it Together: why “collaboration” is now an essential skillset for asset ma...StatPro Group
Traditionally, asset management teams have worked in silos. But with asset classes and the data becoming more complex, greater collaboration is now needed. Find out why.
Manufacturing a digital transformation - ebookElliot Drabs
The document discusses how manufacturing companies can undergo a digital transformation to improve operational efficiency. It explains that digital transformation involves increasing interconnectivity between business units, gaining granular data insights from processes, and automating repetitive tasks. Case studies show how design changes, supplier relationships, and fault detection can benefit from these approaches. The conclusion emphasizes that digital transformation is a multidisciplinary effort requiring technology and business expertise to strategically leverage data and drive business performance.
The document discusses best practices for data governance. It recommends establishing a data governance framework that defines common terminology, hierarchies, and change management processes. It also emphasizes integrating applications like ERP, EPM, BI, and data warehouses by mapping data relationships and dimensions in a centralized data governance solution. This enables a single version of truth and reduces data reconciliation work across various systems.
The path forward is one that requires business transformation -transformation into an integrated enterprise. An integrated enterprise is an organizational structure that recognizes that a business operates best as a coordinated unit, and not as a mere collection of individual departments. Efficiency is achieved because focus is placed on processing transactions and information throughout the the enterprise. An ERP system is a prerequisite to the achievement of enterprise integration.
The document provides an overview of the SAS Data Governance Framework, which is designed to provide the depth, breadth and flexibility necessary to overcome common data governance failure points. It describes the key components of the framework, including corporate drivers, data governance objectives and principles, data management roles and processes, and technical solutions. The framework is presented as a comprehensive approach for establishing an effective and sustainable enterprise data governance program.
ADP White paper - Can your HR support international growthLee Saunders
The document discusses the challenges that companies face in managing a global workforce without standardized HR and payroll processes. It provides examples of companies that struggled to gain visibility and control over their international employees due to fragmented systems. The article advocates for standardizing core HR and payroll processes across countries in order to facilitate consolidated reporting, compliance, and decision-making for multinational companies.
Running head The REA Approach1The REA Approach8The REA Approa.docxtodd521
Running head: The REA Approach 1
The REA Approach 8The REA Approach
Franklin Lee Henderson
American Intercontinental University
Author Note
[Include any grant/funding information and a complete correspondence address.]
Abstract
The Resource-Event-Agent (REA) model is a way to deal with conceptualizing the semantics of Fina Calculated models of undertakings can be utilized for both business procedure demonstrating and the genuine structure of automated data systems. The Resource-Event-Agent (REA) model, an area explicit structure for deciding the data engineering of bookkeeping and endeavor data frameworks, has fundamentally been utilized for plan purposes. In this paper we investigate the utilization of REA for business process modeling. At first, we talk about how REA natives are utilized to portray the esteem included change of assets all through the venture. Next, we break down some troublesome determination issues that identify with business procedure displaying when all is said in done and to REA designing answers for these issues. We finish up the paper with the detail of a three-layer engineering that abridges the REA way to deal with business procedure demonstrating: (I) endeavor level determination, (ii) REA-based procedure depictions, and (iii) task-level or work process specifications. The design demonstrates that work process portrayals can be identified with the detail of the venture esteem chain through the mode of REA data structures’ trades, for example, bookkeeping exchanges. The REA model is an ISO standard.
The REA Approach
In this paper we investigate the utilization of REA for business process modeling. At first, we talk about how REA natives are utilized to portray the esteem included change of assets all through the venture. Next, we break down some troublesome determination issues that identify with business procedure displaying when all is said in done and to REA designing answers for these issues. We finish up the paper with the detail of a three-layer engineering that abridges the REA way to deal with business procedure demonstrating: (I) endeavor level determination, (ii) REA-based procedure depictions, and (iii) task-level or work process specifications. The design demonstrates that work process portrayals can be identified with the detail of the venture esteem chain through the mode of REA data structures’ trades, for example, bookkeeping exchanges. The REA model is an ISO standard.
Tantamount deals are for the 52-week time frame finished January 25, 2019, contrasted with the 52-week duration finished January 26, 2018. For more data in regard to our monetary 2019 budgetary execution, see our yearly report on Form 10-K for financial 2019 recorded with the SEC on March 28, 2019. Certain money related measures talked about above are non-GAAP measures under the SEC's principles. See Annex A for more data about how we figure these monetary measures, why those money related measures give significant data, a.
This takes a look at the architectural constructs that are used for building business intelligence systems and how they are used in business processes to improve marketing, better serve customers, and maximize organizational efficiency.
Similar to Integrated Reconciliation A Process View (20)
1. Integrated Reconciliation
A process view with scorecard on automation, complex instruments, and custom reporting
Authors:Contact: David A.A. Ross Global Head of Marketing
+1 732 318 7109 | david.ross@viteos.com
Roshi Dandona Co-head Fund Services
+1 732 907 1285 | rdandona@viteos.com
USA: NJ +1 732 356 1200 | NY +1 646 861 3409
EMEA: +44 20 7016 9171
ASIA: +65 6850 7797
EMAIL: reply@viteos.com
2. 2 Integrated Reconciliation
Contents
Executive Summary...................................................................................... 3
The State of the Reconciliation................................................................... 7
Introduction............................................................................................ 7
Systems: Tools for one, none for all............................................................ 8
Across systems...................................................................................... 8
A cacophony of systems.................................................................... 8
Qualitative phases are underserved.................................................... 8
Data aggregation and mapping.......................................................... 9
Break categories and triggers............................................................... 10
Rule-based process......................................................................... 10
The integrated process..................................................................... 12
Benefits of an integrated reconciliation: Data homogeneity is the key...... 13
Understanding the optimal process.......................................................... 17
Timeliness............................................................................................ 17
Do thresholds save time or reduce frequency of breaks?.................. 18
Standardization.................................................................................... 18
The portfolio picture............................................................................. 19
Out-of-balance components................................................................ 19
Skill and experience............................................................................. 20
What does a number mean? The value of interpretation................... 20
Relationships between numbers, processes and information sources.... 21
Comparative distribution of breaks................................................... 21
Robust reporting.................................................................................. 23
Conclusion.................................................................................................. 24
Contributors
Ram Chandrashekar
Associate Vice President
Darshan Goradia
Associate Vice President, Fund Accounting
Bill Hampton
Associate Vice President, Middle Office
Vivek Venugopal Thandi
Manager, Middle Office
3. Integrated Reconciliation 3
In daily operations, the processes we use to reconcile trade, position,
and cash transactions still leave a number of drawbacks: integrating
complex instruments, custom reporting, and faster resolution to name a
few. Even with a broad range of tools automating the flow of data, one of
the greatest drains on productivity remains non-standardized identifiers
and manual handling of mismatched data. Achieving a holistic view is
persistently challenged by roles dedicated solely to specific tasks, such
that the more powerful recognition of trends and patterns is sacrificed for
one-use solutions that cannot be scaled.
The modern manager would benefit from greater integration of people and
process, work and information. The challenge is not just to enable better
accounting via accurate reconciliation, but to enable better information
sharing to foster agile reporting and savvier investing. Recognizing that
Executive Summary
Mismatched
data
Settlements
Reconciled
data
Wires
Wires
Settlements
4. 4 Integrated Reconciliation
Executive Summary reconciliation processes are increasingly complex, certain managers have
taken an integrated and rule-based view of reconciliation. Ideally, these
managers case the nature and triggers of breaks with a mind to move
beyond silos of information to a sustainable and repeatable solution.
This paper offers a simplified scenario for managers that trade many
types of securities and perform a number of separate reconciliations that
are both handled and not handled by a combination of tools, staff, and
processes. The paths involved here are about Data Aggregation and
Mapping, Casing Breaks, and Break Resolution and Analysis.
The trio – Data, Casing, and Resolution – requires a commitment of time
and resources exemplified by a simple ratio. We hypothesize that ratio to
be 2:5:3, where resolution is allocated 30% of the total time and resourc-
es (a percentage which is often inadequate after heavy trading).
As a manager moves toward integration, the ratio is expected to improve to
a more efficient 1:3:6 score as fewer resources are spent on data and casing.
More time can then be invested in resolution and process improvements.
Multiple systems
Data handling
Nuances of processing
Set up
Timeliness
Basis of calculation
Functionalities
Sources
Quality
Identifiers
Setup attributes
Reporting ability
Processing nuances
Range of asset classes
Data formats
Completeness
Accuracy of data
Adherence to agreement
Timeliness
Data interpretation
Conventions used
Reporting logics
Range of asset classes
Number of markets
Mismatched data
3 CategoriesRule-based process 6 Triggers 15 Natures
5. Integrated Reconciliation 5
Executive Summary
Actual processes and actual systems vary, as business needs are increas-
ingly unique. With a wide range of asset classes and a lack of standardiza-
tion, scalability highlights the need for more efficient and automated systems
that can efficiently transfer information from one system to another.
This paper explains a solution in an integrated, rule-based process:
• Integration means joining quantitative data alignment and source
synchronization to a qualitative ability to analyze break trends while
making repairs at the source.
• Integration allows breaks to be viewed via a simplified and unified
exception management process across funds and brokers.
• A rule-based process is best achieved when all tools, processes,
and strategies are viewed as one.
Data
aggregation
and mapping
Casing
of breaks Break resolution and analysis
1 3 6
OTC, listed, manual
mismatched data
Reconciled
data
1 3 6
6. 6 Integrated Reconciliation
Executive Summary The solution here is a robust management process that provides
business intelligence reports to indicate where, when, and why breaks
happen and enable staff members to create solutions that auto-map
recurring mismatches.
The optimal process is about:
Timeliness: Mapping data sources and producing customized reports for
both position and cash improves timeliness. This is the central feature of
scalable, flexible middle- and back-office operations.
Standardization: Recording a broad range of asset classes in a stan-
dardized manner would be a great boon to productivity.
Benefits of an integrated reconciliation
Homogeneity in reconciliation is the key and supports:
• Timeliness
• Standardization of reporting formats
• A robust portfolio picture
• Identification of out-of-balance components
• Skill and experience commensurate to a broad range of investment types
Evaluating operations according to efficiency, scalability and speed is
essential for a smooth stream of information, moving from data alone to a
more holistic and integrated view of reconciliation as a process. It is one
path a manager can take in achieving a higher level of proficiency in the
structure of their operations.
Outsourcing becomes a comprehensive option and a readily available
tool for the manager to employ in pursuit of a more efficient, timely, and
reliable flow of data. A strong and effective reconciliation system in the
middle and back office enables the manager to do exactly that, allowing
for a greater focus on the investment challenges at hand.
7. The State of the Reconciliation
Introduction
At first glance, it may seem that reconciliation is a fairly “settled” match-
ing activity of trade, position, and cash transactions, and managers have
developed processes that largely fulfill their day-to-day needs. With as
many as 35 stand-alone or bundled reconciliation tools available for
purchase that automate approximately 60-65% of the listed and 50% of
OTC data flows1
, the landscape would seem stable and serene. Yet upon
closer examination, the scene is far less settled, and this phenomenon is
not the concern of just a few managers. Even with the abundance of tools
available to all parties involved in listed and OTC post-trade activities, the
non-standardized manual handling of the remaining ~40% listed and 50%
OTC remains one of the greatest drains on productivity.
Manual chore heavy activities detract from the more intelligent review-
ing and resolving functions that search for patterns in mismatched data.
Additionally, as roles have become highly specialized within each product
group, sharing workloads and integrating information amongst them is
greatly diminished. Without integration, comprehensive reporting that is
sufficiently vigorous to alert a manager to global mismatch patterns is
almost impossible to achieve. Knowledge of these trends — combined
with permanent improvements in system integration, data handling, and
shared processing — allows for a highly efficient system.
While integration is appealing in theory, the experienced CFO/COO will
question its feasibility in the presence of product silos, inflexible process-
es, and heavy volumes. Identifying trends and removing the sources of
breaks so that they do not reoccur is supplanted by competing priorities
Integrated Reconciliation
A process view with scorecard on automation, complex instruments, and custom reporting
7
Manual processes detract from
the more intelligent reviewing and
resolving functions that search for
patterns in mismatched data.
Permanent improvements
would lead to exponential
leaps in efficiency.
Integrated Reconciliation
1
Global Custodian reconciliation survey of managers with $1 billion or more in assets under
management. September 2014.
Non-standardized manual
handling remains one of the
greatest drains on productivity.
8. 8 Integrated Reconciliation
every day. However, there are examples of managers who have succeed-
ed in sharing workloads and integrating information amongst product
groups into one process. What these managers share is an integrated
view of reconciliation as the bridge into all their operations.
They have replaced the commonplace and humdrum alignment of two
sets of records with a deliberate rule-based method of casing the differ-
ences between records or systems and have worked towards integrating
these variances across their operations.
Continuously improving practices during reconciliation of $200 billion in
hedge fund assets over time leads us to conclude that an integrated pro-
cess that begins with categorizing breaks, their triggers, and the nature of
each break is at the heart of modern reconciliation. The grouping requires
combining strategies, staff, and tools into one process from which to
derive homogenous information. It moves beyond mere matching and to-
wards information sharing and management reporting. The accuracy and
breadth of managing information in the absence of silos shields managers
from trading on incorrect information or cash discrepancies. The resultant
increase in the velocity of business and investment decisions as a result of
confidence in reporting has become a competitive advantage.
Systems: Tools for one, none for all
Across systems
A cacophony of systems
It makes business sense to focus on maximizing solutions that fulfill oper-
ating essentials day-to-day, whether these are a manager’s or a provider’s.
Often specific processes and systems are developed as solutions for each
operating need. The result is a cacophony of systems that do not easily
integrate with each other. One fund, for example, may prefer one order
management system over the many other options because it streamlines
execution of the bonds it trades frequently. Hence, with a wide range of
asset classes and in the absence of standardization across the cacoph-
ony of systems, breaks prevail. Managers require either an automated
engine to transfer information from one system into a stream compatible
with the next or they adapt to manual intervention, with its accompanying
deleterious effect on efficiency.
Qualitative phases are underserved
Because the various tools available for reconciliation have difficulty
fulfilling the qualitative phases of reconciliation, these phases remain
In a recent survey on reconciliation by
Global Custodian, respondents from the largest
managers surveyed indicated that their current
solutions were not sufficient. They listed faster
resolution, integration of complex instruments,
and automation as components of their process-
es that presented the greatest challenges. When
asked which tools they used for reconciliation,
managers listed more than 35 systems (a mix of
full, bank, and non-reconciliation systems) and
multiple short-term arrangements.
1. Broadridge’s PROactive
2. Easy Match
3. Electra
4. Fiserv Accurate
5. FMC Recon / SSC Recon
6. Geneva Advantage
7. Gresham CTC
8. HazelTree
9. IntelliMatch
10. i-Recs
11. IVP Cosmos
12. Markit WSO Web
13. Smartstream Corona / Smartstream TLM
14. Stematch Sterci
15. Tri Optima
16. Adra Match
17. CheckFree FUND
18. Frontier / Recon Frontier
19. Beauchamp Financial Technology
20. Broker Dealer account system
21. Carmen
22. EZE Software Group Tradar PMS
23. EZE Castle OMS
24. Globalsys Gbroker
25. Investran
26. Microsoft Excel
27. Microsoft VBA Tools
28. MIK Fund Solutions
29. Misys Optics
30. Nirvana Solutions
31. Omgeo Oasys
32. OPNSC PCS Custody
33. Pro Opticus
34. Sidoma
35. SimCorp Dimension
36. StatPro
37. Sub-Custody System
9. Integrated Reconciliation 9
underserved2
. Fifty percent of the survey respondents indicated limited
automation capabilities, difficulty in integrating complex instruments,
and the inability to generate custom reports as continuing drawbacks.
While each tool has merit by providing all or a combination of position and
cash reconciliation, few tools offer the ability to customize around rule
building and mapping, and how output is defined. An integrated view,
by contrast, focuses on the quantitative alignment of data and ensures
that sources are synchronized. It also includes a qualitative structure to
analyze breaks and incorporates resources to work on improving the
quality of the source information.
This paper suggests the ideal is a 1:3:6 ratio, where 60 percent or more of
time and resources is devoted to resolutions and analysis, 30 percent or
less is used for the casing of breaks, and 10 percent or less is allocated to
data preparation3
. Scoring the firm on these ratios and moving towards a
more efficient process approach enables managers to drive the reconcilia-
tion equation rather than being driven by it.
Data aggregation and mapping
Generally, these tools automatically handle 60-65% of listed data flows
and the remaining 35-40% is completed manually. However, the auto-
matching percentages for OTC are closer to 50%. These instruments
often rely on “work-arounds” that use existing categories to find a fit. As a
manager’s operations grow, these “work-arounds” cannot keep pace with
the scale required, hindering the flexibility to add new systems, strategies,
An integrated view includes a
qualitative structure to analyze
breaks and incorporates resources
to make repairs at the source.
A process approach enables
managers to drive the
reconciliation equation rather
than being driven by it.
…“work-arounds” cannot keep pace with
the scale required, hindering the flex-
ibility to add new systems, strategies,
accounts, and counterparties…
Data
aggregation
and mapping
Casing
of breaks Break resolution and analysis
1 3 6
Data
Casing
Resolution
KEY
One unit of
resources/
time ratio
Integrated resource and time allocation ratio
Source: Viteos
2
Global Custodian survey results
3
Viteos internal record keeping
10. 10 Integrated Reconciliation
Multiple systems
Data handling
Nuances of processing
Set up
Timeliness
Basis of calculation
Functionalities
Sources
Quality
Identifiers
Setup attributes
Reporting ability
Processing nuances
Range of asset classes
Data formats
Completeness
Accuracy of data
Adherence to agreement
Timeliness
Data interpretation
Conventions used
Reporting logics
Range of asset classes
Number of markets
Mismatched data
3 CategoriesRule-based process 6 Triggers 15 Natures
accounts, and counterparties. The OMS, for example, may record an
equity swap as a listed equity, while the PMS records it as an equity swap.
This could result in cash flows because of financing costs.
In cases where the administrator provides break reports, there can be as
many as 200 separate files to review that require comment. The more
compartmentalized the data is, the more tedious this handling becomes.
If a mismatched trade occurs across entities, for example, comments are
needed in all files where it occurs before they are returned to the admin-
istrator. In addition, patterns of breaks are overlooked when this many
files are handled manually. In an integrated reconciliation, breaks can be
viewed using a simplified exception management process that provides
a unified view of breaks across funds/brokers. This also aids in managing
the exceptions in a much more robust manner.
Break categories and triggers
Rule-based process
In an integrated reconciliation,
breaks can be viewed using a
simplified exception management
process that provides a
unified view of breaks across
funds/brokers.
In a well-organized, rule-based process, the origin of a break is first identified at the Category level: is it
data-, system-, or process-related? This then helps identify two possible Triggers, which in turn lead a
person resolving the break to a choice between several possible Natures.
Source: Viteos
11. Integrated Reconciliation 11
Nature Description
Identifiers Differing internal or external identifiers for
an asset class depending on source and
systems.
Setup attributes Various attributes, such as ISIN, maturity
data, Bloomberg ticker, etc.
Processing
nuances
How each system deals with a security; in
some cases there may be an adaptation
utilizing a work-around, e.g., equity swap
set as equity in a system.
Reporting ability Ability to produce reports by attributes on a
multidimensional data set, i.e., by asset class,
aging, break type, entity, currency, etc.
Range of
asset classes
Does the process accommodate all traded
asset classes?
Adherence to
agreement
Parameters are set as defined in an OTC
agreement.
Accuracy of data Quality of information.
Data formats Machine readable / non-machine readable
formats.
Timeliness Time for processing information, which
may be dependent on various factors—
arrival of files, completion of processing
by other systems, personnel availability in
other time zones.
Data interpretation Basis of how a system may infer informa-
tion on various aspects around financing
cost, interest calculation, etc. There may
be differences in outputs.
Conventions used 360 versus 365 days for calculation of
bond interest.
Reporting logics Basis of logic used to layout reports—the
kind of reports depends on end user
requirements and customization of the
reports.
Range of
asset classes
Does the process accommodate all asset
classes across market?
Number of
markets
Conventions and requirements differ across
markets and increase the total to account
for as markets are added.
12. 12 Integrated Reconciliation
Common causes that fall into the multiple systems category are disparities
in the handling of asset class, processing capability, and integration to
multiple upstream and downstream reporting systems. Furthermore, man-
agers are often forced to resolve breaks by recording complex securities in
ways that work with the current technology infrastructure. Without a stan-
dard method for dealing with such situations, these work-arounds lead to
processing and reporting disparities. The moment one system feeds into
another, breaks occur because these securities either are not recognized
or are recognized as a different asset class.
The multitude of systems: OMS, PMS, Reporting Systems, Risk Systems,
Accounting, results in outputs in various formats. To add fuel to the fire,
manually handling these to accord with what a manager wants to view
adds to the complexity and generates process inefficiencies. Other com-
mon issues result from the vendor source used in computation of output
data. This is more common in pricing and valuation breaks.
The integrated process
A good rule engine is a key characteristic of the integrated process that
aligns data, tools, and methodology.
Managers are often forced to resolve
breaks by recording complex
securities in ways that work with the
current technology infrastructure.
OTC, listed, manual
mismatched data
Reconciled
data
1 3 6
Source: Viteos
A rule-based process is best
achieved when all tools, processes,
and strategies are viewed as one.
13. Integrated Reconciliation 13
Benefits of an integrated reconciliation:
Data homogeneity is the key
A common base makes possible business intelligence in the form of
robust management information reports to indicate where, when, and why
breaks occur, including, for example: reporting breaks by traders; prime
broker; asset classes; and value.
Reporting aging of breaks and uncovering the sources of the errors can
help to improve efficiency. This level of reporting is almost impossible to
achieve in silos. A global view across prime brokers, administrators, and
other interested (and often multiple) parties is the common base that
moves a firm towards an advanced view of reconciliation that enables
managers to analyze patterns.
Outsourcers are especially adept at uniformity, managing information
reporting that captures trends, and finding permanent resolutions via best
practices and checklists. If a disproportionate number of breaks from one
source require time to resolve day-to-day, the outsourcer will collaborate
with their client and the source to eliminate the cause. Eliminating wasteful
trends uncovered through robust reporting improves capacity utilization of
their operations across clients. Their endgame is to maximize productivity
without having to add headcount. Automating as much as possible and
continually seeking ways to improve current processes is passed along to
clients via technological and intellectual capital.
Management information
OTC, listed, manual
mismatched data
Reconciled data reports by
category, custodian, manager,
product, age, currency
A global view across prime
brokers, administrators, etc. is
the tool that enables managers
to analyze patterns.
Eliminating wasteful trends un-
covered through robust reporting
improves capacity utilization.
14. 14 Integrated Reconciliation
A global view driven by automation is a more efficient scenario. Here, individ-
uals supporting reconciliation shift from being strictly data clerks to reviewers
enabled by a common base of reporting in one process. They track and
resolve outstanding items to reduce aging, increase accounting flexibility to
cover all asset types, and unearth patterns to deal with systemic problems.
Control Sheet — Cash Break Analysis examples. Six possible reports are available from a
common base of homogeneous information.
Notice that the grand total for each report is the same.
Report By Portfolio Manager
PM Code Name Value Count
PM A. Smith $ 995,868 111
USD 995,868 111
PM B. Smith 537,254 70
EUR 9,827 8
USD 211,894 42
AUD 443 1
CHF 3,214 2
GBP 13,400 7
JPY 246,345 8
NOK 52,132 2
PM C. Smith 131 3
USD 131 3
Grand Total $ 1,533,253 184
Report By Product
Product Value Count
High Yield $ 995,868 111
USD 995,868 111
Quant Equity 537,254 70
EUR 9,827 8
USD 211,894 42
AUD 443 1
CHF 3,214 2
GBP 13,400 7
JPY 246,345 8
NOK 52,132 2
Tax Advantage 131 3
USD 131 3
Grand Total $ 1,533,253 184
Report By Category
Category Value Count
Income Break $ 433,579 60
EUR 1,007 4
USD 180,390 40
AUD 443 1
CHF 1,994 1
GBP 13,400 7
JPY 236,345 7
Non Trade Break 617,615 100
USD 617,615 100
Trade Break 440,977 12
EUR 4,566 2
USD 374,279 7
JPY 10,000 1
NOK 52,132 2
Corporate Action Break 41,082 12
EUR 4,254 2
USD 35,608 9
CHF 1,220 1
Grand Total $ 1,533,253 184
Report By Custodian
Custodian Value Count
State Street
USD $ 1,207,762 153
EUR 9,827 8
AUD 443 1
CHF 3,214 2
GBP 13,400 7
JPY 246,345 8
NOK 52,132 2
Pershing
USD 131 3
Grand Total $ 1,533,253 184
A rule-based process gives
flexibility to cover all asset types
and unearth patterns to deal with
systemic problems.
15. Integrated Reconciliation 15
In the midst of daily confirmations, trade bookings, and other activities,
reconciliation often takes the lowest priority as staff members juggle a
number of responsibilities and overlapping requests from the front office.
Managers need a robust reconciliation process that goes beyond just
matching and operates at high volumes in a multifaceted environment.
Another feature to look for is the inherent flexibility to report at any time
and in any format required. In addition, the system must enable staff
members to create solutions that prevent the same types of breaks from
recurring repeatedly.
For portfolios with similar holdings and trading activity, an integrated
perspective on reconciliation is required to achieve proficiency on each
of the five levels listed below. It becomes a health check for the entire
back and middle offices, builds credibility with the front office, and is
transparent to investors.
Report By Aging
Aging Value Count
0 - 7 Days $ 762,498 143
EUR 1 1
USD 701,761 132
AUD 443 1
CHF 1,220 1
GBP 3,325 5
JPY 55,748 3
7 - 15 Days 104,554 11
EUR 823 3
USD 51,465 5
CHF 1,994 1
GBP 1,460 1
NOK 48,811 1
15 - 30 Days 222,984 16
EUR 4,777 3
USD 15,674 6
GBP 8,615 1
JPY 190,597 5
NOK 3,321 1
30 - 90 Days 40,945 9
EUR 4,225 1
USD 36,720 8
90 Days 402,272 5
USD 402,272 5
Grand Total $ 1,533,253 184
Report By Currency
Currency Value Count
EUR 9,827 8
0 – 10,000 9,827 8
USD 1,207,893 156
0 – 10,000 171,859 130
10,000 – 100,000 669,343 24
100,000 – 500,000 366,691 2
AUD 443 1
0 – 10,000 443 1
CHF 3,214 2
0 – 10,000 3,214 2
GBP 13,400 7
0 – 10,000 13,400 7
JPY 246,345 8
0 – 10,000 13,712 5
10,000 – 100,000 114,545 2
100,000 – 500,000 118,088 1
NOK 52,132 2
0 – 10,000 3,321 1
10,000 – 100,000 48,811 1
Grand Total $ 1,533,253 184
The system must enable staff
members to create solutions that
prevent the same types of breaks
from recurring repeatedly.
…it becomes a health check,
builds credibility and is
transparent to investors…
16. 16 Integrated Reconciliation
1. Uniformity of output reflecting a common base: Having established
the differences, the focus is then to resolve the breaks and arrive at a
common base for the data. This homogeneity of information strength-
ens operational controls.
2. Health check: Efficiency suffers when the reconciliation framework is
ill-equipped to highlight trends and instead simply focuses on resolving
issues such as incorrect trade information, missed corporate actions,
erroneous settlement amounts, and mistaken commission charges.
Incorporating a checklist of necessary actions helps define when a par-
ticular type of break is trending as a result of the system setup and will
uncover the cause the first time a break is resolved. It will also prevent
the same breaks from occurring in the future. If a commission break
occurs with a particular broker whenever a certain security is traded, for
example, a robust process will do more than simply resolve the break.
Instead, it will follow a standard course of action that results in an audit
of the written commission schedule and its electronic setup; this audit
will help reveal the fault in the system so that it can be rectified. Similar-
ly, breaks that occur whenever specific securities are traded between
two particular parties may be due to a difference in the security masters
as set up in each party’s system.
3. Data synchronization: This first step corrals mismatches into a group
that is arranged and prioritized in a manner intended to efficiently bring
the various data sets into harmony once each mismatch is addressed
or resolved. A robust reconciliation ensures that all the data are in sync.
4. Risk and control: A reconciliation system that can provide pinpoint
accuracy on daily positions, cash balances, fees, commissions,
settlements, and other charges is a highly credible process that CFOs
will appreciate.
5. Transparency: An independent reconciliation process that describes
the nature of breaks and their materiality and reduces resolution time
accentuates the precision of a manager’s back-office operation.
…a checklist will uncover the cause
the first time a break is resolved…
…robust reconciliation ensures
that all the data are in sync…
…homogeneity strengthens
operational controls…
…reduces resolution time and
accentuates the precision of a
manager’s back-office operation…
17. Integrated Reconciliation 17
Understanding the optimal process
Timeliness
Constructing a reliable and dependable process, whether in-house or
outsourced, requires competency in each asset class and command of
the flow from source to final report. Augmenting those skills with a flex-
ible reconciliation tool capable of mapping data sources and producing
customized reports for both position and cash improves timeliness — the
central feature of scalable, flexible middle- and back-office opera-
tions. Timeliness is achieved by:
• an appraisal of the quality of data and its sources
• a quest for scalable and customizable improvements to technology
• deliberate addition of the best skill sets in the right time zones
• the incorporation of robust oversight into the process.
Measures Yes No
1) More than 10 percent of time spent on collation
and preparation of data for the report
2) Breaks of more than 10 percent in certain asset
classes
3) More than 48 hours resolution time
4) Uncompleted T+0 trade reconciliations at close
5) More than 70 percent manual process
Management information breaks by
Portfolio manager
Prime broker/custodian
Asset classes
Value
Currency
Age
Strategy
Here is a scorecard for your health check.
Source: Viteos reconciliation activities as benchmark
A flexible reconciliation tool capable of
mapping data sources and producing
customized reports for both position
and cash improves timeliness.
18. 18 Integrated Reconciliation
As an extension of operations, a global team provides pre-open reports,
as the depth and breadth of investments continue to scale worldwide. The
institutional investor is the catalyst to this phenomenon, which is driving
managers to rethink the back office. Many are realizing it is extremely diffi-
cult to sustain with an internal team alone, and so are developing partner-
ships with capable, outsourced service providers.
Do thresholds save time or reduce frequency of breaks?
According to the Global Custodian Reconciliation Survey, 80 percent
of the funds performing daily reconciliation spend between two and six
hours on the task. Listing spreadsheets as the most common tool em-
ployed, the survey also indicated that these managers do not consider
their output comprehensive enough for their needs. Without all the req-
uisite details, casing the breaks does not include permanent repair of the
underlying issue, as effort is spent on matching rather than improvement.
Unfortunately, resolution sometimes means chasing non-issues. A com-
mon practice to address such breaks is to raise the break tolerance limits.
Thresholds set the cutoff level to shield the team from immaterial breaks
and the inefficiencies inherent in resolving them.
Standardization
Expansion of global capabilities is driving the preference for customized
reporting. Underlying this drive is the need for agility — making sure the
operation is responsive enough to support the front office whenever and
wherever an opportunity arises. With legacy systems and processes, the
manual nature of servicing the front office highlights the shortcomings of
disparate systems in meeting the need for normalization and the resulting
A prudent manager is wary
of thresholds and should use
them to save time rather than
to reduce frequency.
Commission
Trade FX
Trade price
Trade quantity
Trade reconciliation
Marginal tolerance
Zero tolerance
Zero tolerance
Zero tolerance
Price - OTC
Factors
Price - listed
Position
Marginal tolerance
Zero tolerance
Zero tolerance
Zero tolerance
Position reconciliation
FX
Nontrade cash
Commission
Settle cash
Marginal tolerance
Zero tolerance
Zero tolerance
Zero tolerance
Cash reconciliation
Tolerance monitor
This table on tolerance monitoring levels for trade, position, and cash thresholds describes ideal thresholds,
where only commission, over-the-counter price, and foreign exchange tolerances should be designated as
immaterial. All others should have zero tolerance, as time spent on these resolutions is time well spent.
Source: Viteos
19. Integrated Reconciliation 19
effect on speed. Operations staffs perform under intense pressure and at
a brisk pace; thus, reconciliation may not get the scrutiny it requires as
the manager expands. While maintaining the integrity of the reconciliation
during growth demands a predisposition for efficiency in a wide range of
asset classes and data formats as well as swift processing across sys-
tems, the absence of standardized identifiers, data formats, and seamless
integration remain the biggest drags on reconciliation.
The non-standardized recording of a broad range of asset classes is
one of the greatest drains on productivity. However, in their absence,
and with no agreement on standards on the horizon4
, teams are left to
handle these manually.
The portfolio picture
Reporting breaks or matching values from various sources does not
mean the data are necessarily correct. It is necessary to understand the
fund’s portfolio, strategy, and policies along with current market condi-
tions to uncover the reasons why positions break from prime broker data.
If a trade is erroneously recorded in amount or in frequency, the correct
picture of positions, profit or loss, and cash will lie somewhere between
the onscreen positions and the unreconciled data. Timely break reporting
alerts the trader to any position not reflecting all activity until resolution is
completed. Reporting of unresolved breaks at the beginning of the day
improves control.
Out-of-balance components
Another drag on reconciliation is the imbalance of the process compo-
nents — data, systems, and people. The output is not usually an issue;
it is the imbalance of these components that is the challenge, either daily
or when the need for flexibility arises. Although the reconciliation team’s
grasp of the steps and the knowledge applied at each step are essential
components to quality output, when one component has to support the
shortcomings of another, the cost is unsustainable. An imperfect system
fed by low-quality data, for example, must have an excellent team able
and willing to make up for system deficiencies. This team already delivers
a high-quality reconciliation, but at what hidden cost? Burnout, lack of
scalability, and reduced timeliness are all potential results.
…the absence of standardized
identifiers, data formats, and
seamless integration remain the
biggest drags on reconciliation…
It is necessary to understand
the fund’s portfolio, strategy, and
policies to uncover the reasons
why positions break.
4
Three identification options have emerged. One promoted by the Association of National
Numbering Agencies (ANNA) is to rely on a combination of ISINs and the Classification of Financial
Instruments code. Another is to use an instrument identifier called the Financial Instrument Global
Identifier (FIGI), originally developed for use in proprietary taxonomy. The solution espoused by
the International Swaps and Derivatives Association (ISDA) is to depend on its taxonomy, which
includes a Unique Product Identifier (UPI) and a Unique Transaction Identifier (UTI).
http://finops.co/regulations/reporting/otc-derivatives-the-identifier-debate-heats-up-in-europe/
…output is not usually an issue;
it is the imbalance of these
components that is the challenge…
20. 20 Integrated Reconciliation
Skill and experience
When an excellent framework run by a team of people unfamiliar with cer-
tain asset classes and when the data handling produces output without
understanding, accuracy and data integrity both suffer. Whenever trades
are booked, these nuances will be incorporated into the reconciliation,
whether there is a break or not.
What does a number mean? The value of interpretation
Numbers on a reconciliation or profit-and-loss report are not simply
abstract or subjective numbers. Breaks and changes in valuations occur
for a variety of reasons, from simple human error to timing issues and from
Mismatched
data
Settlements
Reconciled
data
Wires
Wires
Settlements
Well-balanced components deliver accuracy, scalability, and adaptability and free top talent to
focus on treasury, collateral, and risk activities.
Certain fixed income products that pay principal use a factor of
10 or 100 for calculating value. Using a factor of 100 when the
factor should be 10 will create a value that is 10 times larger than
it should be. A Cyprus bond, for example, always uses a factor
of 100. Instead of looking only to see if there is a value in the
factor field during reconciliation, the experienced team member
will mentally mark that the Cypress bond factor field should
always be 100 and will notice any deviation.
21. Integrated Reconciliation 21
foreign exchange swings to major economic activity. It takes an experi-
enced eye to distinguish a reasonable break from an unreasonable one;
both the magnitude and the rationale of the underlying cause must be
taken into account. Understanding all the factors that influence a number
helps improve reconciliation and fill gaps in processes, ensuring accuracy
through analysis of the origin of the reported number and any adjustments
made to it post-trade. Numbers here represent a statement about the
real value of an asset, and they affect everything from the fund’s net asset
value to the risk of noncompliance because they govern allowable fees,
bonuses, commissions, and payouts. They have real and material impact
so must be both reliable and timely.
Relationships between numbers, processes, and information sources
Market knowledge enables recognition of when a break or a sudden shift
in value is reasonable and justifiable or requires additional investigation.
Even when a cursory review of results seems to show that market condi-
tions might explain the shift, the team must have the expertise to recog-
nize that the cause might, in fact, be an issue with the underlying process-
es or information sources.
Making the review of data a function of reconciliation departments with
domain competency rather than collection clerks allows every break to be
assessed for its “reasonableness” – is the break due to a business pro-
cess issue or market volatility? Domain expertise enables them to intuitive-
ly recognize discrepancies and weigh market conditions, foreign exchange
shifts, and realized and unrealized gains and losses, among other factors,
to determine a number’s reasonableness.
Comparative distribution of breaks
The comparative distribution of breaks assembled over a decade of
reconciliation activities serves as a benchmark once a system or process
is in place. This distribution guides an experienced team to evaluate the
frequency with which breaks occur and compare that to the normal distri-
bution. If the frequency of a certain type of break falls outside the normal
frequency, then the team will know that there is inefficiency in the process.
The team can improve its ratio by explaining the phenomenon and either
recommending repairs or revising the process to accommodate the
abnormalities and bring them into alignment.
It takes an experienced eye to
distinguish a reasonable break
from an unreasonable one.
22. 22 Integrated Reconciliation
Trade
Trade not
booked by fund
Trade not
booked by PB
Commission
breaks fee
Factor
differences
FX differences
Position
Corporate
action
Trade missing/
wrong quantity-
fund
Trade missing/
wrong quantity-
broker
Incorrect price Timing issue
Cash
Timing
differences
Commission
breaks fee
Corporate
actions
Nontrade
cash entries
FX differences
Comparative distribution of failed trade triggers
Comparative distribution of position and market value break triggers
Comparative distribution of cash break triggers
Source: Viteos
Source: Viteos
Source: Viteos
23. Integrated Reconciliation 23
Robust reporting
A respectable reconciliation will produce detailed, categorized reports
describing a path to resolution or other actions. It delivers post-trade po-
sition and cash accuracy in support of investment and trading decisions
along with accuracy in settlement and charges that support the CFO
post-execution. This level of precision insures that no corporate actions
are overlooked and that interest, other fees, and accruals are reflected in
the fund’s net asset value.
Whether done on trade day (T0) or pre- or post-open the next day (T1),
report timing affects trading and operations to varying degrees. A late
report may leave the fund exposed to unplanned risk, while an on-time
report can serve as an instrument of control. A well-balanced process
ensures that each component has the capacity to address a wide range
of asset classes, time zones, and spikes in volume. Such a process is also
able to adapt all file and data formats with ample time to build mapping
tables when automation is possible. If reporting is robust, in those
instances when a prime broker’s data is producing breaks or when a
trader repeatedly enters erroneous details, the team will be on the alert.
All these considerations are critical to the modern manager and should
be scrutinized to ensure that accurate information informs investment
decisions when the market opens. For example, in the case of hard-to-
borrow securities, without a high level of accuracy, any sale could lead to
an excess sale, thus creating borrowing or auction charges. Alternatively,
cash shortages reduce a trader’s agility to take a right-sized position if an
opportunity arises, thereby increasing the occurrence of lost opportunities.
From an investor’s perspective, tight protocols mitigate exposure risk. A
solid reconciliation framework not only showcases high-quality operations,
it also sets exposure limits for each counterparty and puts the manager
in a position to negotiate every call or fee schedule. Independent calcula-
tions, along with reconciled commissions, settlements, fees, and margins,
keep counterparty exposure at the forefront of risk management. Excess
counterparty margins and fees are not uncommon, as these can originate
from something as simple as overlooking a revision to the commission
schedule. When these are left unverified, a manager may end up paying
excess fees.
A well-balanced process ensures
that each component has the
capacity to address a wide range
of asset classes, time zones, and
spikes in volume.
A solid reconciliation framework
puts the manager in a position to
negotiate every call or fee schedule.
24. 24 Integrated Reconciliation
Modern post-trade operations have always required the smart coordi-
nation of people, processes, tools, and information. Given the speed
in which our tools and technologies are growing, and with the rise of
increasingly specialized investment directions, managers must devote
greater amounts of time to systems management and the traffic of data
as they might to their core passion of developing savvy answers to
investment challenges.
Evaluating operations according to efficiency, scalability, and speed is
essential to the work of a manager, as this helps determine the path a
manager can take in achieving a higher level of proficiency in the structure
of their operations. Central to the modern hedge fund manager’s capabil-
ity is the smooth stream of information, moving from data alone to a more
holistic and integrated view of reconciliation as a process. Outsourcing
becomes a comprehensive option and a readily available tool for the
manager to employ in pursuit of a more efficient, timely, and reliable flow
of data.
If technology is very important in the operations of the modern hedge
fund, technology should be transparent and second nature. A strong and
effective reconciliation system in the middle and back office enables the
manager to do exactly that, allowing for a greater focus on the investment
challenges at hand.
Conclusion
25. Integrated Reconciliation 25
About Viteos Fund Services
Tailored for each manager’s specific requirements, our Best Thinking
and Best Practices help managers grow. We offer customized straight-
through-processing and integrate post-trade operations across virtually
every asset class, currency, border, or structure you can imagine. We offer
a full range of shadow-accounting, middle- and back-office professional
services for investment managers. Our deep operational and accounting
expertise backed by state of art technology enables a high degree of
control via automation in a 24 hour, 5 days a week global delivery model.
The result is a new level of scalability and flexibility to help you grow—
whether you’re focused on gathering assets, developing new strategies
or entering new markets. Visit www.viteos.com for more information.
Global headquarters +1 732-356-1200
New York +1 646-861-3409
London +44 20 7016 9170
Mumbai +91 22 6108 2200
Singapore +65 6850 7797
Visit us at www.viteos.com
Email: reply@viteos.com
26. 26 Integrated Reconciliation
About Viteos Fund Services
Key facts:
• Founded in 2003
• 440+ professionals worldwide
• 24x5 operations
• Daily straight through processing
• $90+ billion under middle-office and fund servicing
• $220 billion in assets serviced
• Serving 60 clients with approximately 800 funds SMA
• Headquartered in New York / New Jersey
• Branch offices in London, Cayman Islands and Singapore
• Delivery centers in NY Metro and India
• Serving clients in North America, Europe, Far East and Asia Pacific
• Partnered with Credit Suisse
• Audited by Ernst and Young (SSAE16)
Awards Recognitions
• Global Fund Awards 2015, Global Shadow-Accounting Firm of the Year
• CTA US Services Awards 2015 Best Shadow Accounting Viteos
• HFM European Hedge Fund Services Awards, 2015, Best middle-office
services Viteos Fund Services
• Hedge Fund Awards 2015 Best Bespoke Solutions in Hedge Funds
• Finance Monthly, Global Awards 2015, Best Bespoke Solutions in
Hedge Funds USA
• ACQ Global Awards 2015 International – Niche HF Services Provider Of
The Year (Shadow Accounting)
• Gramercy Strategy Awards 2015 Accounting
• HFM US Hedge Fund Services Awards, 2014, Best Shadow-account-
ing firm
• 2014 Global Custodian Awards for Excellence, Regulatory Solution
• HFM European Hedge Fund Services Awards, 2014, Best middle-office
services Viteos Fund Services
• HFM Awards 2012 Best Administrator – under $30bn overall
• HFM Awards 2011 Best Administrator – reporting services