inSis Infoview
•
0 likes•155 views

Process Data Analytics, Visualisations, Calculations & Historian

Recommended
Recommended
More Related Content
What's hot
What's hot (20)
Viewers also liked
Viewers also liked (16)
Similar to inSis Infoview
Similar to inSis Infoview (20)
More from Kondapi V Siva Rama Brahmam
More from Kondapi V Siva Rama Brahmam (8)
Recently uploaded
Recently uploaded (20)
inSis Infoview
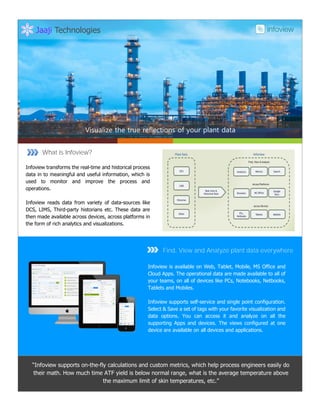
- 1. Visualize the true reflections of your plant data Infoview transforms the real-time and historical process data in to meaningful and useful information, which is used to monitor and improve the process and operations. Infoview reads data from variety of data-sources like DCS, LIMS, Third-party historians etc. These data are then made available across devices, across platforms in the form of rich analytics and visualizations. Jaaji Technologies Infoview is available on Web, Tablet, Mobile, MS Office and Cloud Apps. The operational data are made available to all of your teams, on all of devices like PCs, Notebooks, Netbooks, Tablets and Mobiles. Infoview supports self-service and single point configuration. Select & Save a set of tags with your favorite visualization and data options. You can access it and analyze on all the supporting Apps and devices. The views configured at one device are available on all devices and applications. “Infoview supports on-the-fly calculations and custom metrics, which help process engineers easily do their math. How much time ATF yield is below normal range, what is the average temperature above the maximum limit of skin temperatures, etc.” Find, View and Analyze plant data everywhere What is Infoview?
- 2. Select the right view from the range of charts and views to visualize and analyze better. Infoview supports variety view types like InfoGrids, InfoPanels, Calendar Views, and range of charts, gauges etc. Use Pie/Donut charts for Yields, Line/Area charts for Reactor temperature profiles, Funnel charts for production increases, Bar/Column charts for gross comparisons, Bullet charts for range violations, Gauges for value ranges etc. Interactive Charts and Views helps to quickly find out the similar and odds. Quickly On/Off tags in charts and view data summaries. Switch off a component in a pie chart and see the normalized percentage of remaining components. Get more clarity by switching On/Off tags. Plot the vital process data easily and quickly using web-based Infoview RichTrend Mixed series of Line, Area and Column Instant Tag Search Ad-hoc Calculations Metrics Time Slider & Periods Save configuration and access everywhere Rich customization options to adjust colors, texts, styles etc. Key Benefits Makes the plant operations data easily accessible to all of the teams, on all of their devices. inSis Analytics helps to quickly analyze plant performance with on- the-fly calculations, custom metrics and self-service analytic capabilities. Accelerate the troubleshooting of process issues there by quickly taking corrective actions. Improved the efficiency of process monitoring and reduces man- hours for data collection, preparation and presentation. The web-based Infoview RichTrend has everything to find out the real patterns of your plant. Trend the Calculated tags and Metrics together to find out every hidden aspect of your process. Simply slide to navigate in history, quickly select data periods, change ranges & colors and select series types and visuals, everything reflects real-time. Use a correct view to find out what your data says
- 3. Do more by getting your plant data in to MS Office Excel, Word & PowerPoint. Infoview App for Office is new generation Office interface, not an Add-in. Infoview App for Office supports multiple mappings of your plant data to Office Apps. This enables to fetch various data in to your Office Apps to improve the productivity. The Calculated tags and Metrics help you to reduce the effort for configuring reports in Office Apps. Your favorite Infoviews configured elsewhere, are readily available in your favorite Office App. Search your tags like never before Infoview TagSearch provides instant search results with basic information of tags so that we can quickly identify the desired process parameters. TagSearch results include units, descriptions, Sparklines, Live data etc. to quickly identify the tag of our interest. About Jaajitech Jaaji Software Technologies Pvt Ltd is incorporated with the major objective of providing smart software solutions for process industry in the field of process information, control and optimization. Our inSis Software (Industrial Smart Information Systems), is designed to meet the needs of new generation information systems in process industry. We also offer various consulting and onsite services in the field of Advanced Process Control and Optimization and software application development in the areas of process information and control. A combination of domain and software knowledge of our resources helps you in converting your ideas in to solutions. About Jaajitech Jaaji Software Technologies Pvt Ltd is incorporated with the major objective of providing smart software solutions for process industry in the field of process information, control and optimization. Our inSis Software (Industrial Smart Information Systems), is designed to meet the needs of new generation Manufacturing Execution Systems in process industry. Further to our product offerings, we also support end-to-end product development activities in all phases of Software Development Life Cycles (SDLC). A combination of domain and software knowledge of our resources helps in converting the ideas in to solutions. © 2016 Jaaji Software Technologies Pvt Ltd. 8-55/3, Weavers Colony, Chimakurthy, AP, India. JaajitechTM , inSisTM , OneviewTM , inSis logo, Jaaji Flower logo are trademarks of Jaaji Software Technologies Pvt Ltd., India. SALES Phone: +91 8897698106 Email: sales@jaajitech.com SUPPORT Email: support@jaajitech.com For more about us please visit www.jaajitech.com InfoviewTM is part of our inSisTM Suite (Industrial Smart Information Systems), which is designed to meet the needs of new generation information systems in process industry. The family of inSis products includes OneviewTM , PlantSiteTM and TagsTM .