Download to read offline


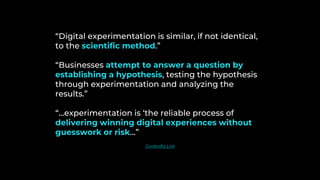
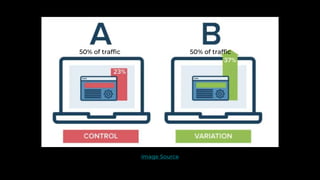


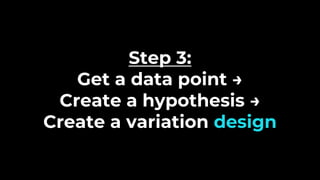
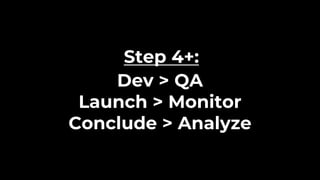
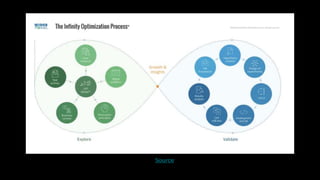


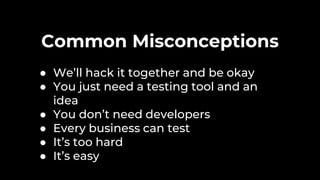

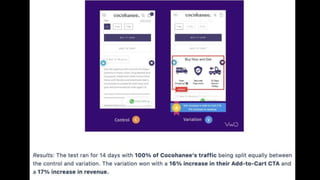


The document discusses the importance of experimentation as a key driver for innovation and growth in businesses. It outlines a structured approach to conducting digital experiments, which involves creating hypotheses based on data, testing them, and analyzing results to improve decision-making. The author highlights common misconceptions around experimentation and emphasizes the need for sufficient data volume and collaboration among teams for successful outcomes.


![[ILA'19] Hyphotheses & Experiments - enabling business-product dialogue](https://cdn.slidesharecdn.com/ss_thumbnails/fnazarioila2019vers-english-191101061304-thumbnail.jpg?width=640&height=640&fit=bounds)


![[Webinar VWO] Testes e Personalização (1).pptx](https://cdn.slidesharecdn.com/ss_thumbnails/webinarvwotestesepersonalizacao1-250530124426-7f7ee994-thumbnail.jpg?width=640&height=640&fit=bounds)


