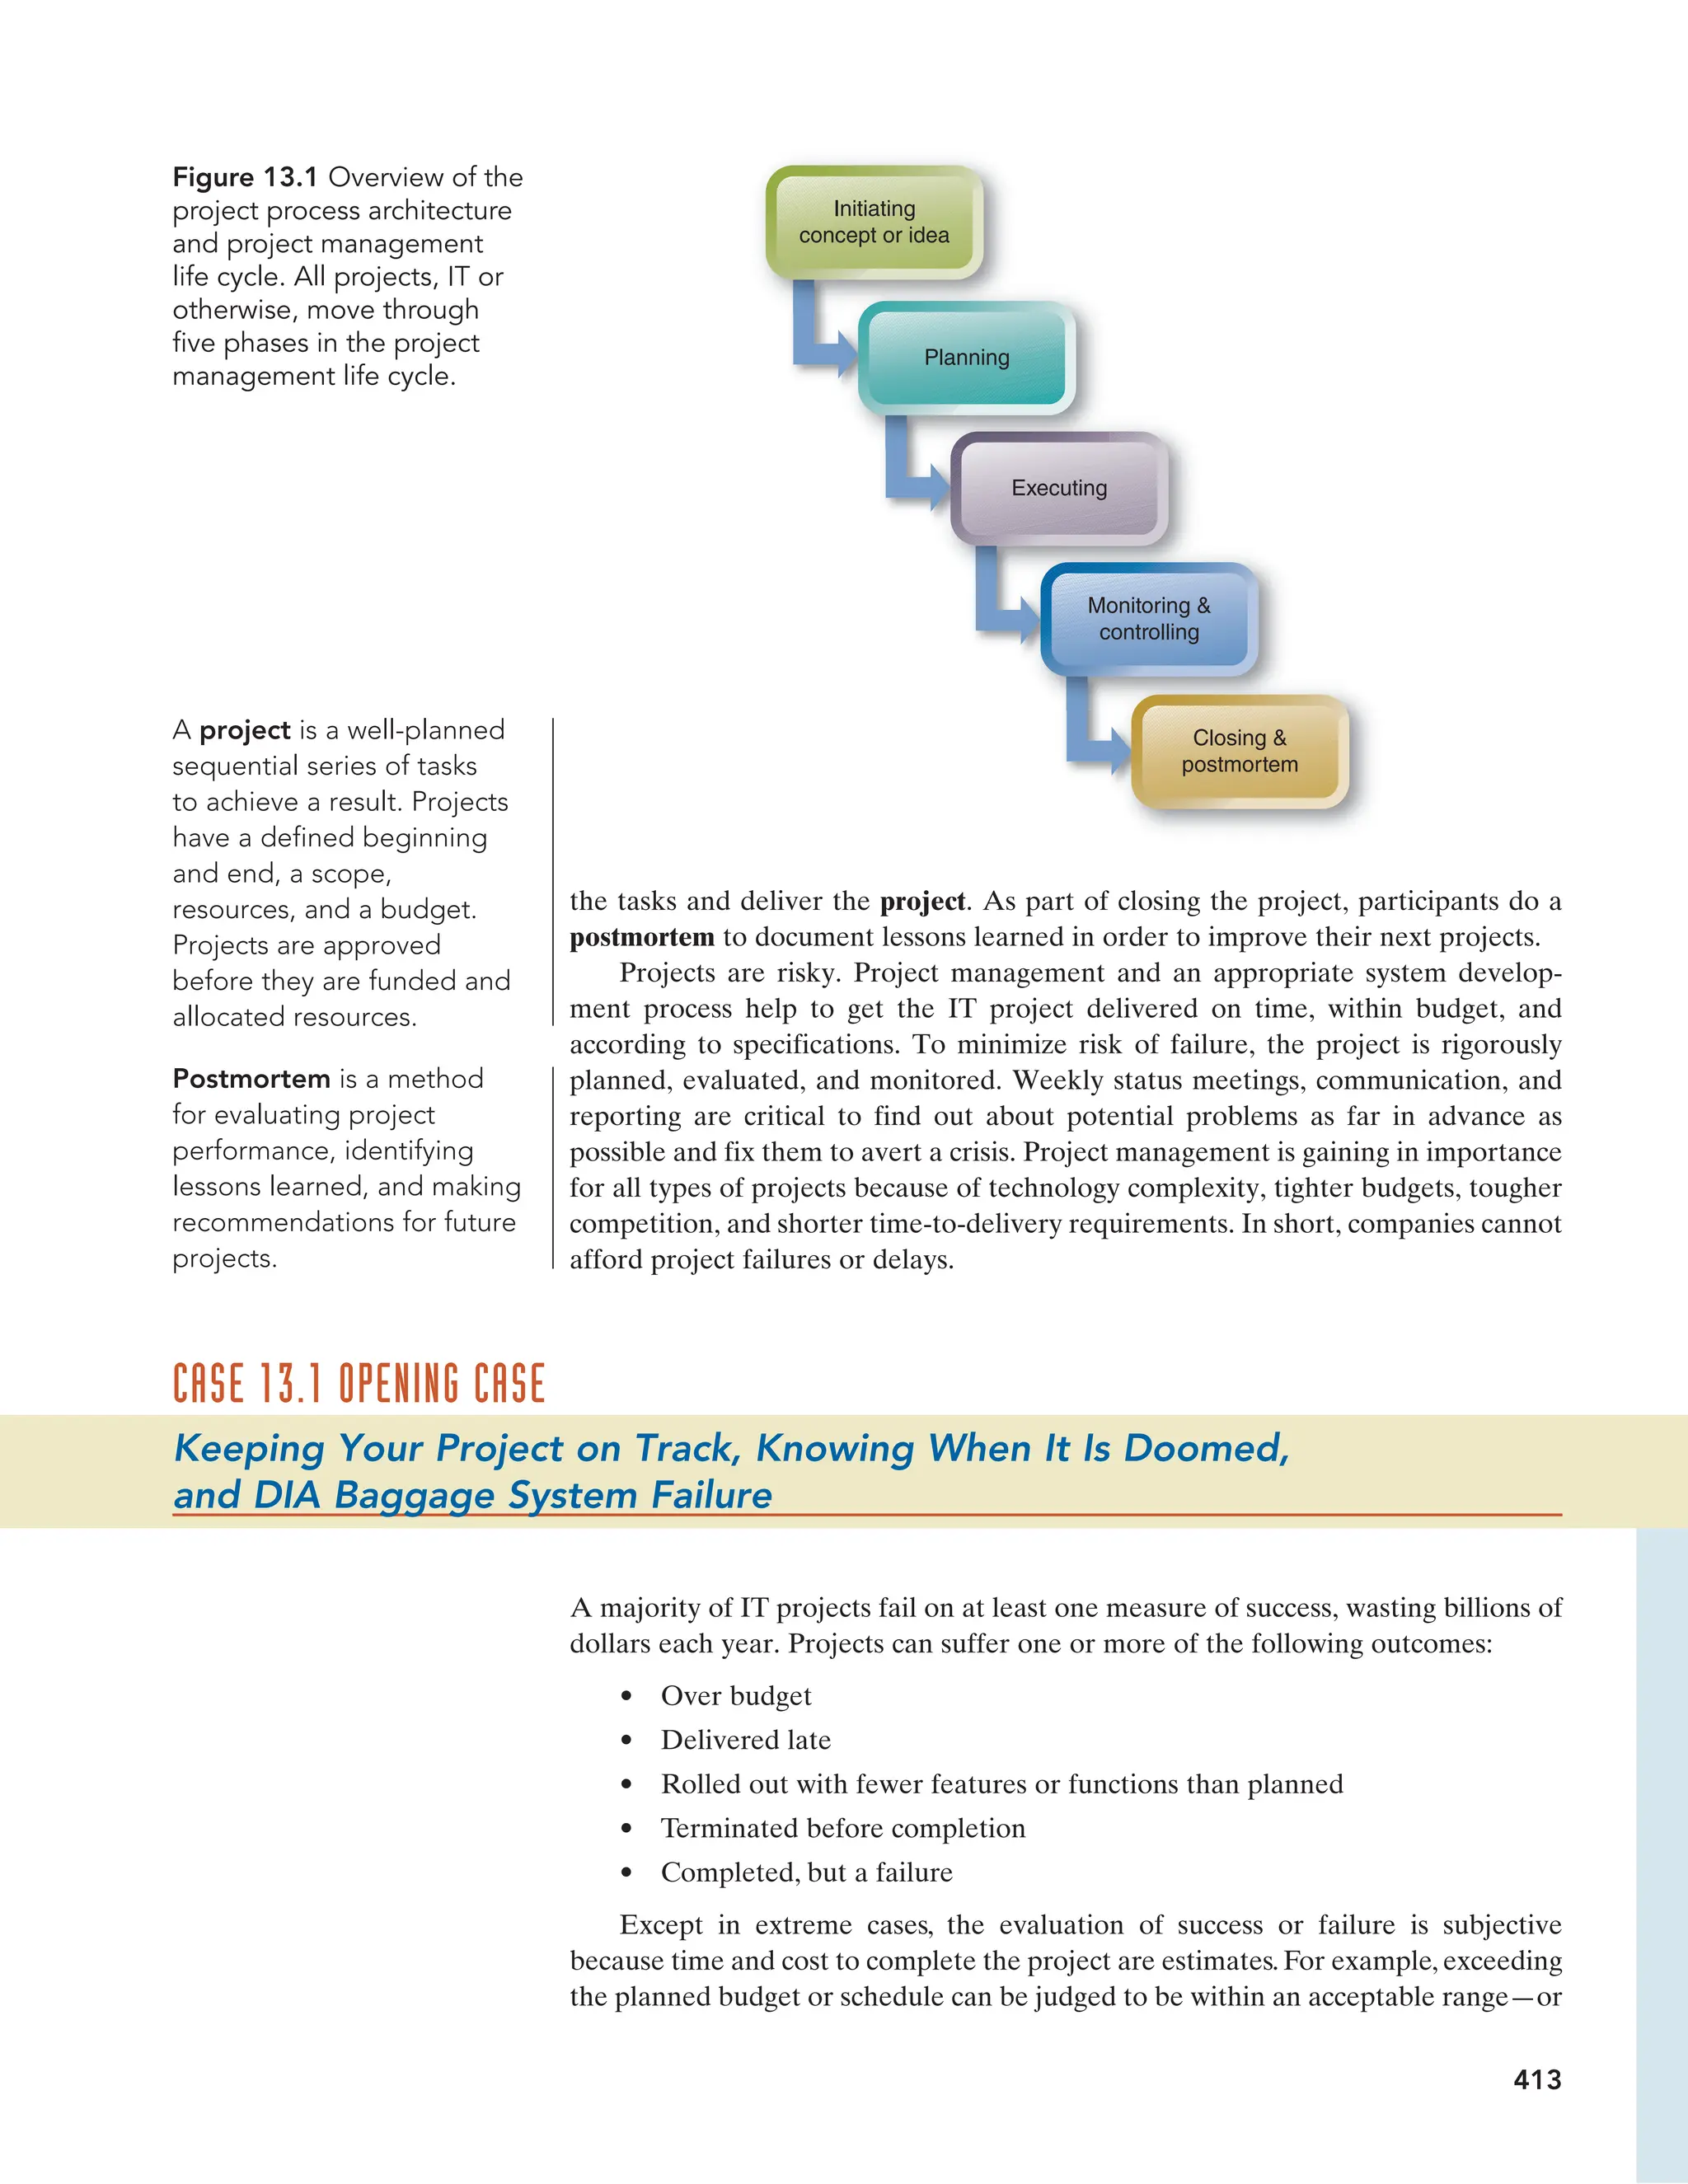
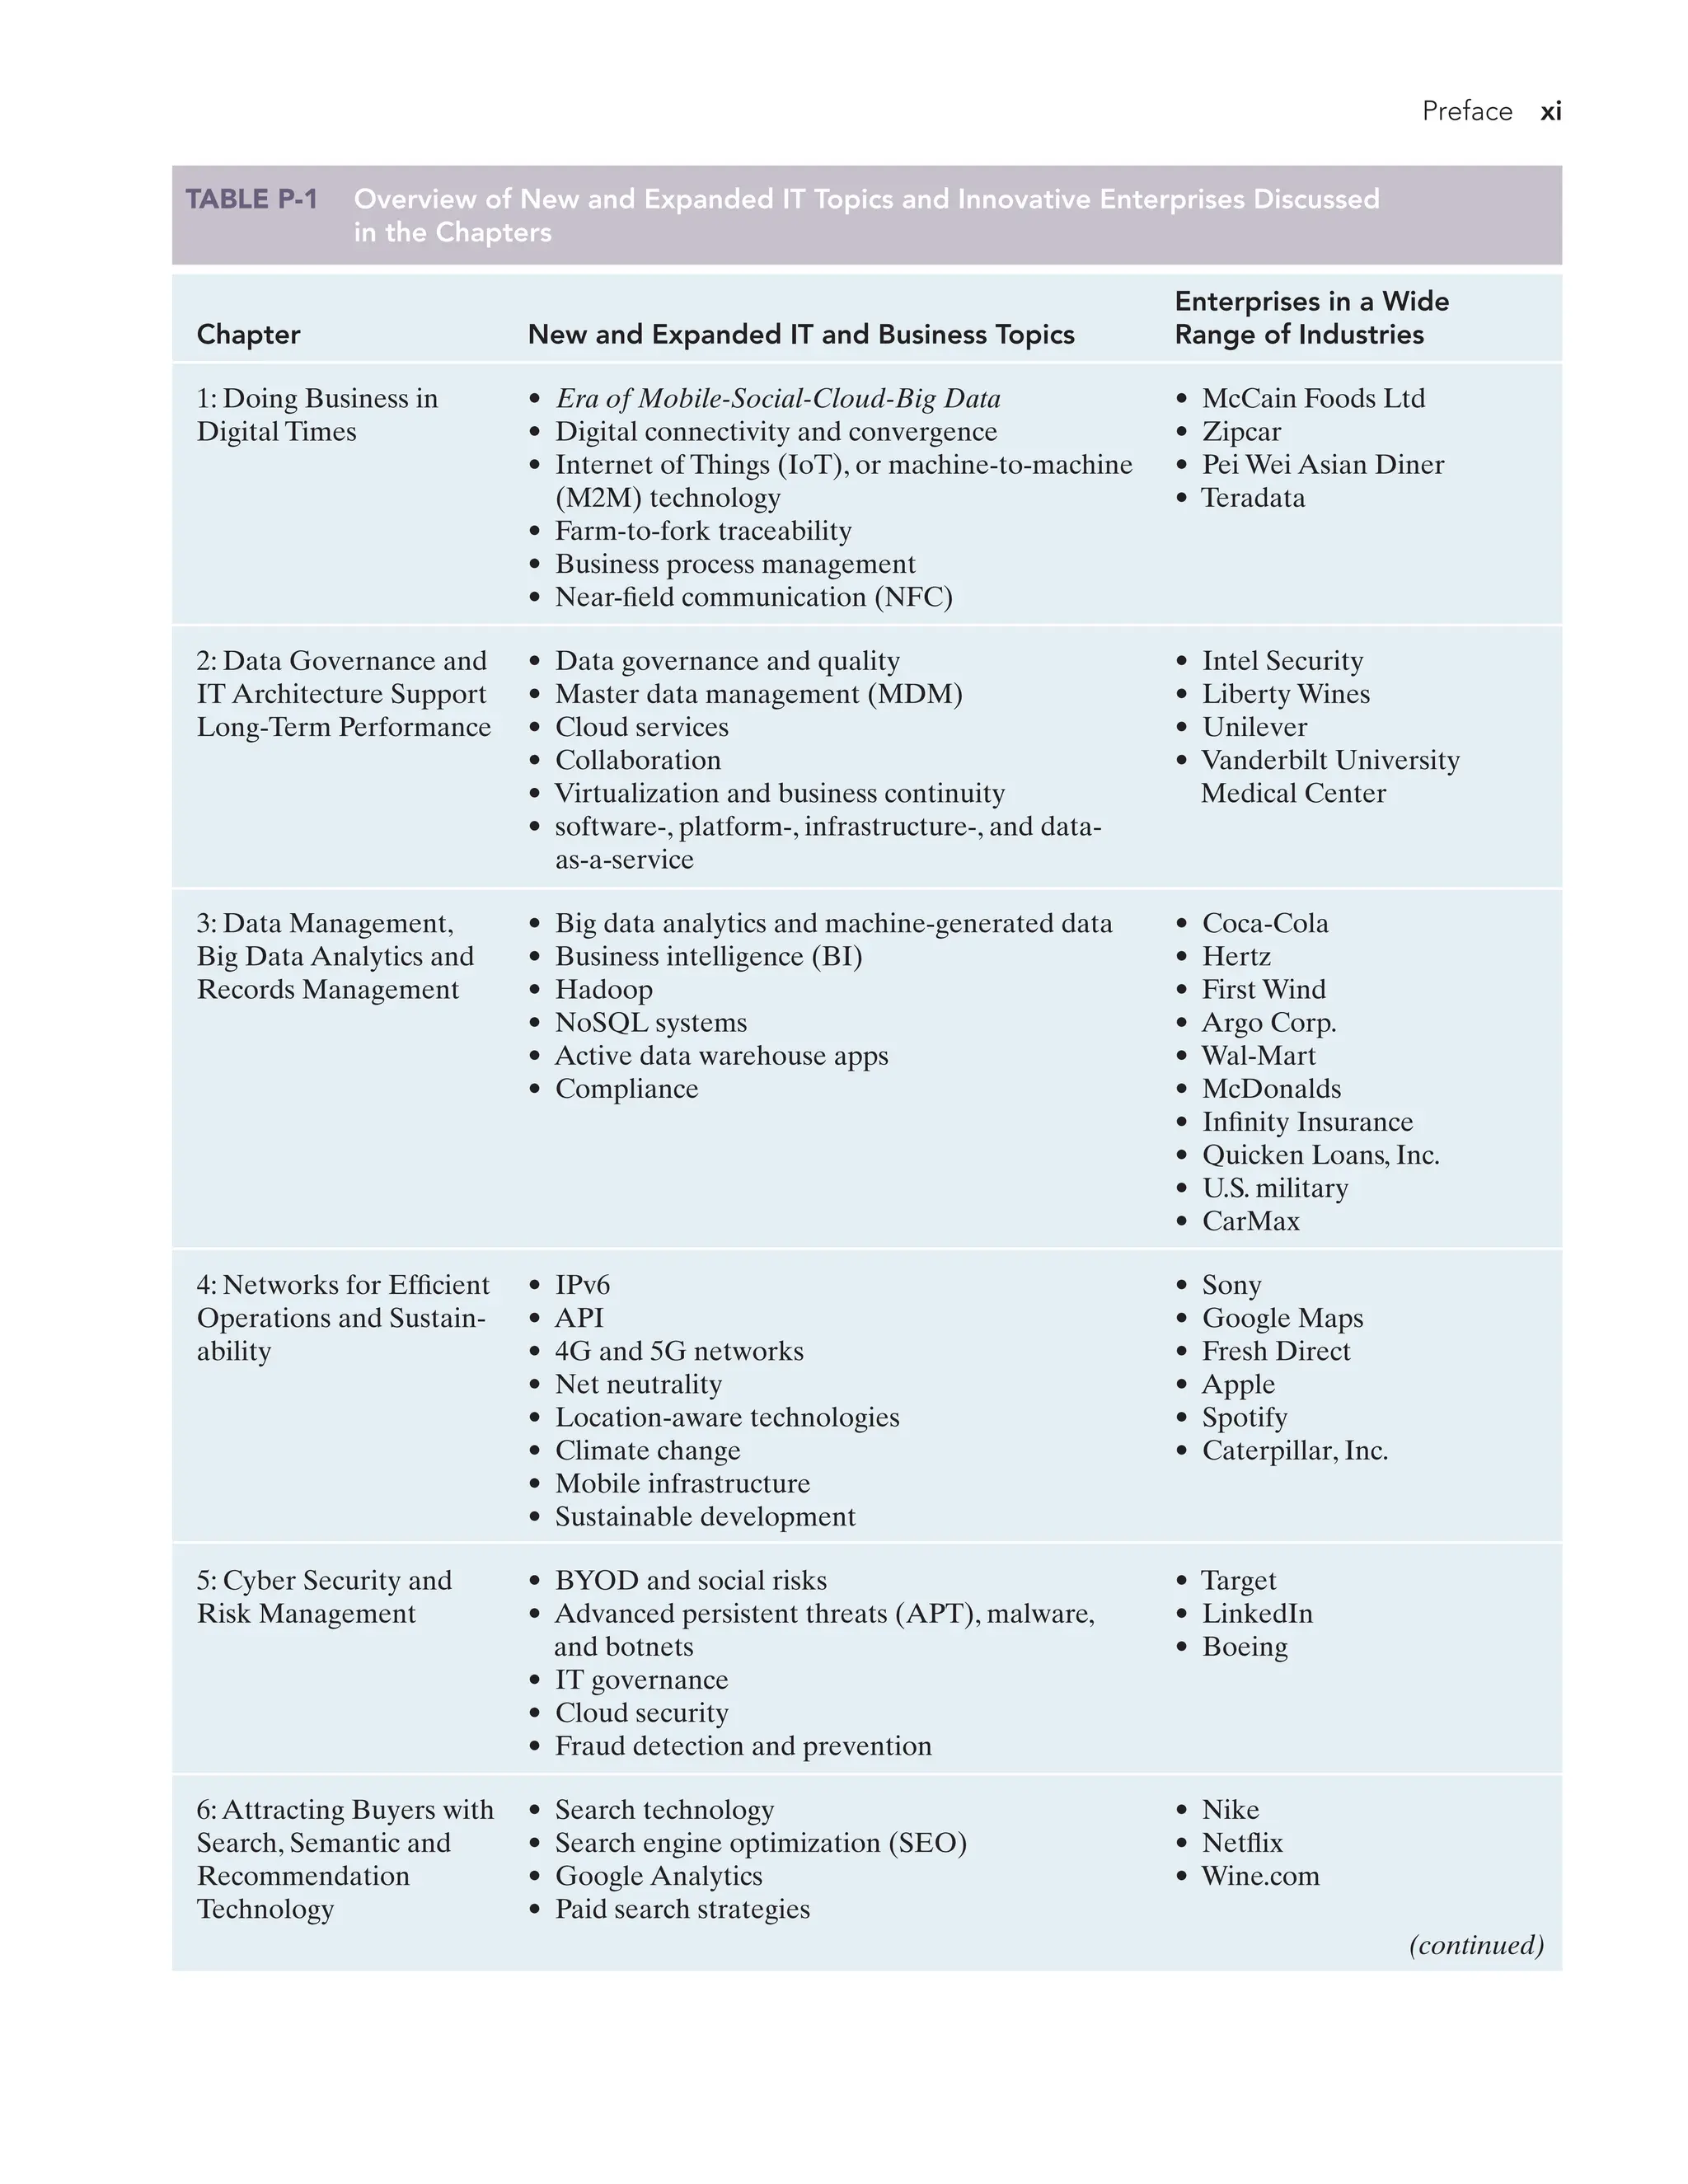
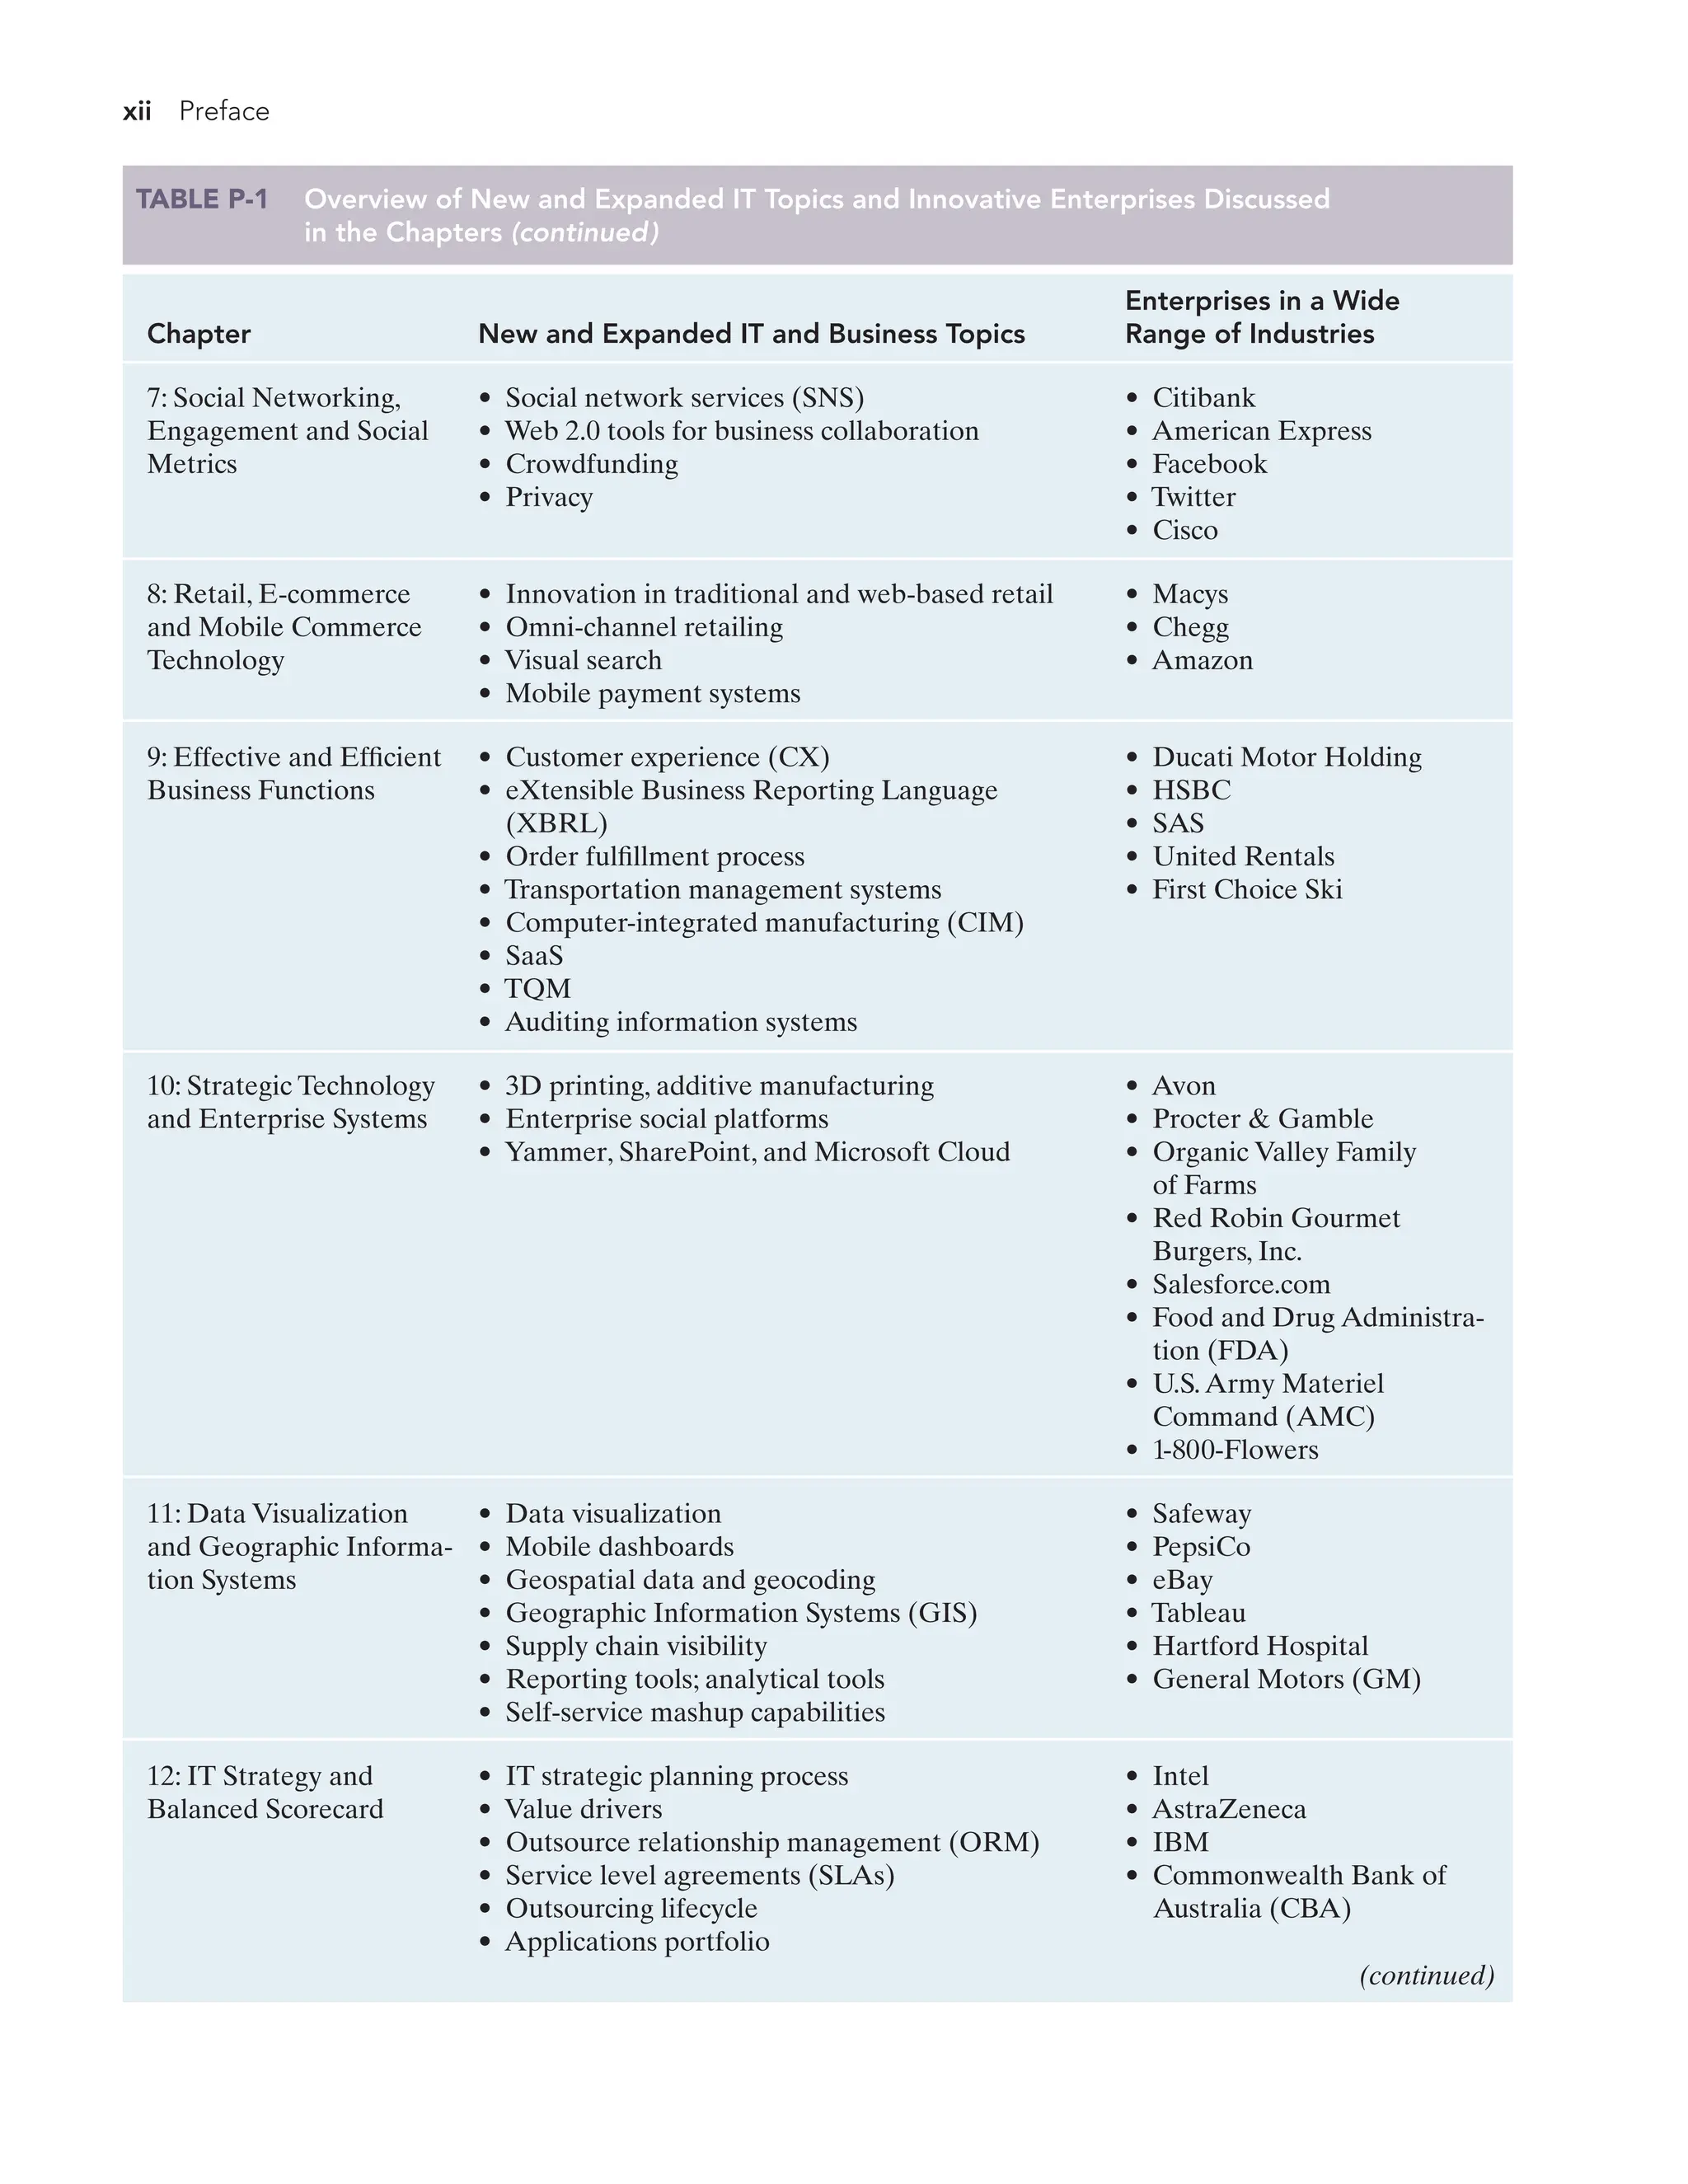
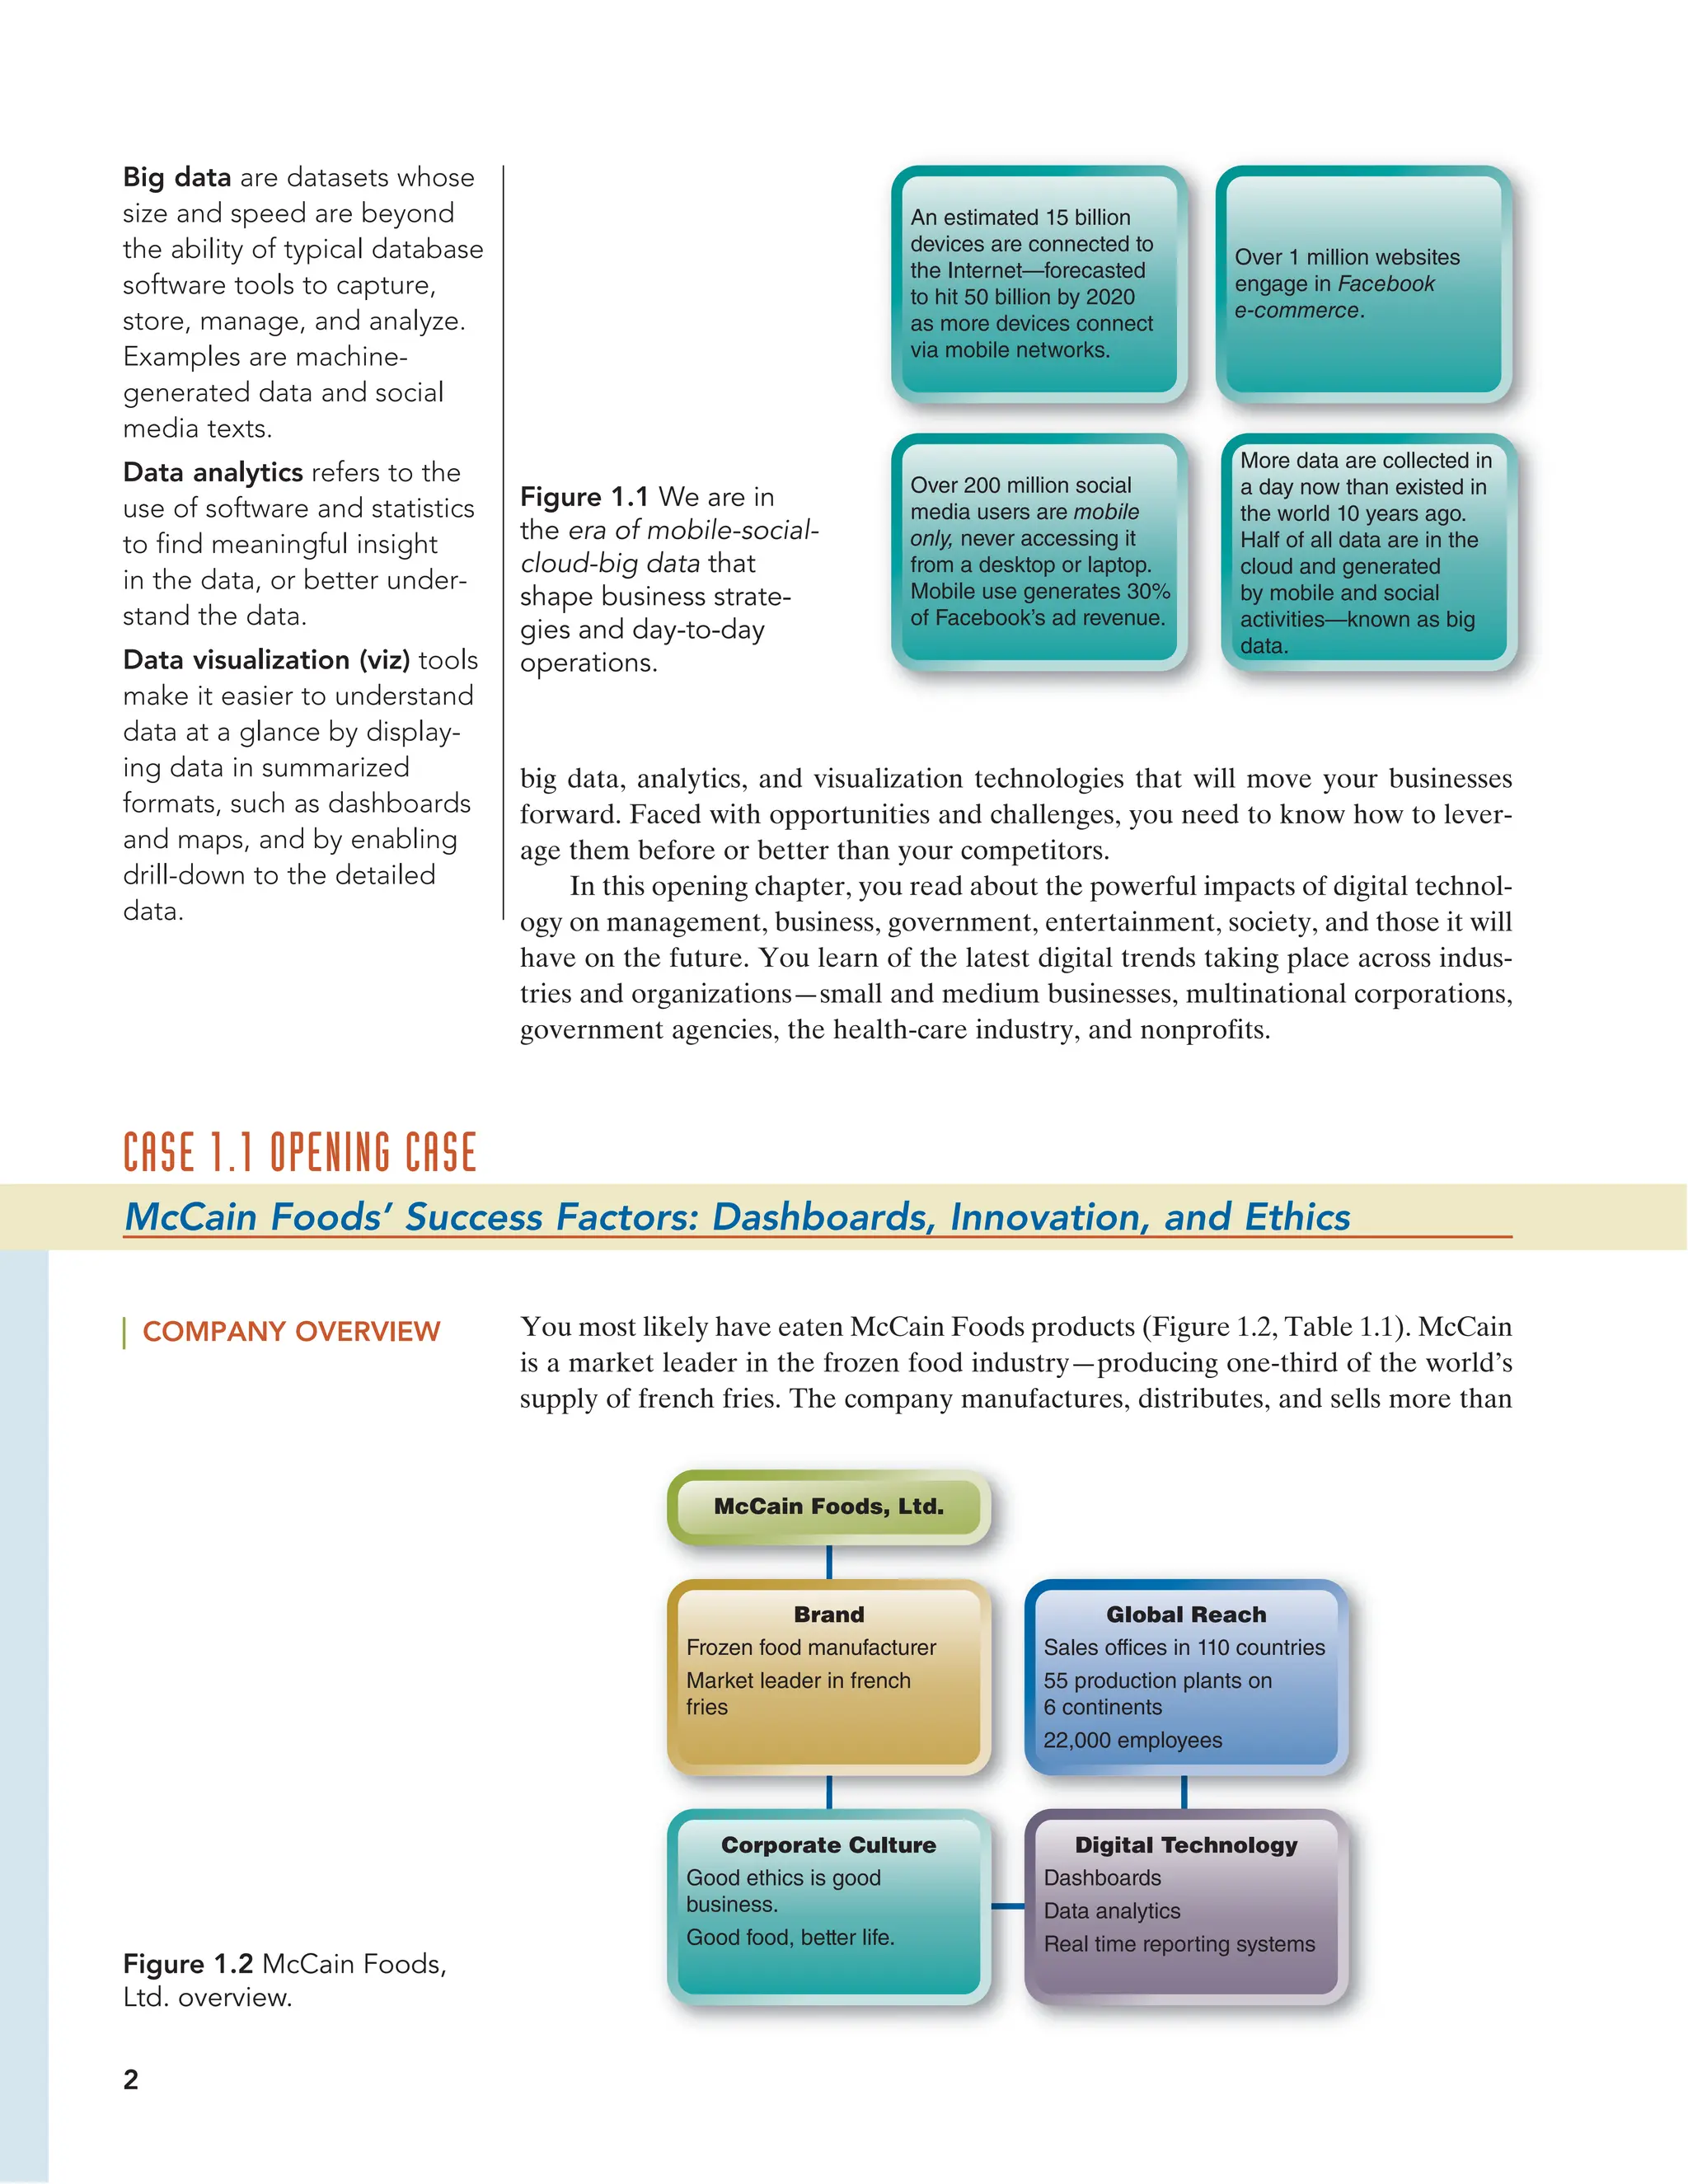
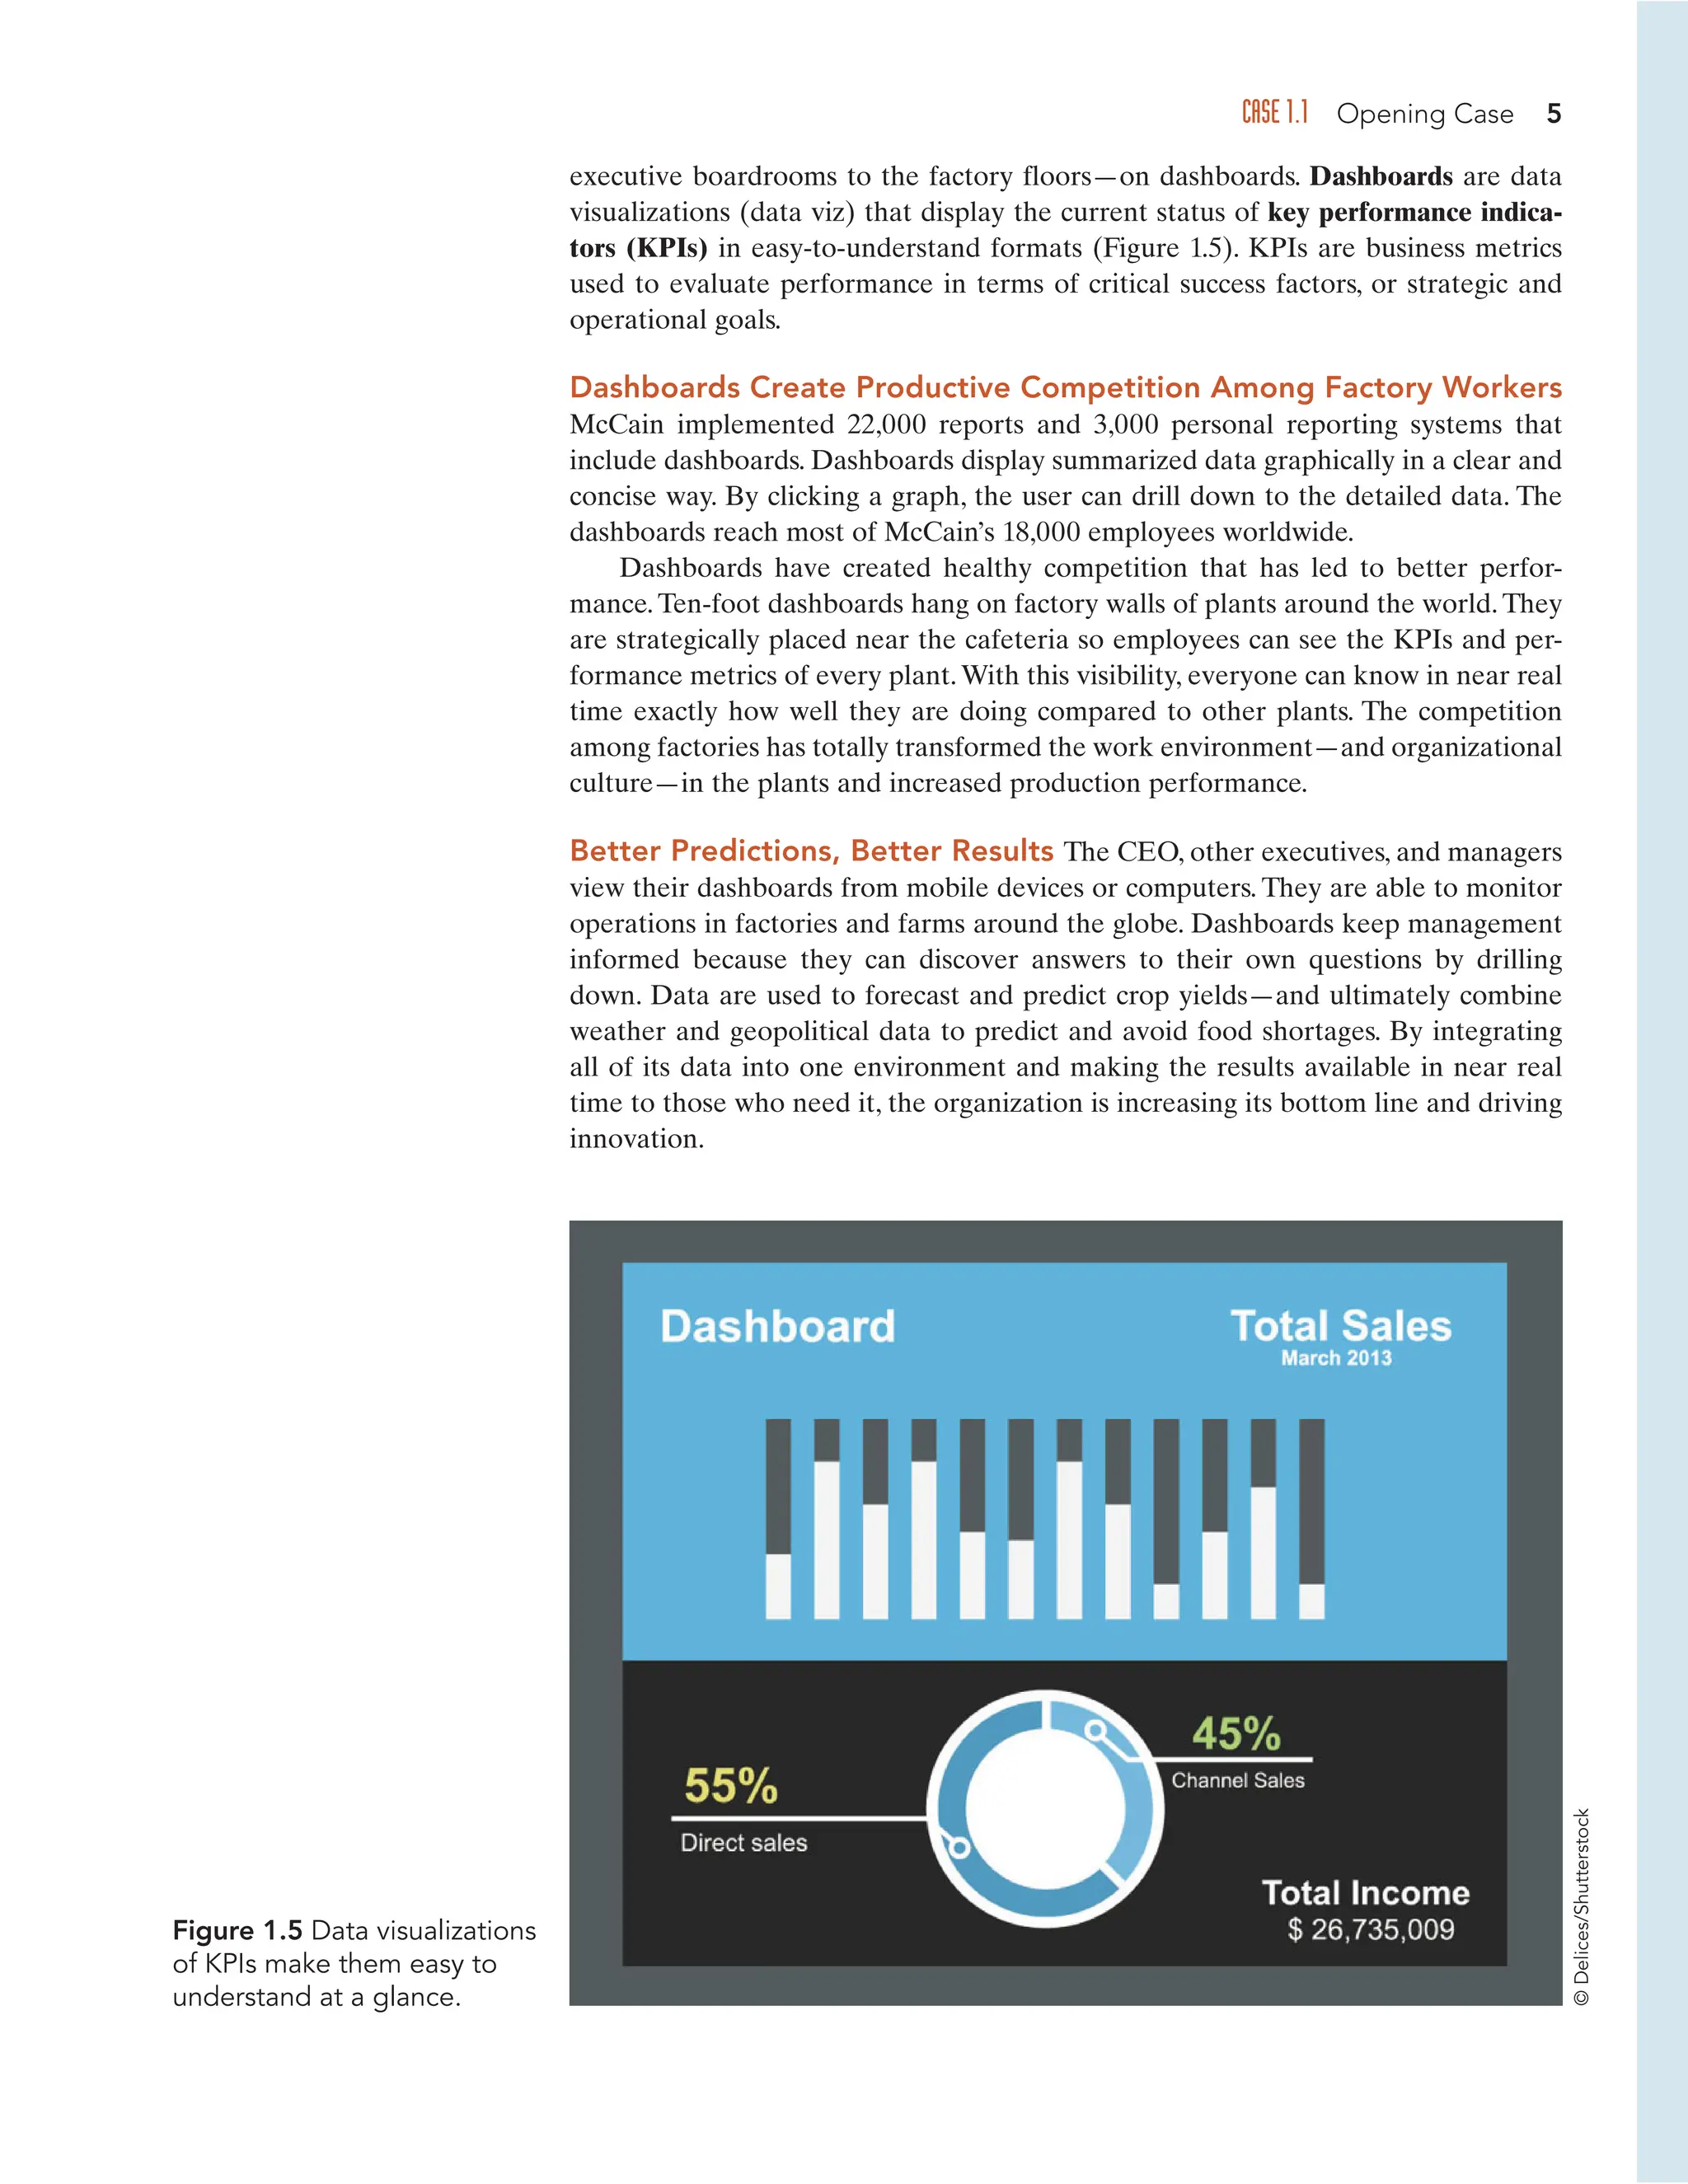
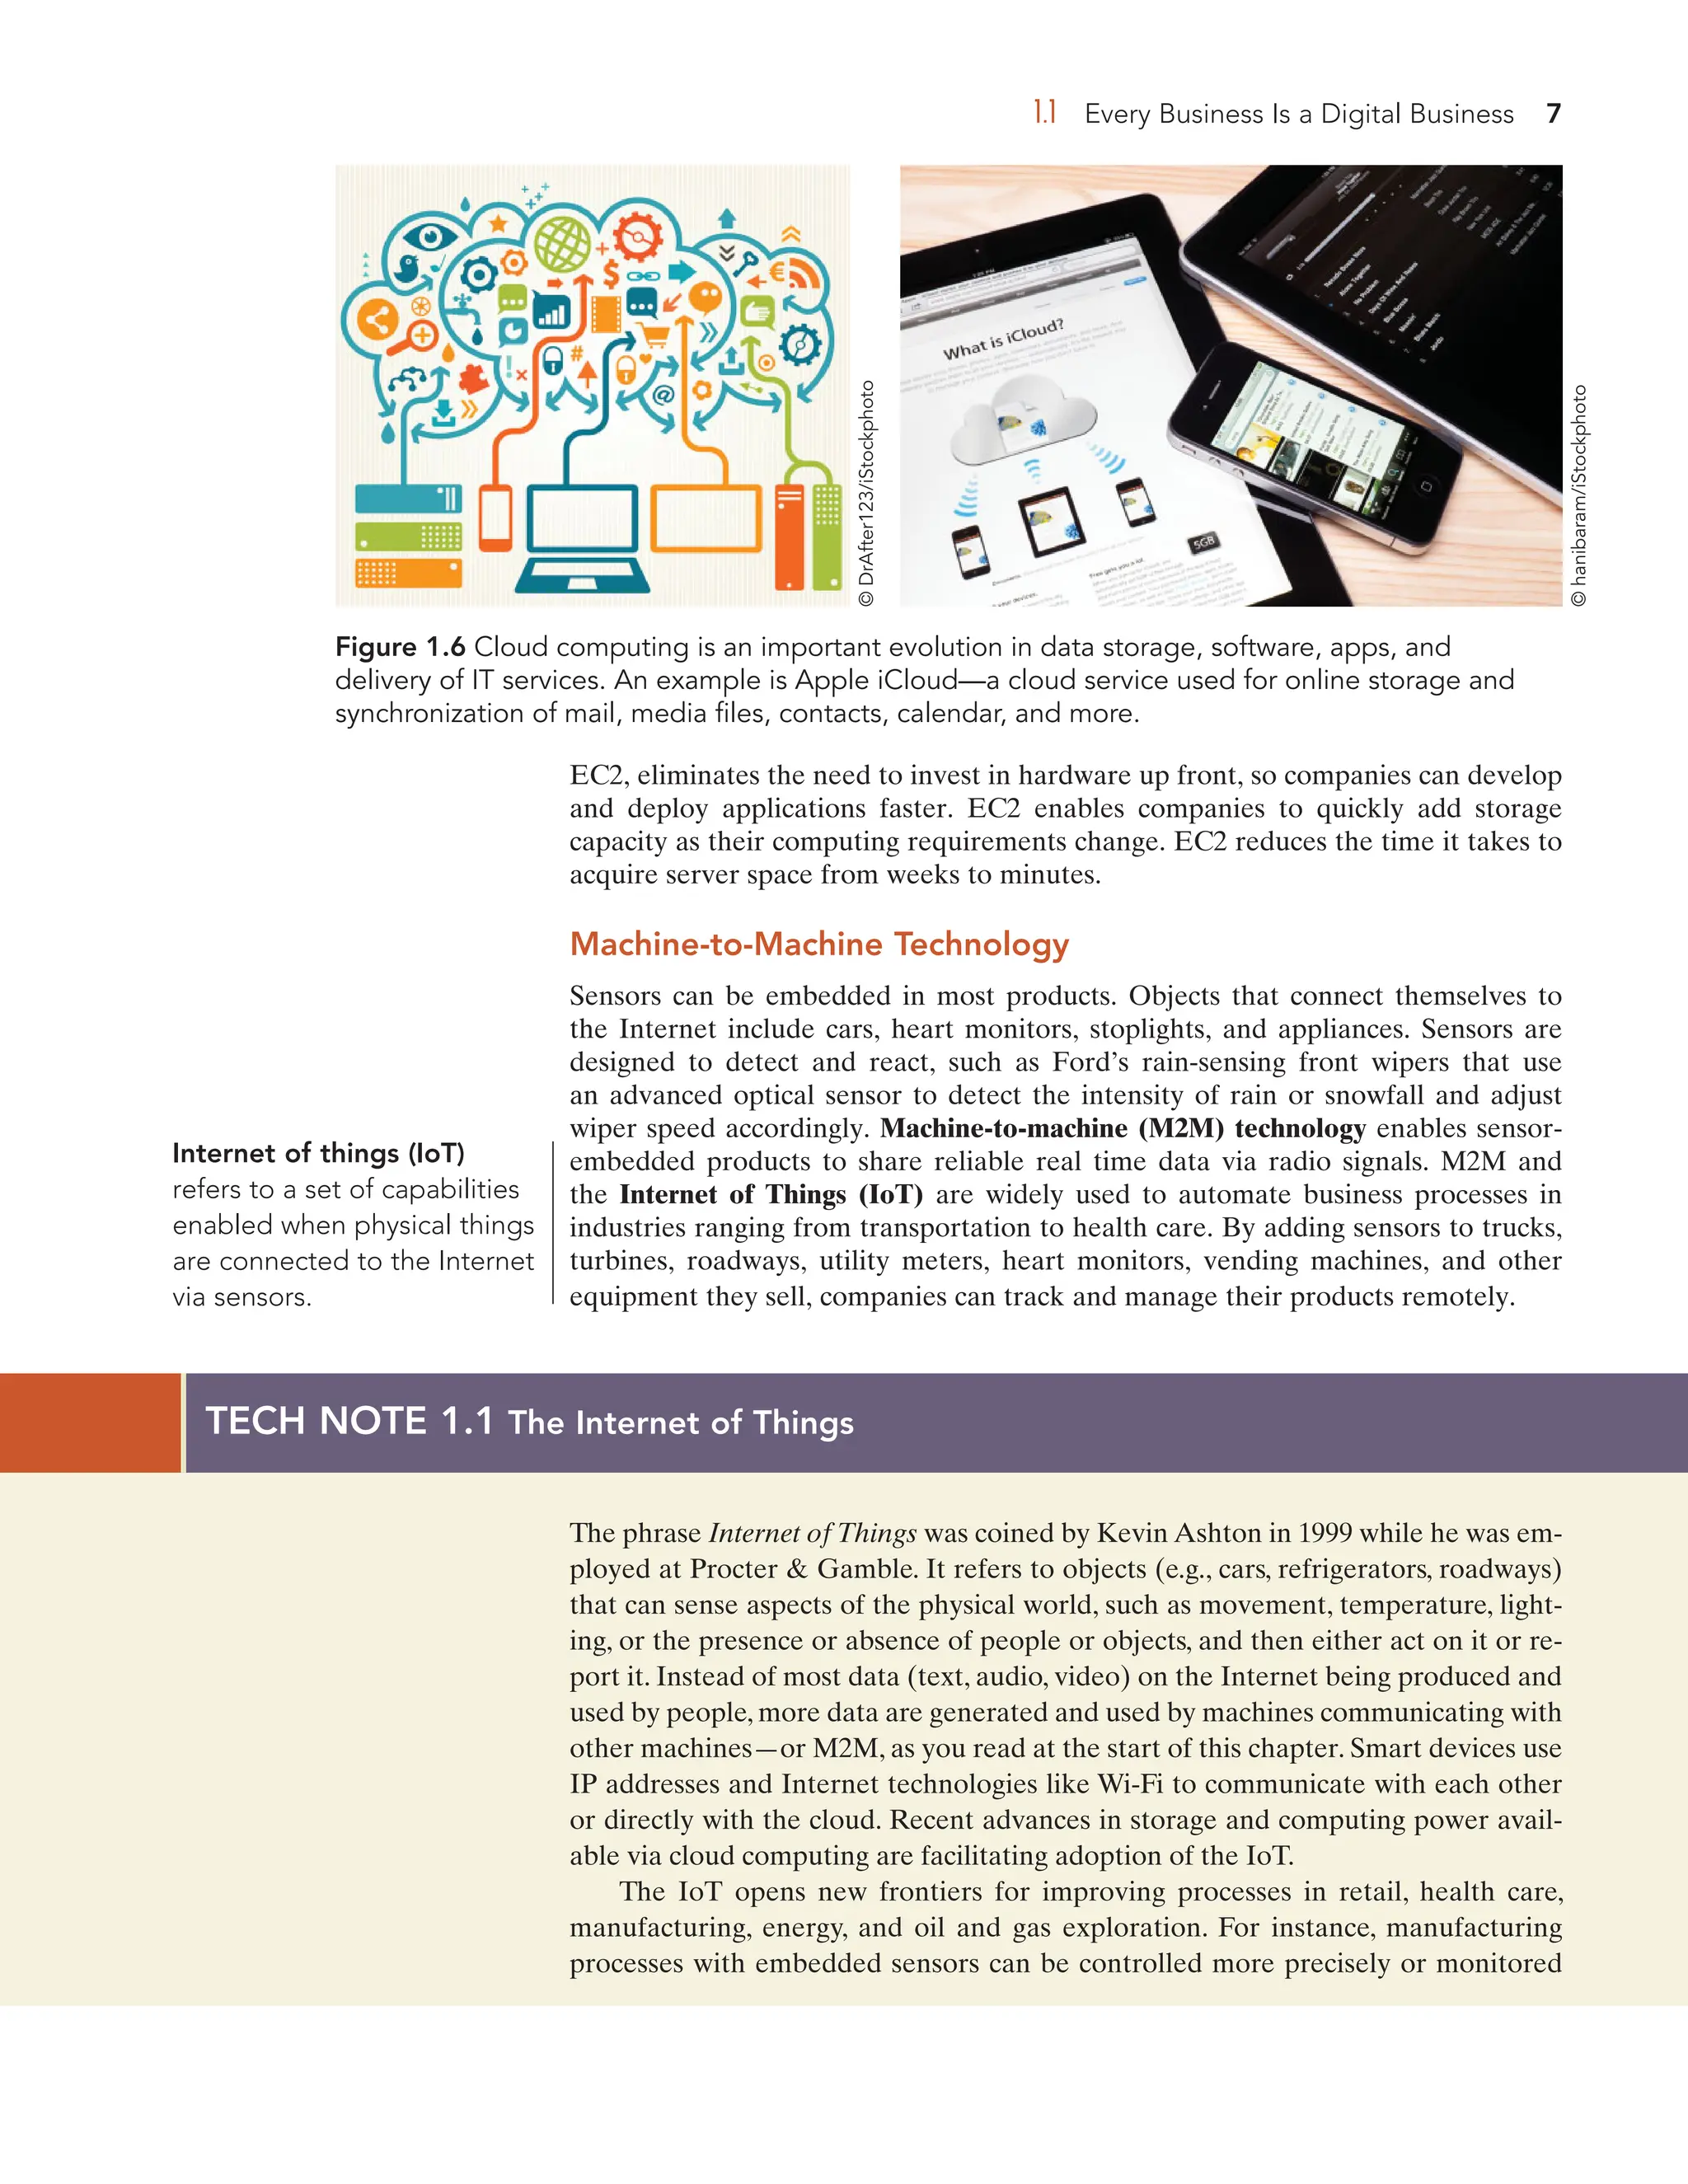
The document outlines a comprehensive approach to leveraging digital technologies for improving business processes and student engagement in educational settings. It discusses the integration of data analytics, cloud services, and technology trends to enhance operational efficiency, decision-making, and sustainable performance. Additionally, the tenth edition emphasizes project management tools, emerging technologies like 3D printing, and strategies for optimizing customer interactions.


![6.1 Using Search Technology for Business Success 195
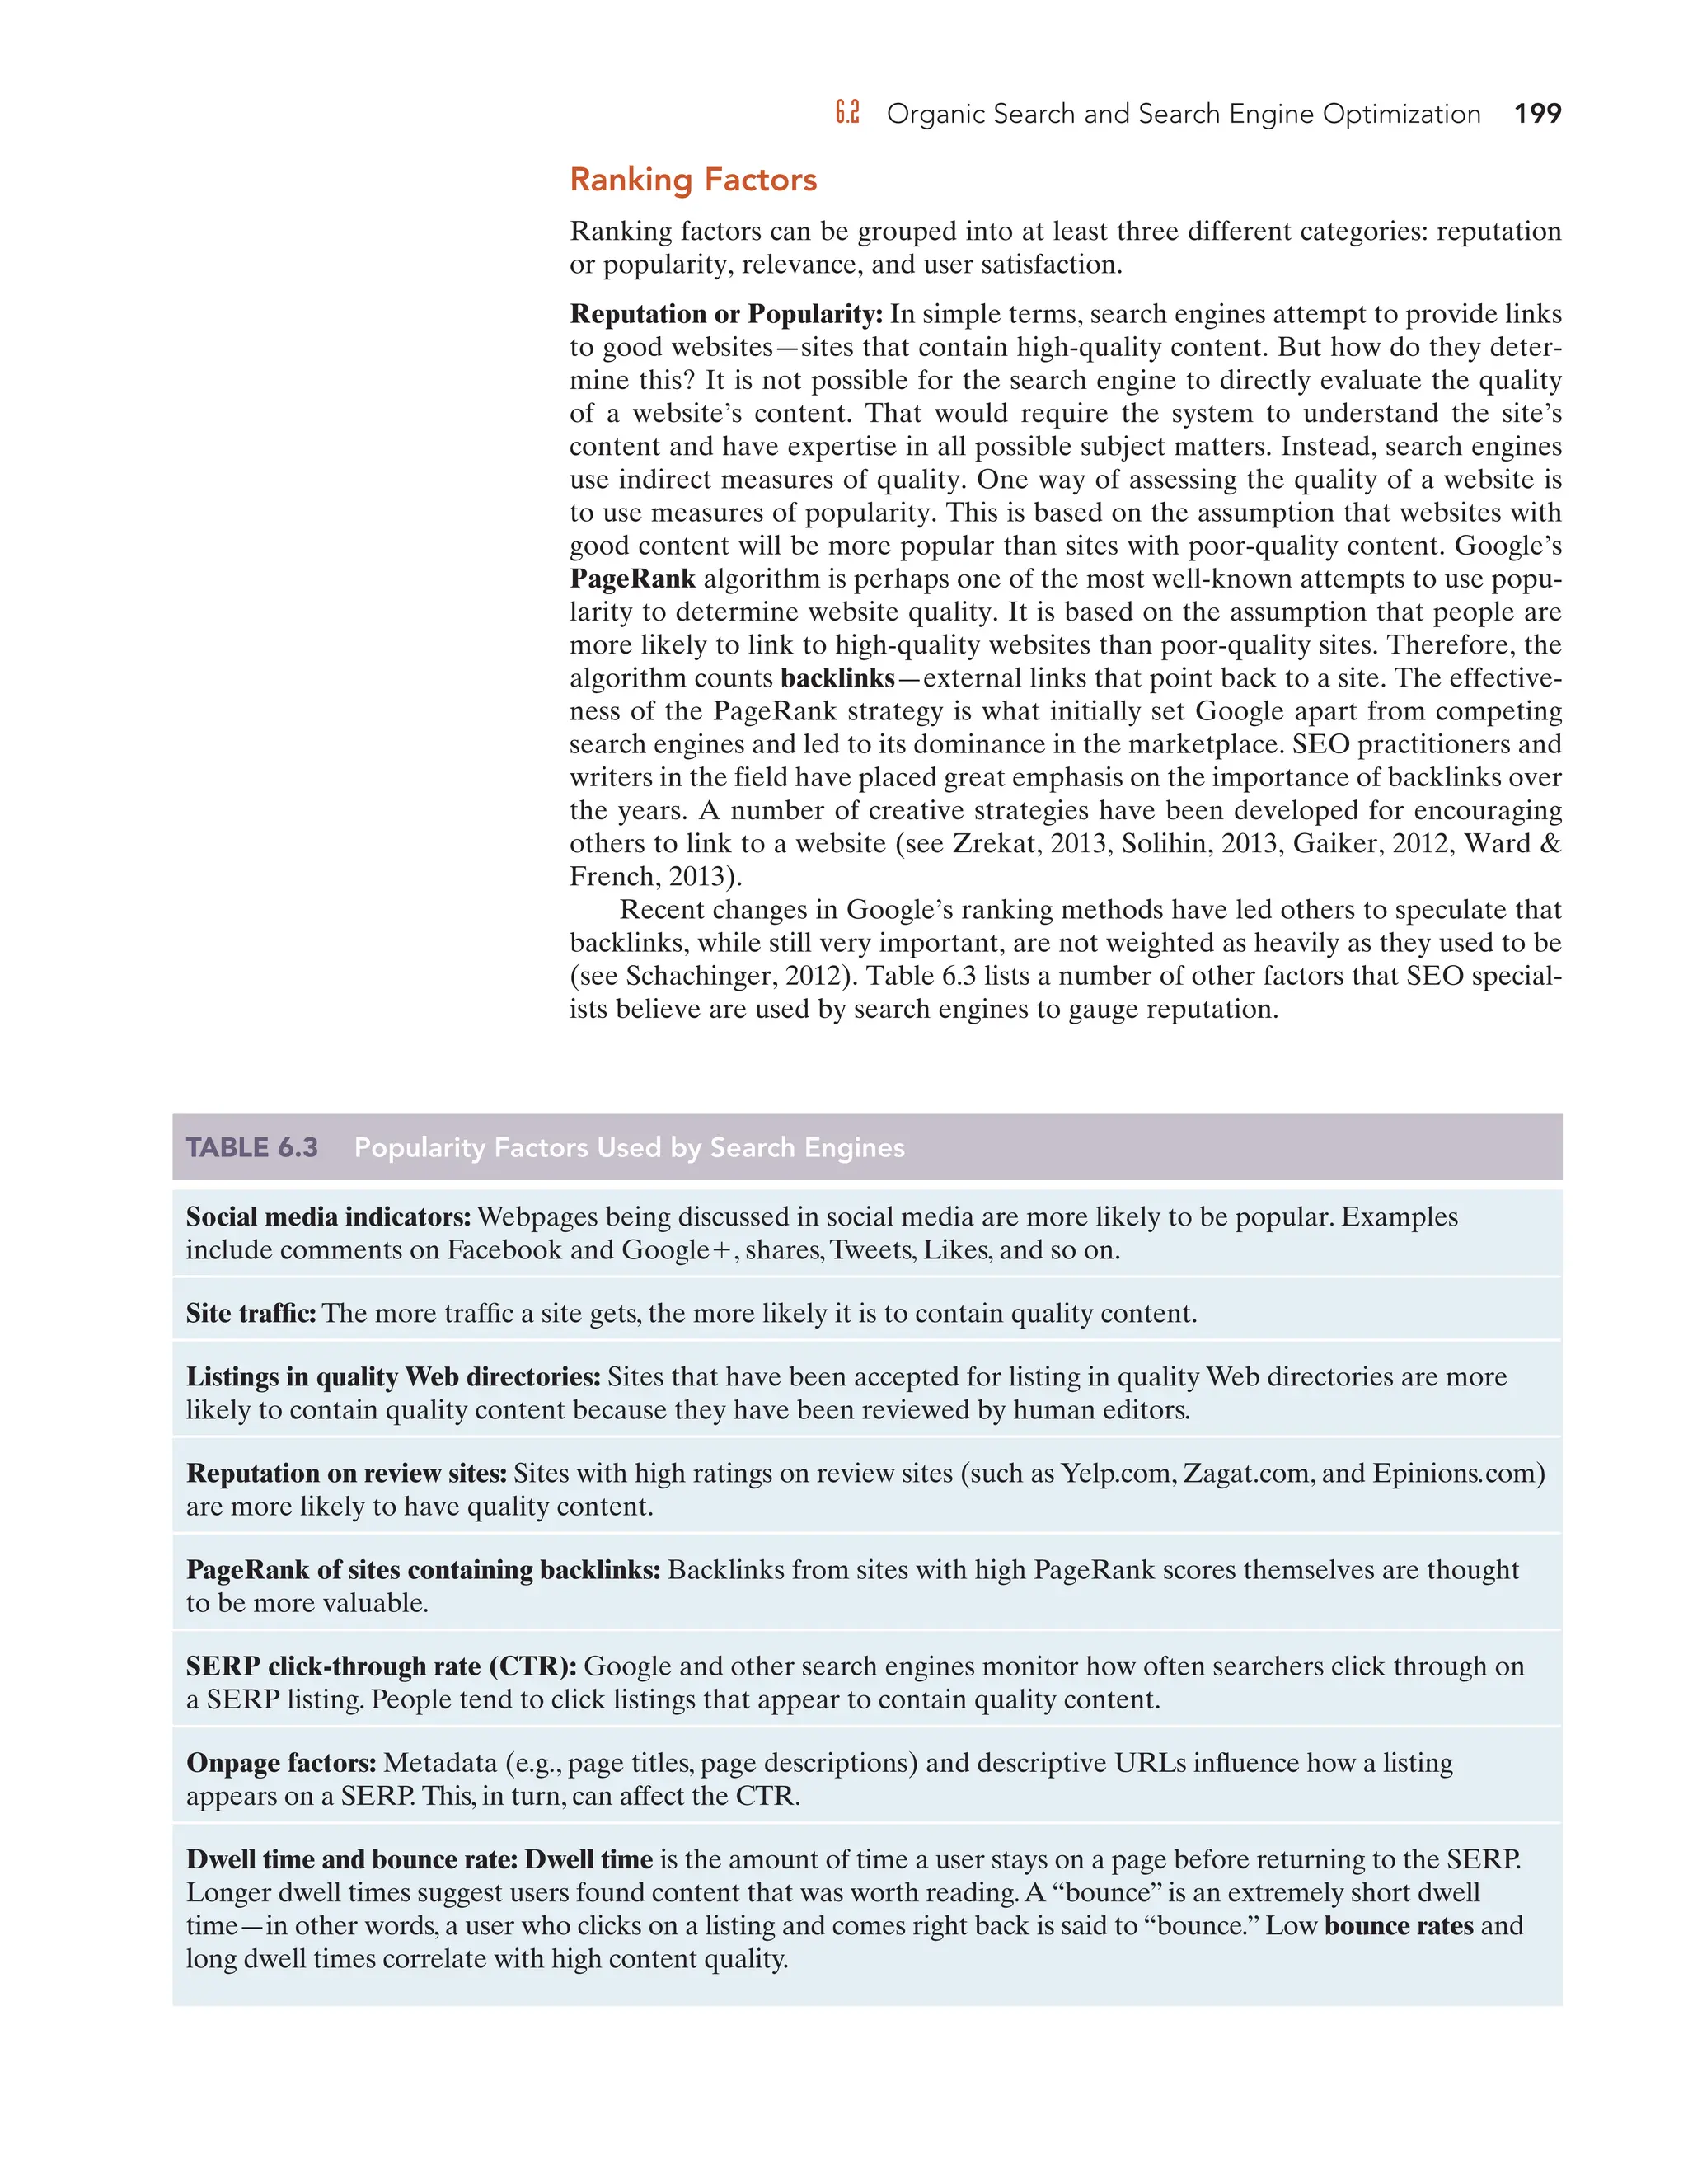
2. Providing content that is useful to people using mobile devices. Webmasters
should consider how people use their mobile devices and adjust content accord-
ingly (see Table 6.2).
When designing a mobile site for e-commerce, Web developers should make
sure that information about store location, product reviews, and promotional offers is
easily available and optimized so that it is likely to appear in a mobile SERP. Mobile
shoppers also use barcode scanning apps as a kind of mobile search engine for locat-
ing product reviews and price comparisons while shopping in stores. This practice,
called showrooming, is becoming increasingly popular with consumers and creating a
great deal of frustration and worry on the part of brick-and-mortar retailers.
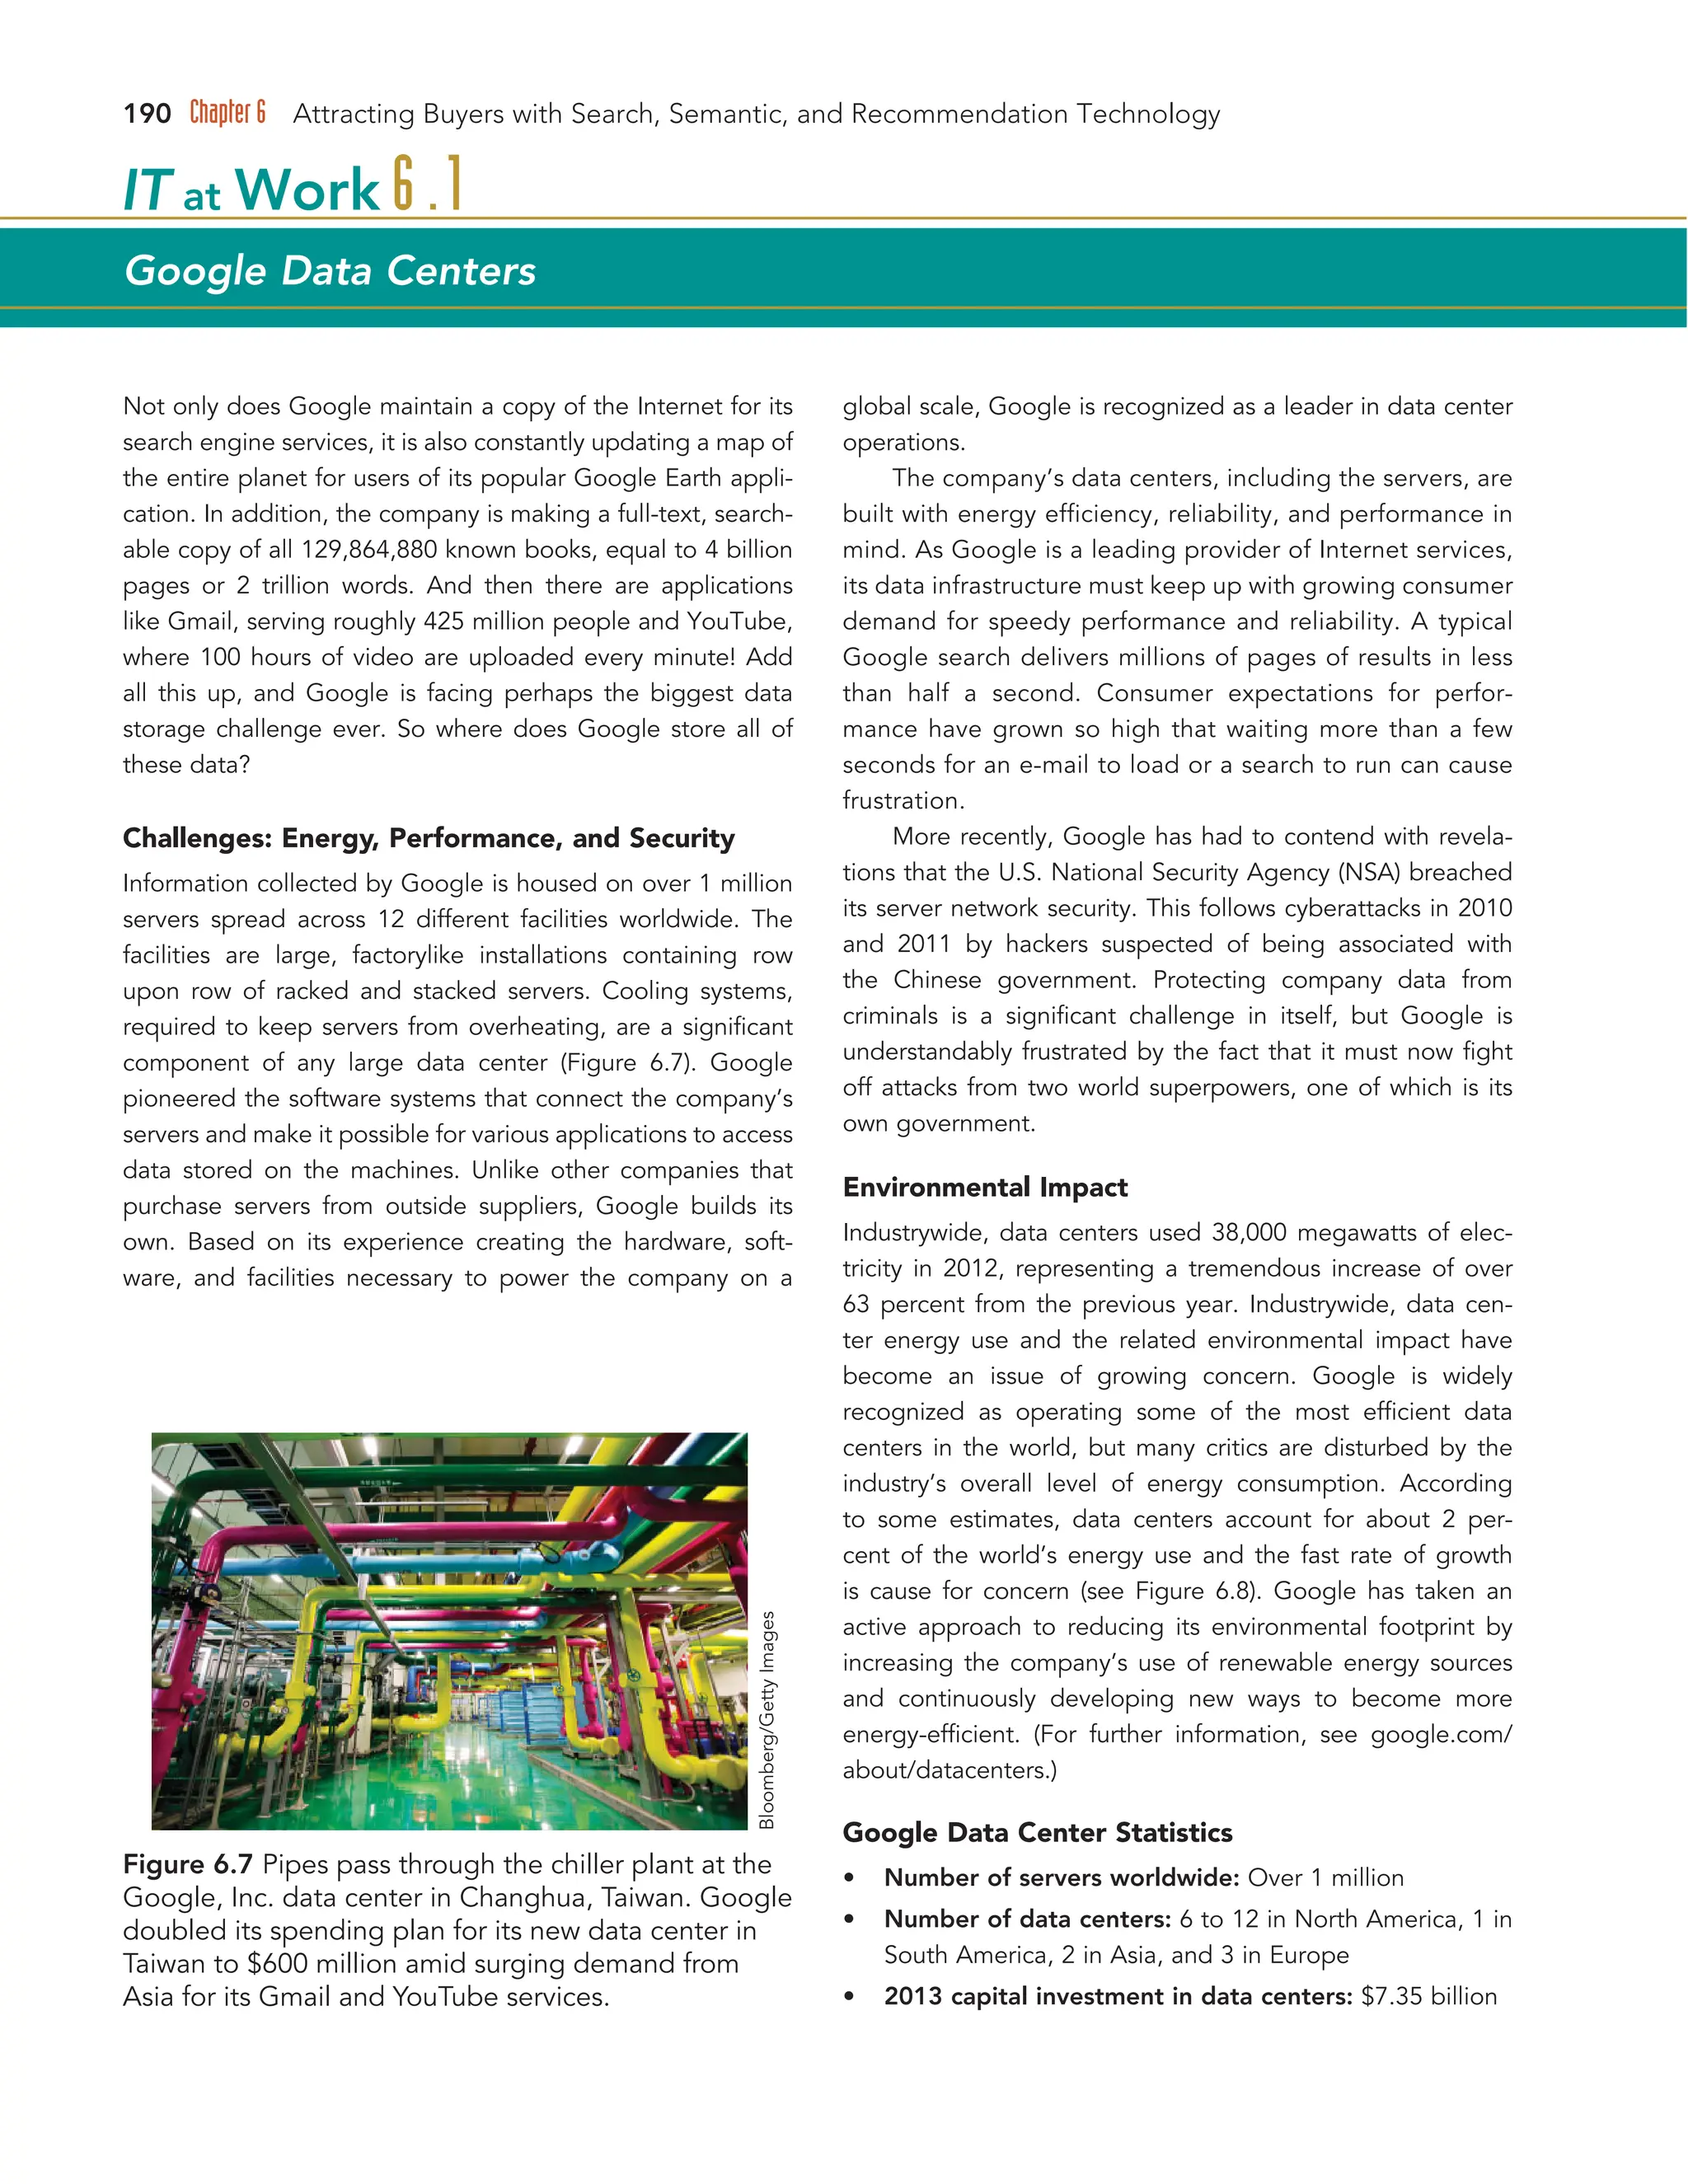
Web Search for Business
Commercial search engines and Web directories are useful tools for knowledge
workers in business. To use search engines effectively, workers should familiar-
ize themselves with all the features available on the search engine they use. Since
Google is the most popular search engine, we highlight some of those features
below. Many of these features are also available on Bing.com.
• Focused search: You can focus your search to information in different
formats—webpages, videos, images, maps, and the like—by selecting the
appropriate navigation button on the SERP page.
• Filetype: If you are looking specifically for information contained in a
certain file format, you can use the “filetype:[file extension]” command
following your keyword query. For instance, the search “private colleges
filetype:xls” will produce links to MSExcel files with information related to
private colleges. Use this command to find Adobe files (pdf), MSWord files
(doc), PowerPoint files (ppt), and so on.
• Advanced search: To narrow your search, go to the Advanced Search panel.
From this page, you can set a wide range of parameters for your search,
including limiting the search to certain domains (e.g., .gov, .org, .edu), lan-
guages, dates, and even reading level. You can also use this to narrow your
search to a particular website.
• Search tools button: Allows you to narrow your results to listings from spe-
cific locations or time frames.
• Search history: Have you ever found a page using a search engine, but later
had trouble finding it again? If you are logged into your Google account
while using the search engine, it’s possible to review your search history. It
will show you not only your search queries, but also the pages you visited
following each query.
Figure 6.10 Mobile phone
users watch One Direction
perform on Good Morning
America in New York City’s
Central Park on November 6,
2013.
©
JStone/Shutterstock.com](https://image.slidesharecdn.com/informationtechnologyformanagement-240705093952-20562a4a/75/Information-technology-for-management-pdf-211-2048.jpg)


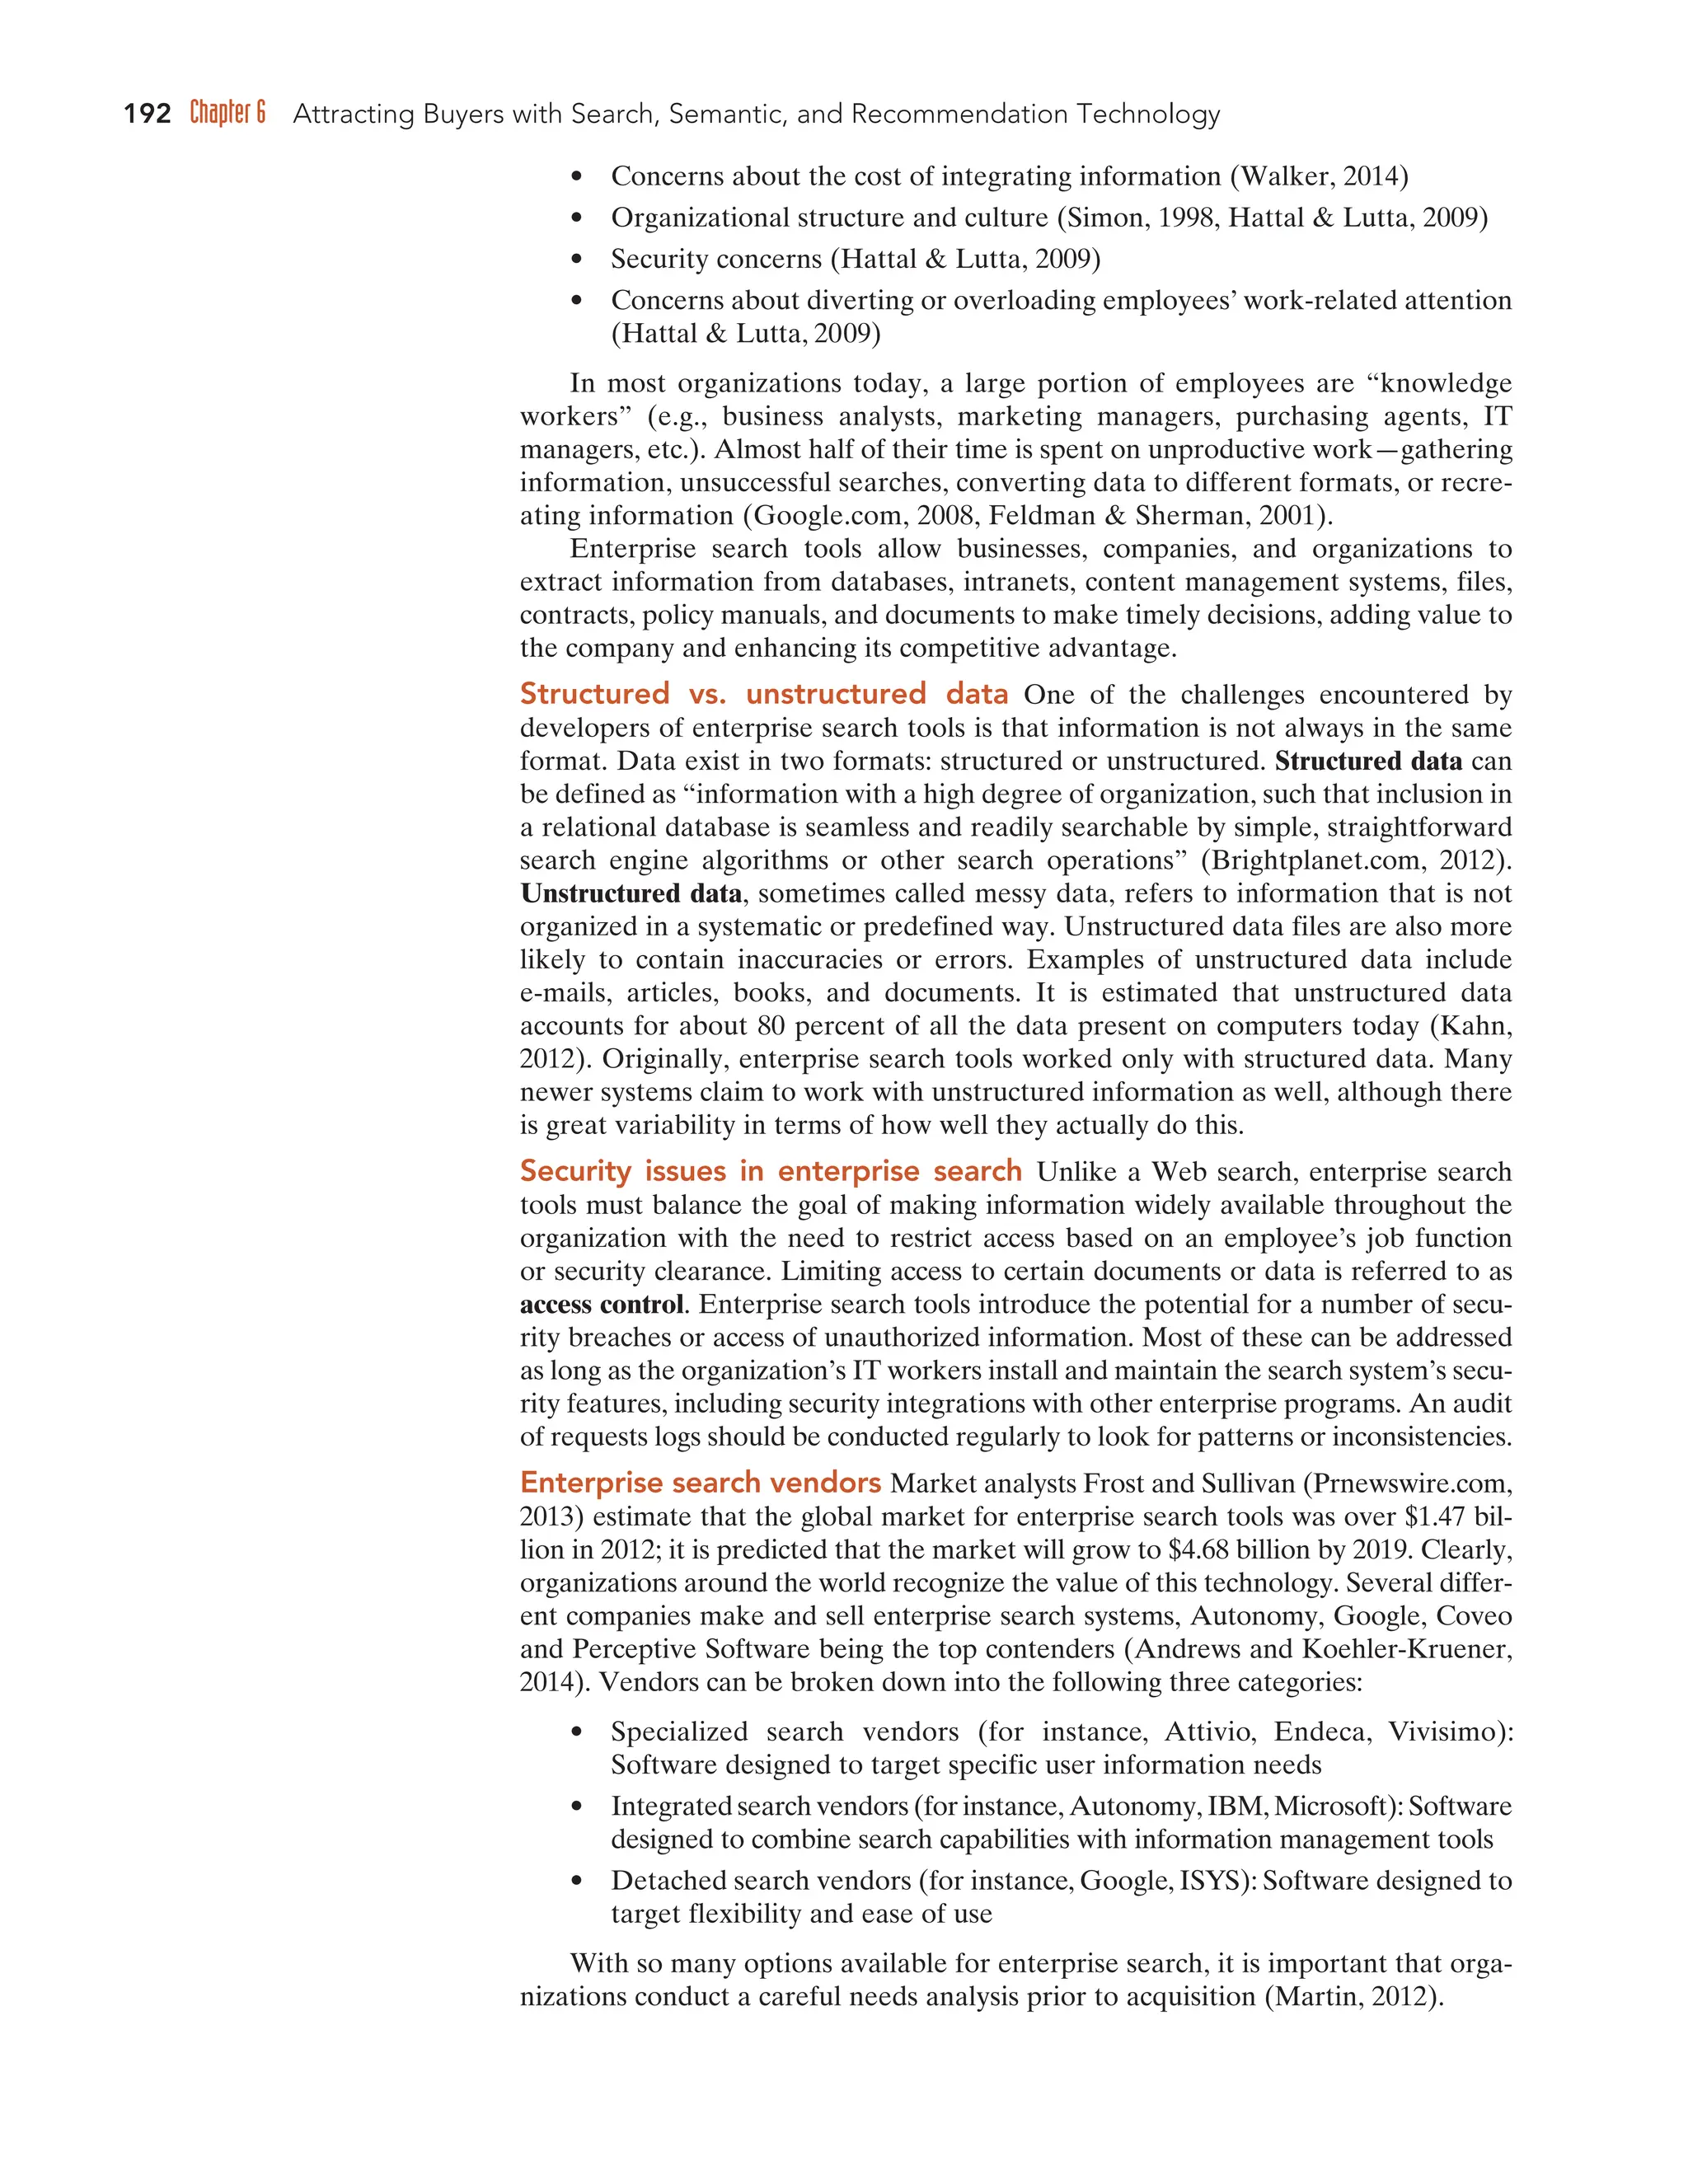
![6.4 A Search for Meaning—Semantic Technology 207
Semantic search engines could be programmed to take advantage of metadata
tags, but their usefulness would be very limited if they could only identify Web
content that had been tagged with metadata:
“Semantic search is the process of typing something into a search engine
and getting more results than just those that feature the exact keyword
you typed into the search box. Semantic search will take into account
the context and meaning of your search terms. It’s about understanding
the assumptions that the searcher is making when typing in that search
query.” (DiSilvestro, 2013)
Instead of relying solely on metadata tags, current semantic search engines
use alternative approaches to understanding the meaning of content on the Web.
Semantic search engines use natural language processing, contextual cues, syn-
onyms, word variations, concept matching, specialized queries, and other strategies
to generate search results that are superior to those created by simple keyword-
matching algorithms. Understanding the context or intent of users is particularly
important. If a search engine understood the proper context of a search query con-
taining the word “Disneyworld,” it would know if the search engine should return
information that would be of interest to people
• planning a vacation, or
• looking for a job at the theme park, or
• interested in the history of Disneyworld.
Simple keyword matching is likely to produce a wide assortment of informa-
tion, much of which will not be of interest to users with a specific goal in mind.
Semantic Search Features and Benefits
So what can semantic search engines do that is superior to search engines that work
solely on keyword matching? Grimes (2010) provides a list of practical benefits that
could result from semantic search technology:
Related searches/queries. The engine suggests alternative search queries that
may produce information related to the original query. Search engines may also
ask you, “Did you mean: [search term]?” if it detects a misspelling.
Reference results. The search engine suggests reference material related to the
query, such as a dictionary definition, Wikipedia pages, maps, reviews, or stock
quotes.
Semantically annotated results. Returned pages contain highlighting of search
terms, but also related words or phrases that may not have appeared in the
original query. These can be used in future searches simply by clicking on them.
Full-text similarity search. Users can submit a block of text or even a full docu-
ment to find similar content.
Search on semantic/syntactic annotations. This approach would allow a user
to indicate the “syntactic role the term plays—for instance, the part-of-speech
(noun, verb, etc.)—or its semantic meaning—whether it’s a company name,
location, or event.” For instance, a keyword search on the word “center” would
produce too many results. Instead, a search query could be written using a syn-
tax such as the following:
organization center /organization
This would only return documents where the word “center” was part of an
organization’s name (e.g., Johnson Research Center or Millard Youth Center).
Google currently allows you to do something similar to specify the kind of files
you are looking for (e.g., filetype:pdf).](https://image.slidesharecdn.com/informationtechnologyformanagement-240705093952-20562a4a/75/Information-technology-for-management-pdf-223-2048.jpg)


![References 219
Brown, M.“5 Questions About Semantic SEO.”The Moz Blog
(moz.com), June 25, 2013.
Brown, J. S. P. Duguid. The Social Life of Information.
Cambridge, MA: Harvard Business School Press, 2000.
Burke, R.“Hybrid Recommender Systems.” In Brusilovsky, P.,
A. Kobsa, W. Nejdl (eds.), The Adaptive Web, pp. 377–408.
Heidelberg: Springer-Verlag Berlin, 2007
.
Cisco.“Cisco Visual Networking Index: Global Mobile Data
Traffic Forecast Update 2013–2018.” February 5, 2014.
Delgado, J., L. Renaud, V. Krishnamurthy.“The New Face of
Enterprise Search: Bridging Structured and Unstructured In-
formation.” Information Management Journal 39, no. 6, 2005,
40–46. Business Source Premier.Web. February 28, 2014.
DiSilvestro,A.“The Difference Between Semantic Search and
Semantic Web.” Search Engine Journal, July 10, 2013.
dmnews.com.“DMNews Chats with Amy Kennedy,VP of Mar-
keting at Wine.com.” Direct Marketing News, October 26, 2009.
Dover, D. E. Dafforn. Search Engine Optimization (SEO)
Secrets. Indianapolis, IN: John Wiley Sons, 2011.
Downhill, D. J. Peggie.“SEO:The Secret Weapon in the
E-Commerce Wars.” Sempo.org, 2005.
Feldman, S. C. Sherman.“The High Cost of Not Finding
Information.”White paper, IDC, June 2001.
Gaikar,V.“Effective Backlink Strategies for SEO.”
tricksmachine.com, October 20, 2012.
Gallagher, S.“The Great Disk Drive in the Sky: How Web Giants
Store Big—and We Mean Big—Data.” Arstechnica.com,
January 26, 2012.
Glanz, J.“The Cloud Factories: Power, Pollution and the
Internet.” The New York Times, September 22, 2012.
Glanz, J.“Google Details, and Defends, Its Use of Electricity.”
The New York Times, September 8, 2011.
Glaser,W.,T.Westergren, J. Stearns, J. Kraft.“Music Genome
Project US Patent: No. 7
,003,515.” Filed May 16, 2002; issued
February 21, 2006.
Goldman, L.“Nike’s Superstar Endorsers.” Forbes.com, Janu-
ary 24, 2008.
Google.com.“Algorithms.” Google.com, accessed March 24, 2014.
Google.com.“Custom Search: Overview.” September 26, 2013.
Google.com.“Enterprise Findability Without the Complexity.”
2008.
Grehan, M.“How Search Engines Work.” Excerpted from
Search Engine Marketing:The Essential Best Practice Guide,
New York: Incisive Media, 2002.
Grifantini, K.“What It Takes to Power Google.” MIT Technol-
ogy Review, September 9, 2011.
Grimes, S.“Breakthrough Analysis:Two Nine Types of
Semantic Search.” InformationWeek.com, January 1, 2010.
Hatala, J. J. G. Lutta.“Managing Information Sharing Within
an Organizational Setting:A Social Network Perspective.”
Performance Improvement Quarterly 21, no. 4, 2009, 5–33.
ERIC.Web. February 28, 2014.
Hendler, J. T. Berners-Lee.“From the Semantic Web to
Social Machines:A Research Challenge for AI on the World
Wide Web.” Artificial Intelligence 174, 2010.
Jacobson, J.“Google: 129 Million Different Books Have Been
Published.” PCWorld.com, August 6, 2010.
Jansen, B. J. T. Mullen.“Sponsored Search:An Overview of
the Concept, History, and Technology.” International Journal
of Electronic Business 6, no. 2, 2008, 114–131.
Kahn, K.“Structuring the Unstructured:Why Big Data Is
Suddenly Interested in Enterprise Search.” cmswire.com,
December 6, 2012.
Linden, G.“YouTube Uses Amazon’s Recommendation Algo-
rithm.” glinden.blogspot.com, February 1, 2011.
Linden, G., B. Smith, J.York.“Amazon.com Recommenda-
tions: Item-to-Item Collaborative Filtering.” IEEE Internet
Computing, 7
, no. 1, January–February 2003, 76–80.
Madrigal,A.“How Netflix Reverse Engineered Hollywood.”
The Atlantic, January 2, 2014.
marketingsherpa.com.“Revamped Recommendations Lift
Order Value 15%: 5 Steps to More Relevant Suggestions.”
November 18, 2009.
Martin, J.“How to Choose an Enterprise Search Solution.”
computerworkduk.com, February 8, 2012.
Miller, R.“Google Has Spent $21 Billion on Data Centers.”
Datacenterknowledge.com, September 17
, 2013.
Mitra, S.“Web 3.0 (4C P VS).” Sramanamitra.com,
February 14, 2007
.
Newman, J.“6 Things You’d Never Guess About Google’s
Energy Use.” Techland.time.com September 9, 2011.
Nikeinc.com.“History and Heritage.” 2014.
Nikeinc.com.“Nike, Inc. Reports Fiscal 2013 Fourth Quarter
and Full Year Results.” Press release, June 27
, 2013.
Oak, M.“How Does a Search Engine Work?” buzzle.com, June
5, 2008.
oracle.com.“Oracle Secure Enterprise Search 11g R1.” July 2011.
Osher, M.“Finding Copyright Infringements of Your Artwork
on the Internet.” MarianOsher.com, February 9, 2014.
Pick,T.“How Much of Your Traffic ‘Should’ Come from
Search?” SocialMediaToday.com, July 3, 2012.
Prnewswire.com.“Growth of Big Data in Businesses Intensifies
Global Demand for Enterprise Search Solutions, Finds Frost
Sullivan.” January 24, 2013.
Reinhardt,A.“Steve Jobs on Apple’s Resurgence: Not a One
Man Show”, Business Week, May 12, 1998.
Safran, N.“310 Million Visits: Nearly Half of All Web Site
Traffic Comes From Natural Search [Data].” Conductor.com,
June 25, 2013.
Schachinger, K.“10 Website Quality Indicators That Can Sink
Your SEO Battleship.” SearchEngineWatch.com, November
29, 2012.
Schneider, D.“Under the Hood at Google and Facebook.”
spectrum.ieee.org, May 31, 2011.
Simon, N.“Barriers to an Information Sharing Culture.” Com-
petitive Intelligence Magazine 1, no. 3, October–December
1998.
Small, C.T. A. P. Sage.“Knowledge Management and
Knowledge Sharing:A Review.” Information Knowledge
Systems Management 5, no. 3, 2006, 153–169.](https://image.slidesharecdn.com/informationtechnologyformanagement-240705093952-20562a4a/75/Information-technology-for-management-pdf-235-2048.jpg)