Downloaded 11 times


![8Economic Growth Driving Force and International Expansion of ICT Industries (1)
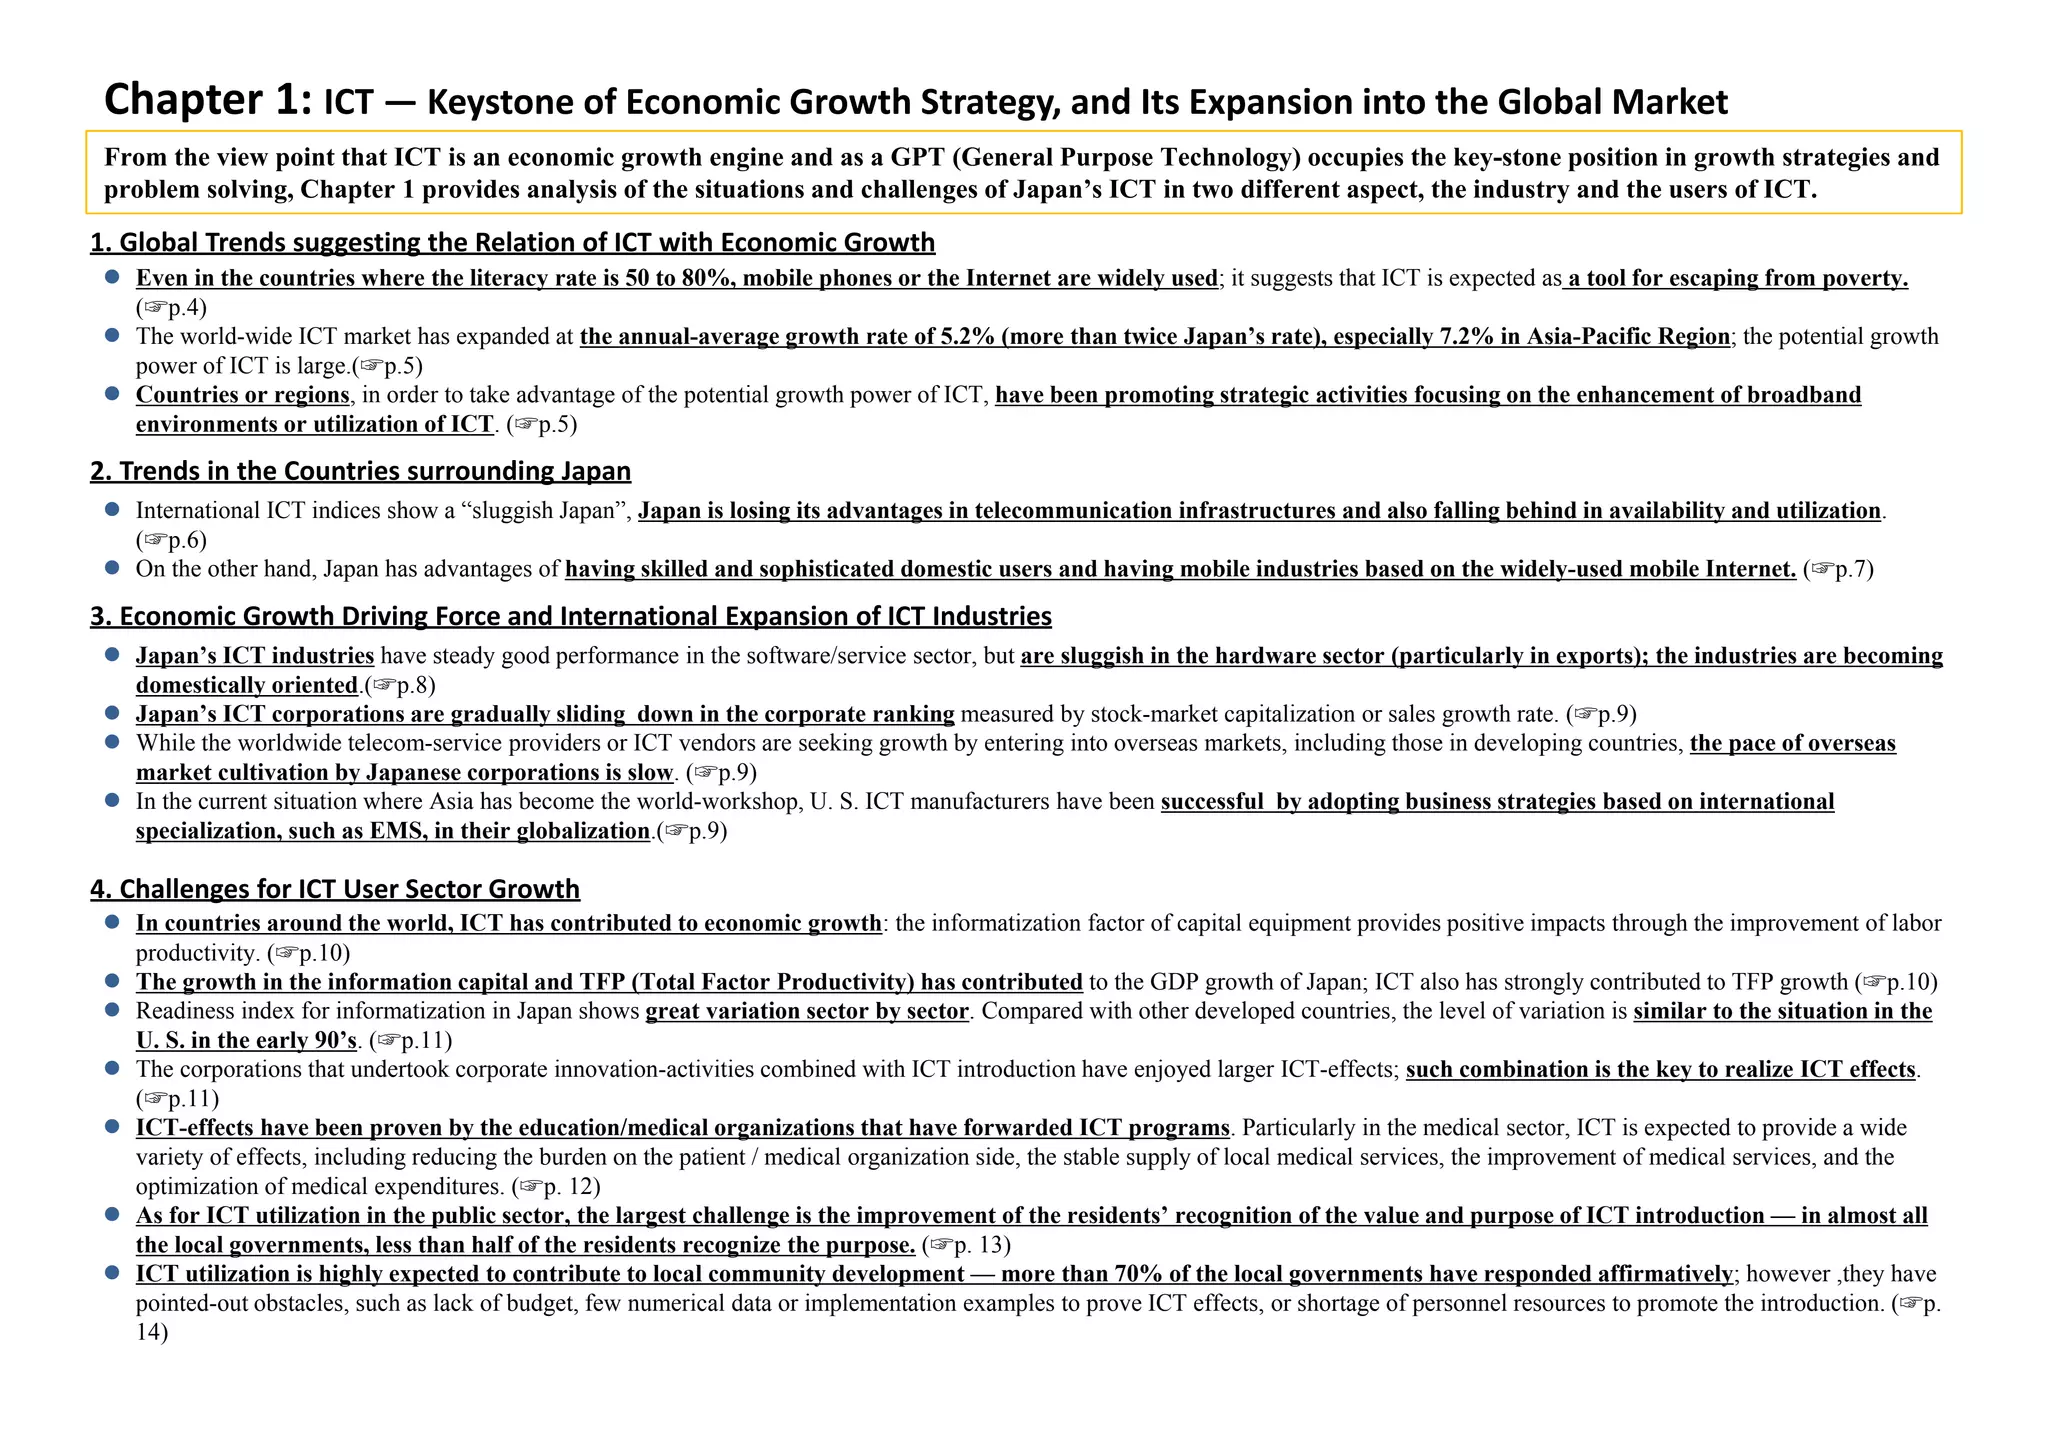
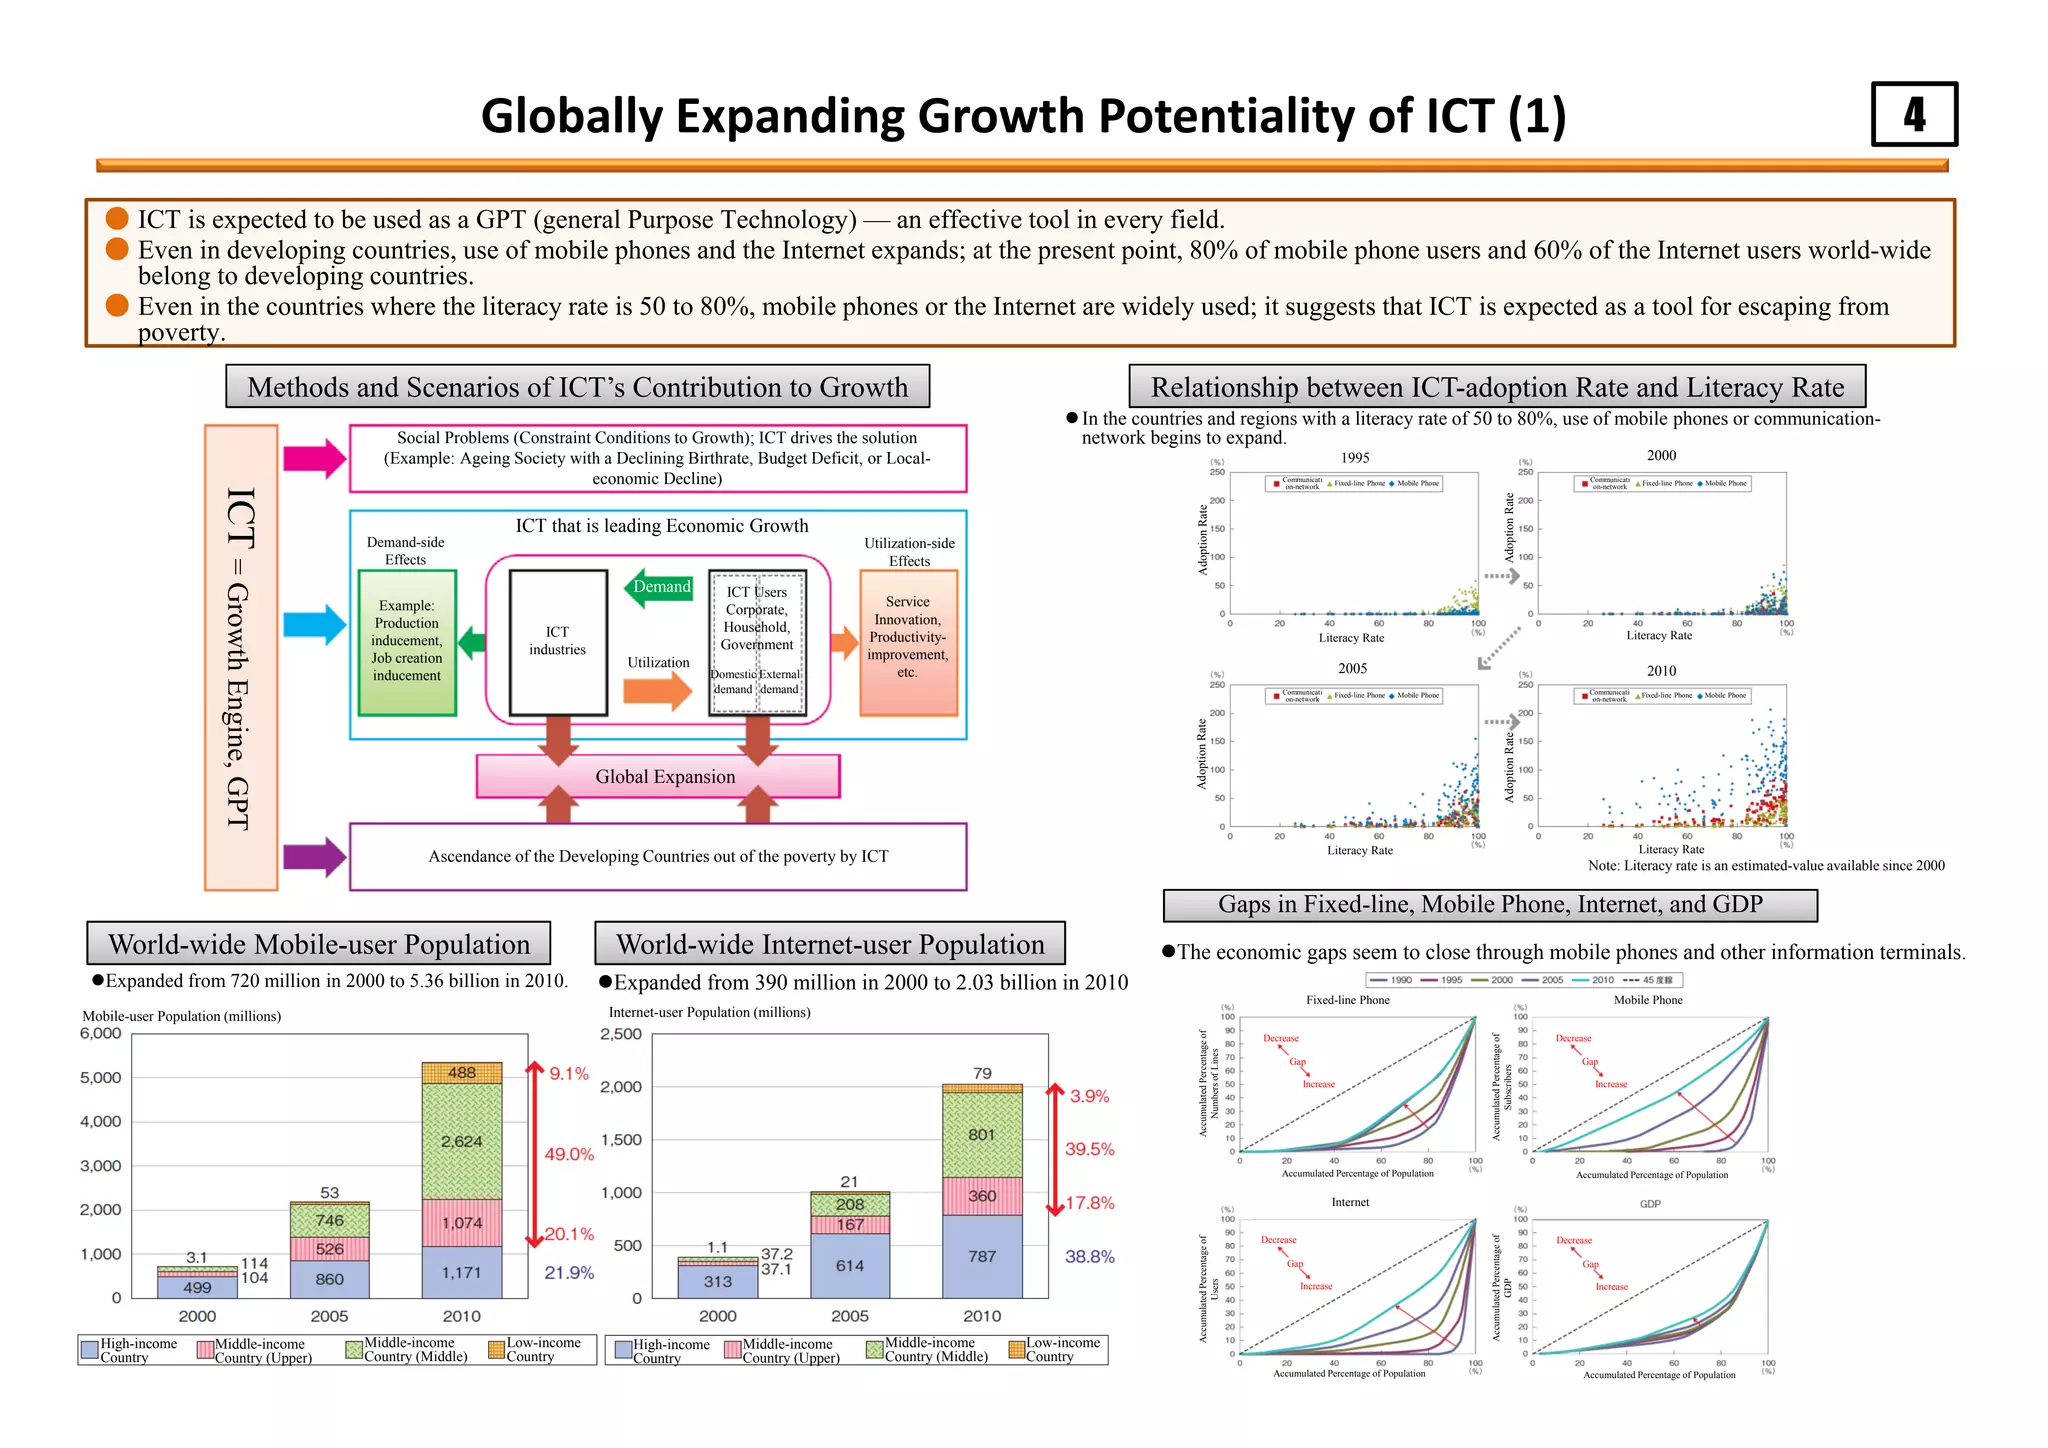
● Japan’s ICT industries have steady good performance in the software/service sector, but are sluggish in the hardware sector (particularly in exports); the
industries are becoming domestically oriented.
● Japan’s ICT-export-coefficient, having remained positive for many years, was negative in 2011, especially in video equipment (TVs, etc.) and
communication equipment (mobile phones, etc.)
The ripple effects by the service sectors, such as information-services or telecommunication-
services, are growing steadily, but those of the hardware sector are declining.
ICT Industries’ Economic Ripple Effects
The domestic demand for information services or telecommunication services show steady
growth; on the other hand, the foreign demand, especially for hardware, is declining.
ICT Industries’ Domestic/External Demand
Trade Specialization Index
Export / Import Trends in TVs, Mobile Phones, and PCs
Recent imports of TVs and mobile phones have become a surplus, following the trend of PCs
which has long been on a surplus trend.
ICT industries’ trade specialization index is below zero in 2011, particularly in video and
telecommunication equipment.
[Trends in the amount of production induced]
(trillion
yen)
(trillion
yen)
(trillion
yen)
(year) (year)
(year)(year)
Video/text information production
Internet-related services
Telecommunications (excluding
postal services)
Telecommunication equipment
and related devices
Advertising
Information services
Broadcasting
Computer and peripheral
devices
Video/text information production
Internet-related services
Telecommunications (excluding
postal services)
Telecommunication equipment
and related devices
Advertising
Information services
Broadcasting
Computer and peripheral
devices
Video/text information production
Internet-related services
Telecommunications (excluding
postal services)
Telecommunication equipment
and related devices
Advertising
Information services
Broadcasting
Computer and peripheral
devices
Video/text information production
Internet-related services
Telecommunications (excluding
postal services)
Telecommunication equipment
and related devices
Advertising
Information services
Broadcasting
Computer and peripheral
devices
[Trends in the number of jobs created] Export coefficient (total and ICT-related industries)
Export-oriented
Import-oriented
Export coefficient (ICT-related products)
Computers (including
components)
Semiconductors and other
electronic components
Video equipment
Communication devices
Total
ICT-related
industries
TV sets Mobile Phones
PCs
(10 billion yen)
(10 billion yen)
(10 billion yen)Balance Export Import Balance Export Import
Balance Export Import
(10 thousand)](https://image.slidesharecdn.com/informationandcommunicationinjapan-151012153530-lva1-app6892/75/Information-and-communication-in-japan-14-2048.jpg)


![12Challenges for ICT User Sector Growth (3)
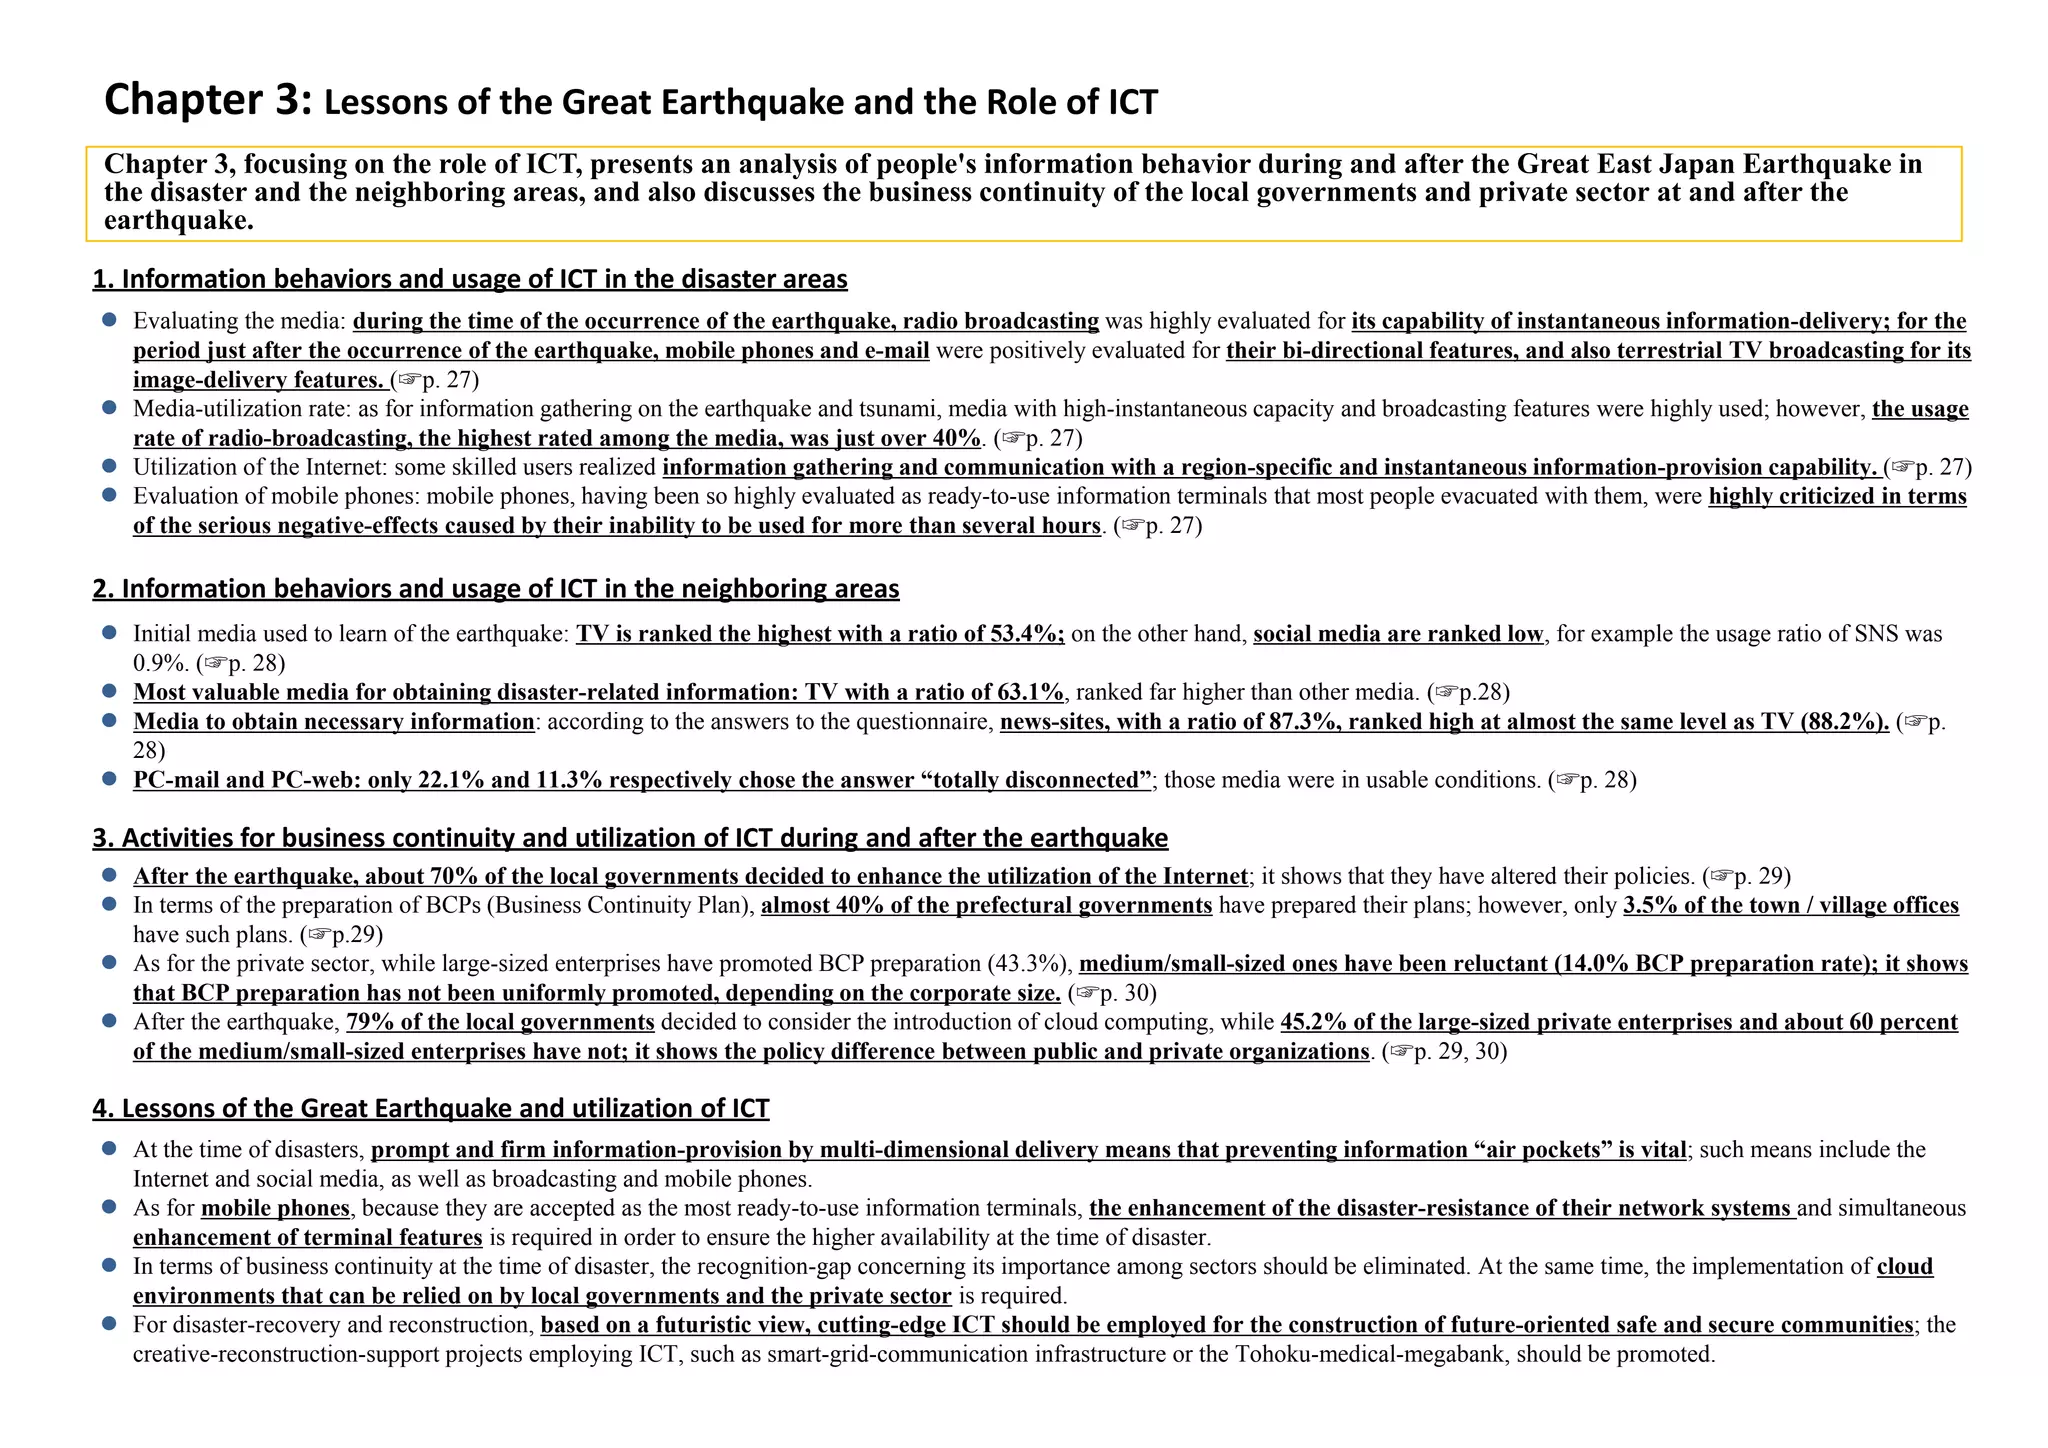
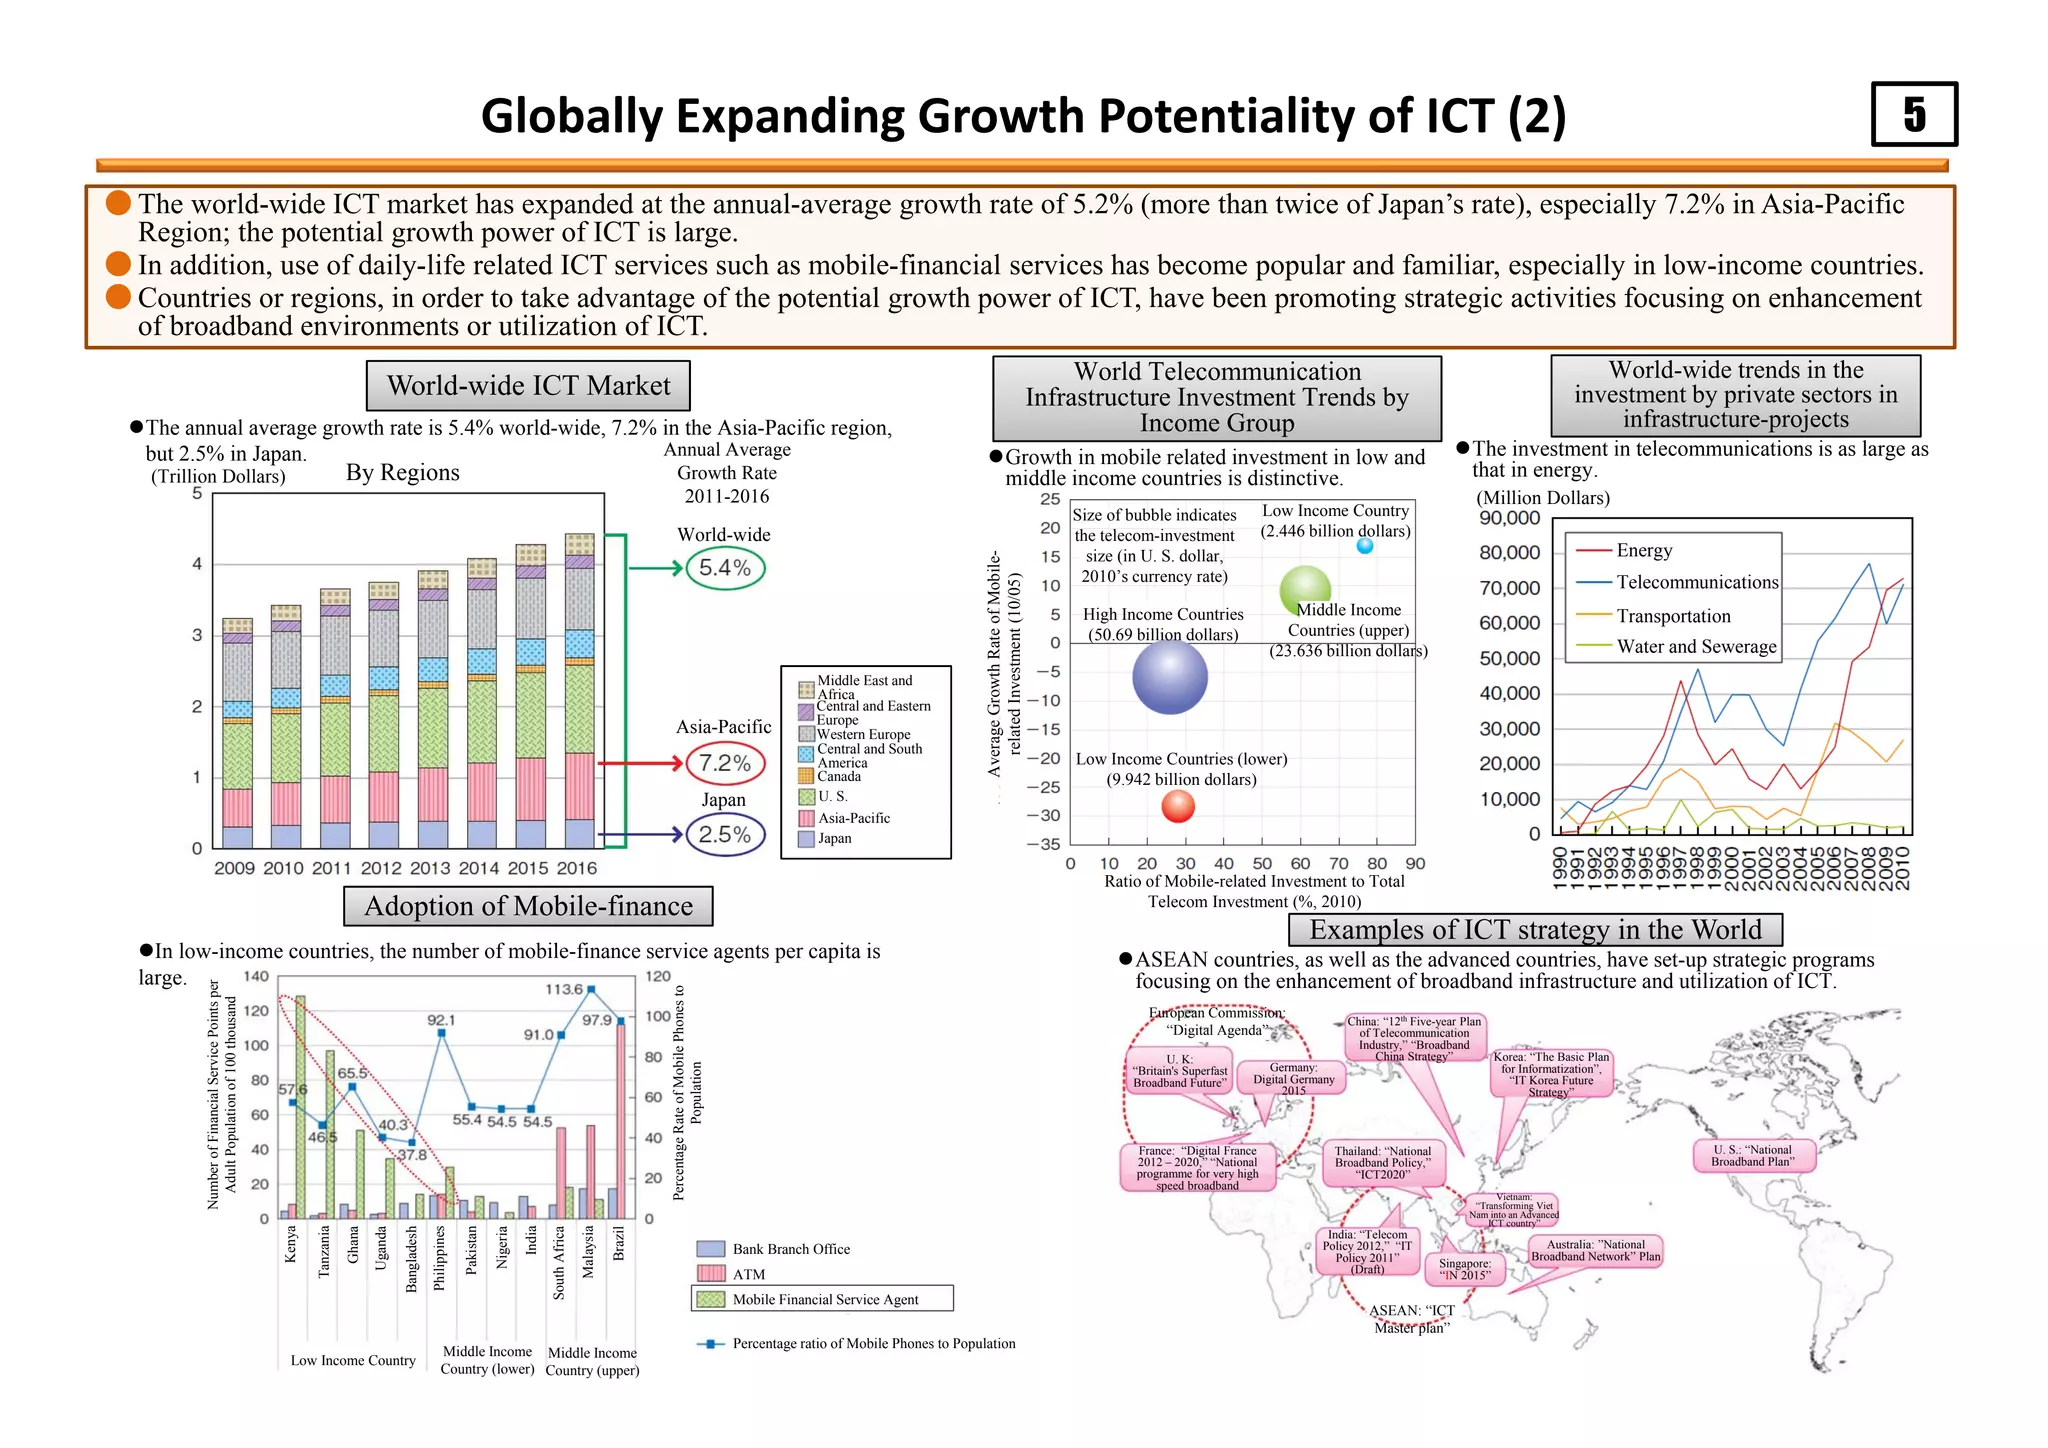
●ICT-effects have been proven by the education/medical organizations that have forwarded ICT programs.
●Particularly in the medical sector, ICT is expected to provide a wide variety of effects, including the reducing the burden on the patient /
medical organization side, the stable supply of local medical services, the improvement of medical services, and the optimization of medical
expenditures.
ICT effects in medical sector
ICT-introduction effects in medical sector are evaluated in terms of 25 items; out of them, 16 items are quantitatively
evaluated, for example at present 104.31 billion yen for medical expenses, and 331.71 billion yen for social benefit.
ICT-introduction effects are expected to grow along with the improvement of the adoption rate.
Front-running organizations reply “We take the advantage of ICT.”
ICT-introduction and its Effects: Educational Organizations
ICT-introduction and its effects: Medical organizations
Most significant replies on the effects of electronic health records (HER) are the quality-improvement of medical service or
medication teaching, and the efficiency improvement of transaction-processing.
Effects of EHR Utilization
Systems Expected effects and benefits
EMC, EHR
• Proper charging of medical expenses
• Avoiding physical load
• Increasing safety and quality of emergency care
Receipt computer, EHR • Receiving high-quality medical services
In-house information system • Reducing time for waiting
Telemedicine system
• Proper charging of medical expenses
• Proper charging of medical expenses
• Reducing expenses for outpatient treatment
Health management services • Proper charging of medical expenses
Medical-related web services
• Receiving high-quality (or suitable) medical
services
Systems Expected effects and benefits
EMC (including the cloud
services)
Receipt computer
• Standardizing and increasing the efficiency of
medical practice
• sophisticating BCP
Telemedicine system • Increasing revenues
SPD (supply, processing, and
distribution) system
• Reducing material costs
In-house information system
• Reducing film costs
• Reducing general costs
• Reducing personnel costs
• Improving the working environment
EMC • Increasing safety
Operation support system • Improving the working environment
Systems Expected effects and benefits
EMC, EHR
• Proper charging of medical expenses (insurance
benefits)
On-line billing system • Reducing operating costs
Telemedicine system
Health guidance support
system
• Proper charging of medical expenses (insurance
benefits)
Health guidance support
system
• Reducing costs for health guidance (including
outsourcing costs)
Systems Expected effects and benefits
On-line billing system • Reducing operating costs
EMC/receipt computers
• Increasing development efficiency, developing
innovative equipment
Beneficiary: Patients Beneficiary: Medical organizations/care service providers
Beneficiary: Insurers
Beneficiary: Others
* Items within yellow frames are items subject to quantitative evaluation and others are items subject to qualitative evaluation. Estimate values of the effects are calculated on the basis of
the current diffusion rate.
Front-running organizations reply “We take advantage of ICT.”
ICT-introductioneffects
(Rateof"veryeffective"and"effective")
Effect in information sharing and medical collaboration
ICT introduction (low)
(n=123)
ICT introduction (high)
(n=144)
Effect in improving clerical work processing Effect in reducing working hours
Effect on teachers Effect on students Effect outside the school
Activatingcommunications
amongteachers
Improvingtraining
programsforteachers
Improvingteaching
methodsandclasses
Reducingteachers'
workloadotherthanclasses
Reducingworkinghoursof
teachers
Activatingcommunications
betweenteachersand
students
Improvingstudents'
academicabilitiesinbasic
subjects
Improvingstudents'
attitudeinstudying
Increasingtheattendance
rateofstudents
Improvingstudents'ability
touseICTequipment
Activatingcommunications
withstudents'parents
Improvingmethodsfor
sharinginformationand
communicatingwith
students'parents
Activatinginteractionswith
otherschools
Activatinginformation
dissemination
ICT introduction (low)
(n=151)
ICT introduction (high)
(n=165)
ICT-introductioneffects
(Rateof"veryeffective"and"effective")
Within the hospital Outside the hospital
Activating
informationsharing
amongmedicalcare
staff
Activating
informationsharing
betweenmedicalcare
staffandmedical
clerks
Advancing
collaborationin
medicalserviceswith
otherhospitalsand
clinics
Advancing
collaborationin
medicalserviceswith
nursingcarefacilities
Advancing
collaborationin
medicalserviceswith
testinginstitutions
andpharmacies
Facilitating
preparationof
medicalfeereceipts
Increasingefficiency
inpreparingmedical
feebills
Reducingworking
hoursandimproving
workingconditions
formedicalcarestaff
Reducingworking
hoursandimproving
workingconditions
formedicalclerks
[Medical organizations]
Improving quality of medical services
Increasing the number of patients per day resulting from the
reduced time for seeing each patient
Strengthening collaboration
among medical organizations
Increasing efficiency in
clerical work processing
Others
[Pharmacies]
Improving the quality of medication teaching
Reducing the time for inputting prescription data
and reducing input errors
Strengthening collaboration
among medical organizations
Increasing efficiency in
clerical work processing](https://image.slidesharecdn.com/informationandcommunicationinjapan-151012153530-lva1-app6892/75/Information-and-communication-in-japan-18-2048.jpg)


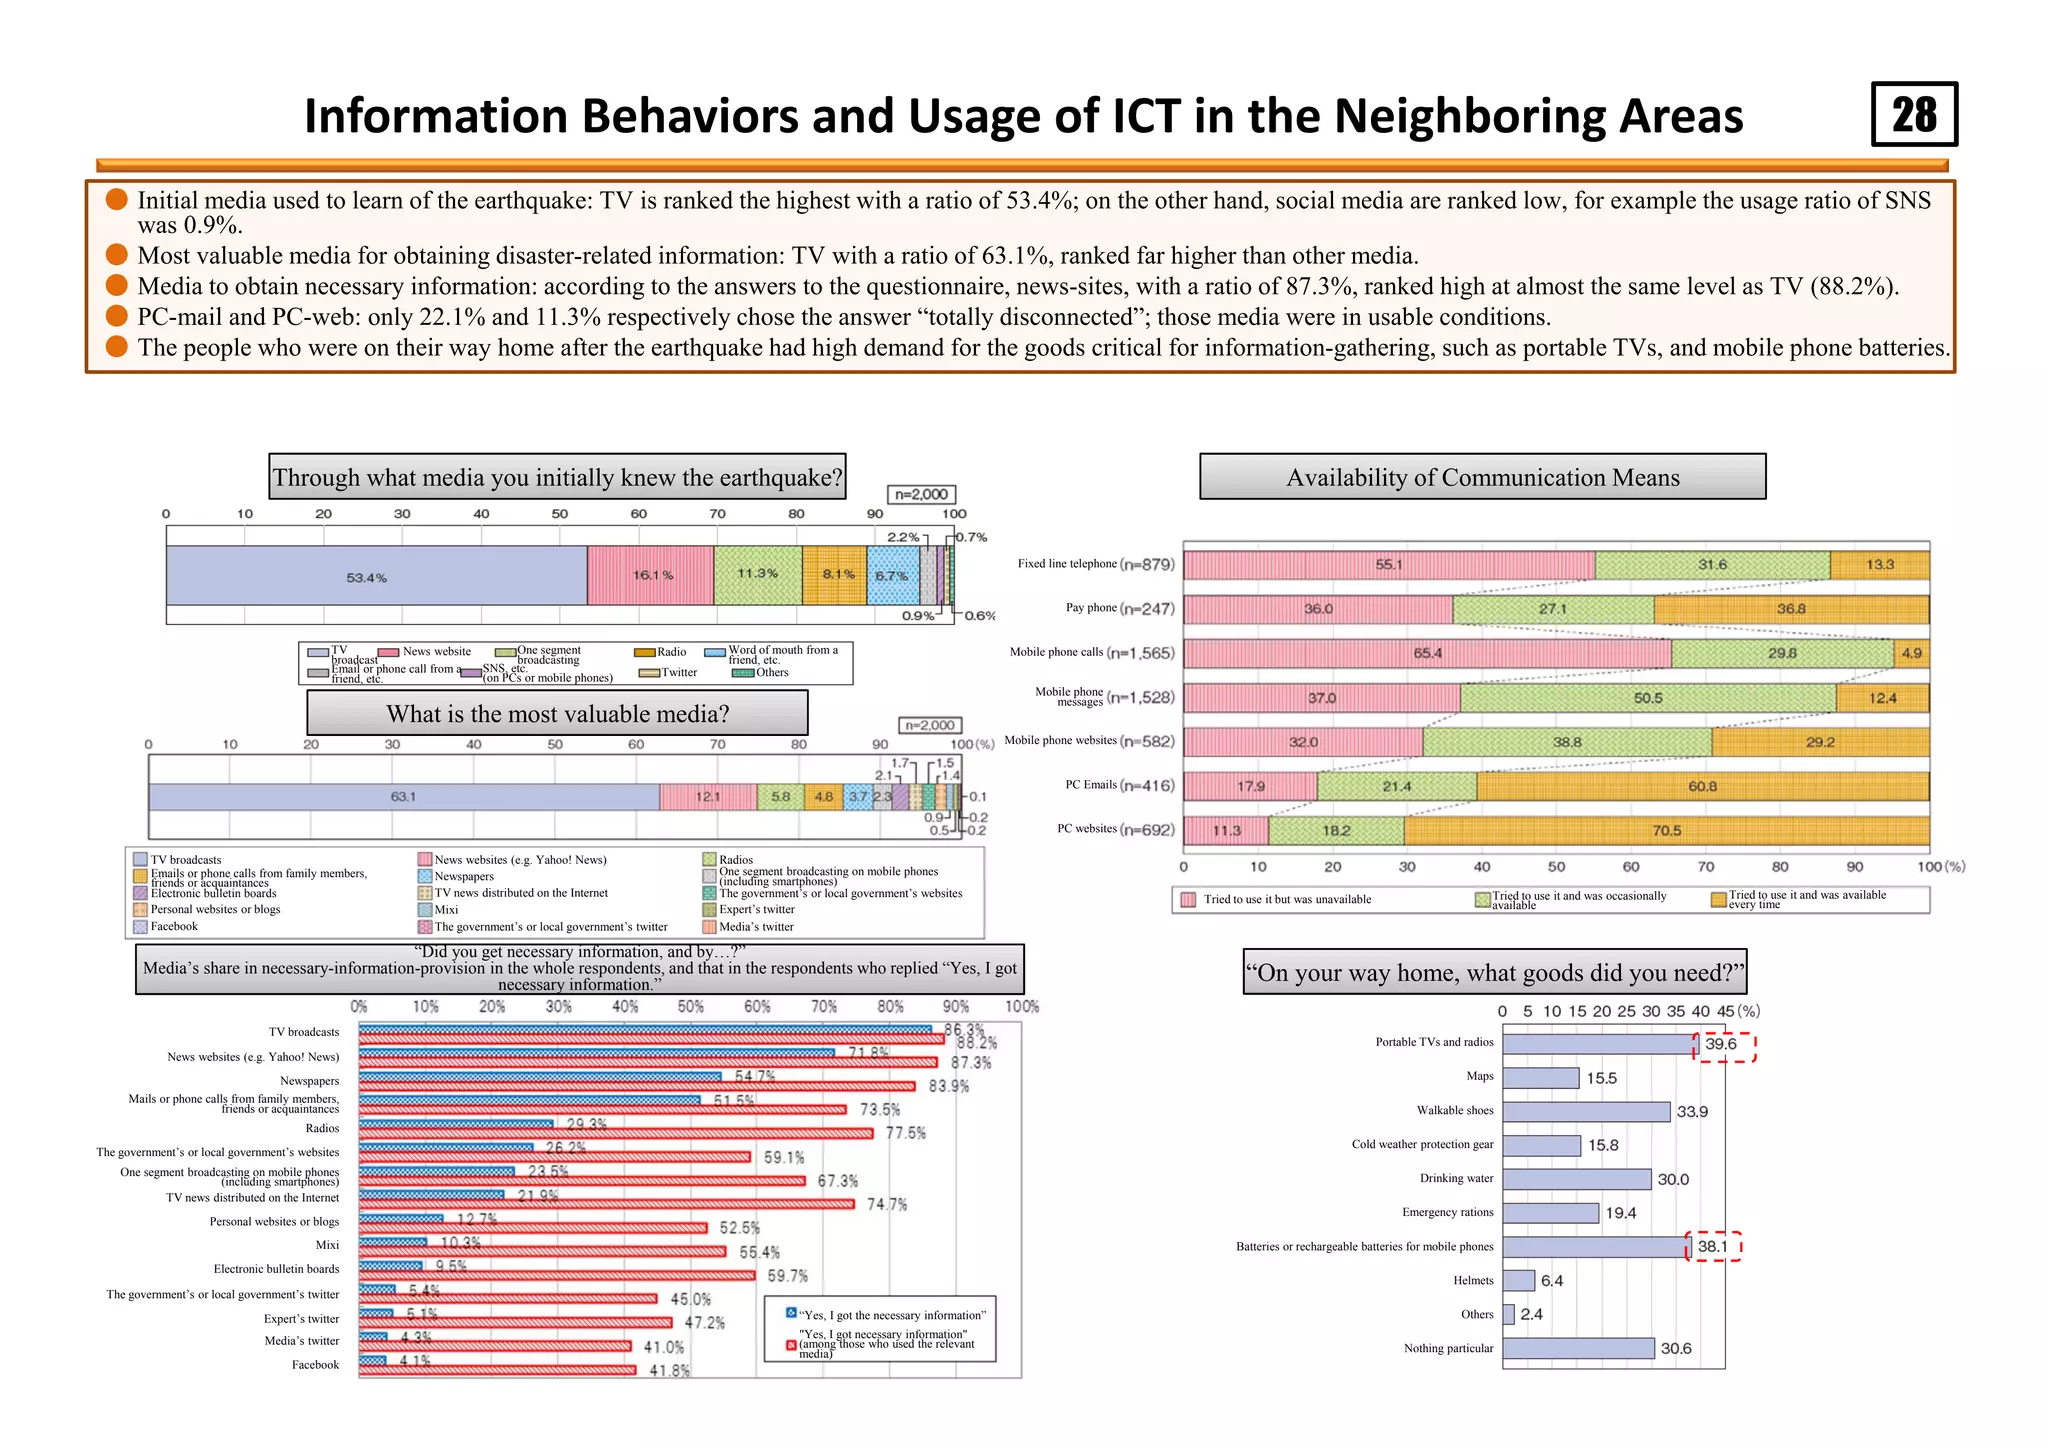
![27
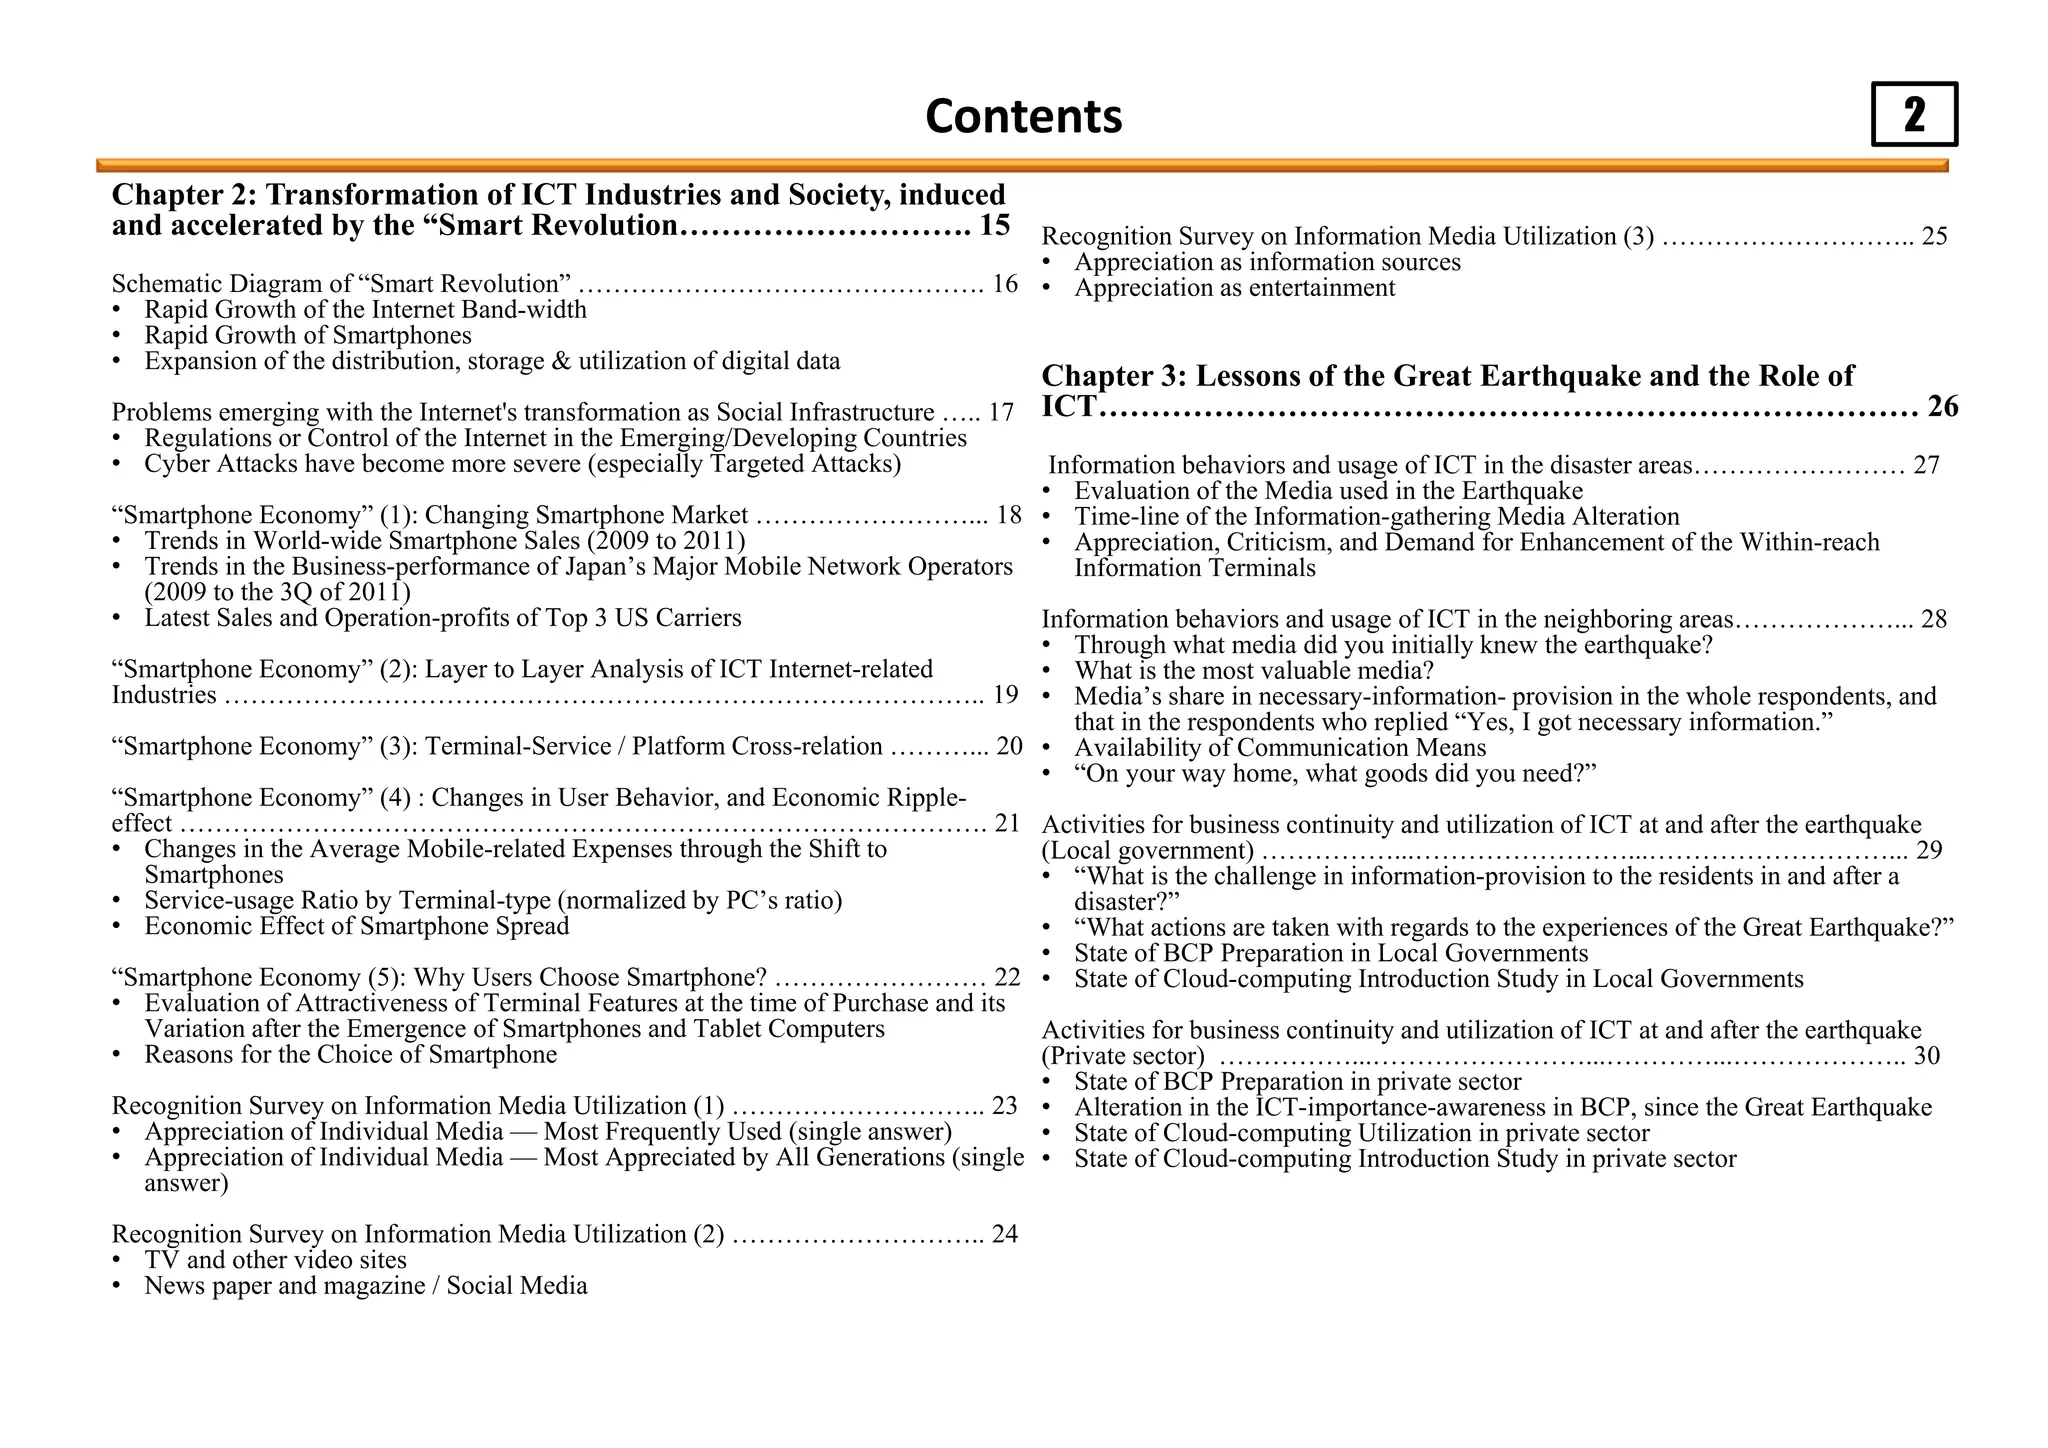
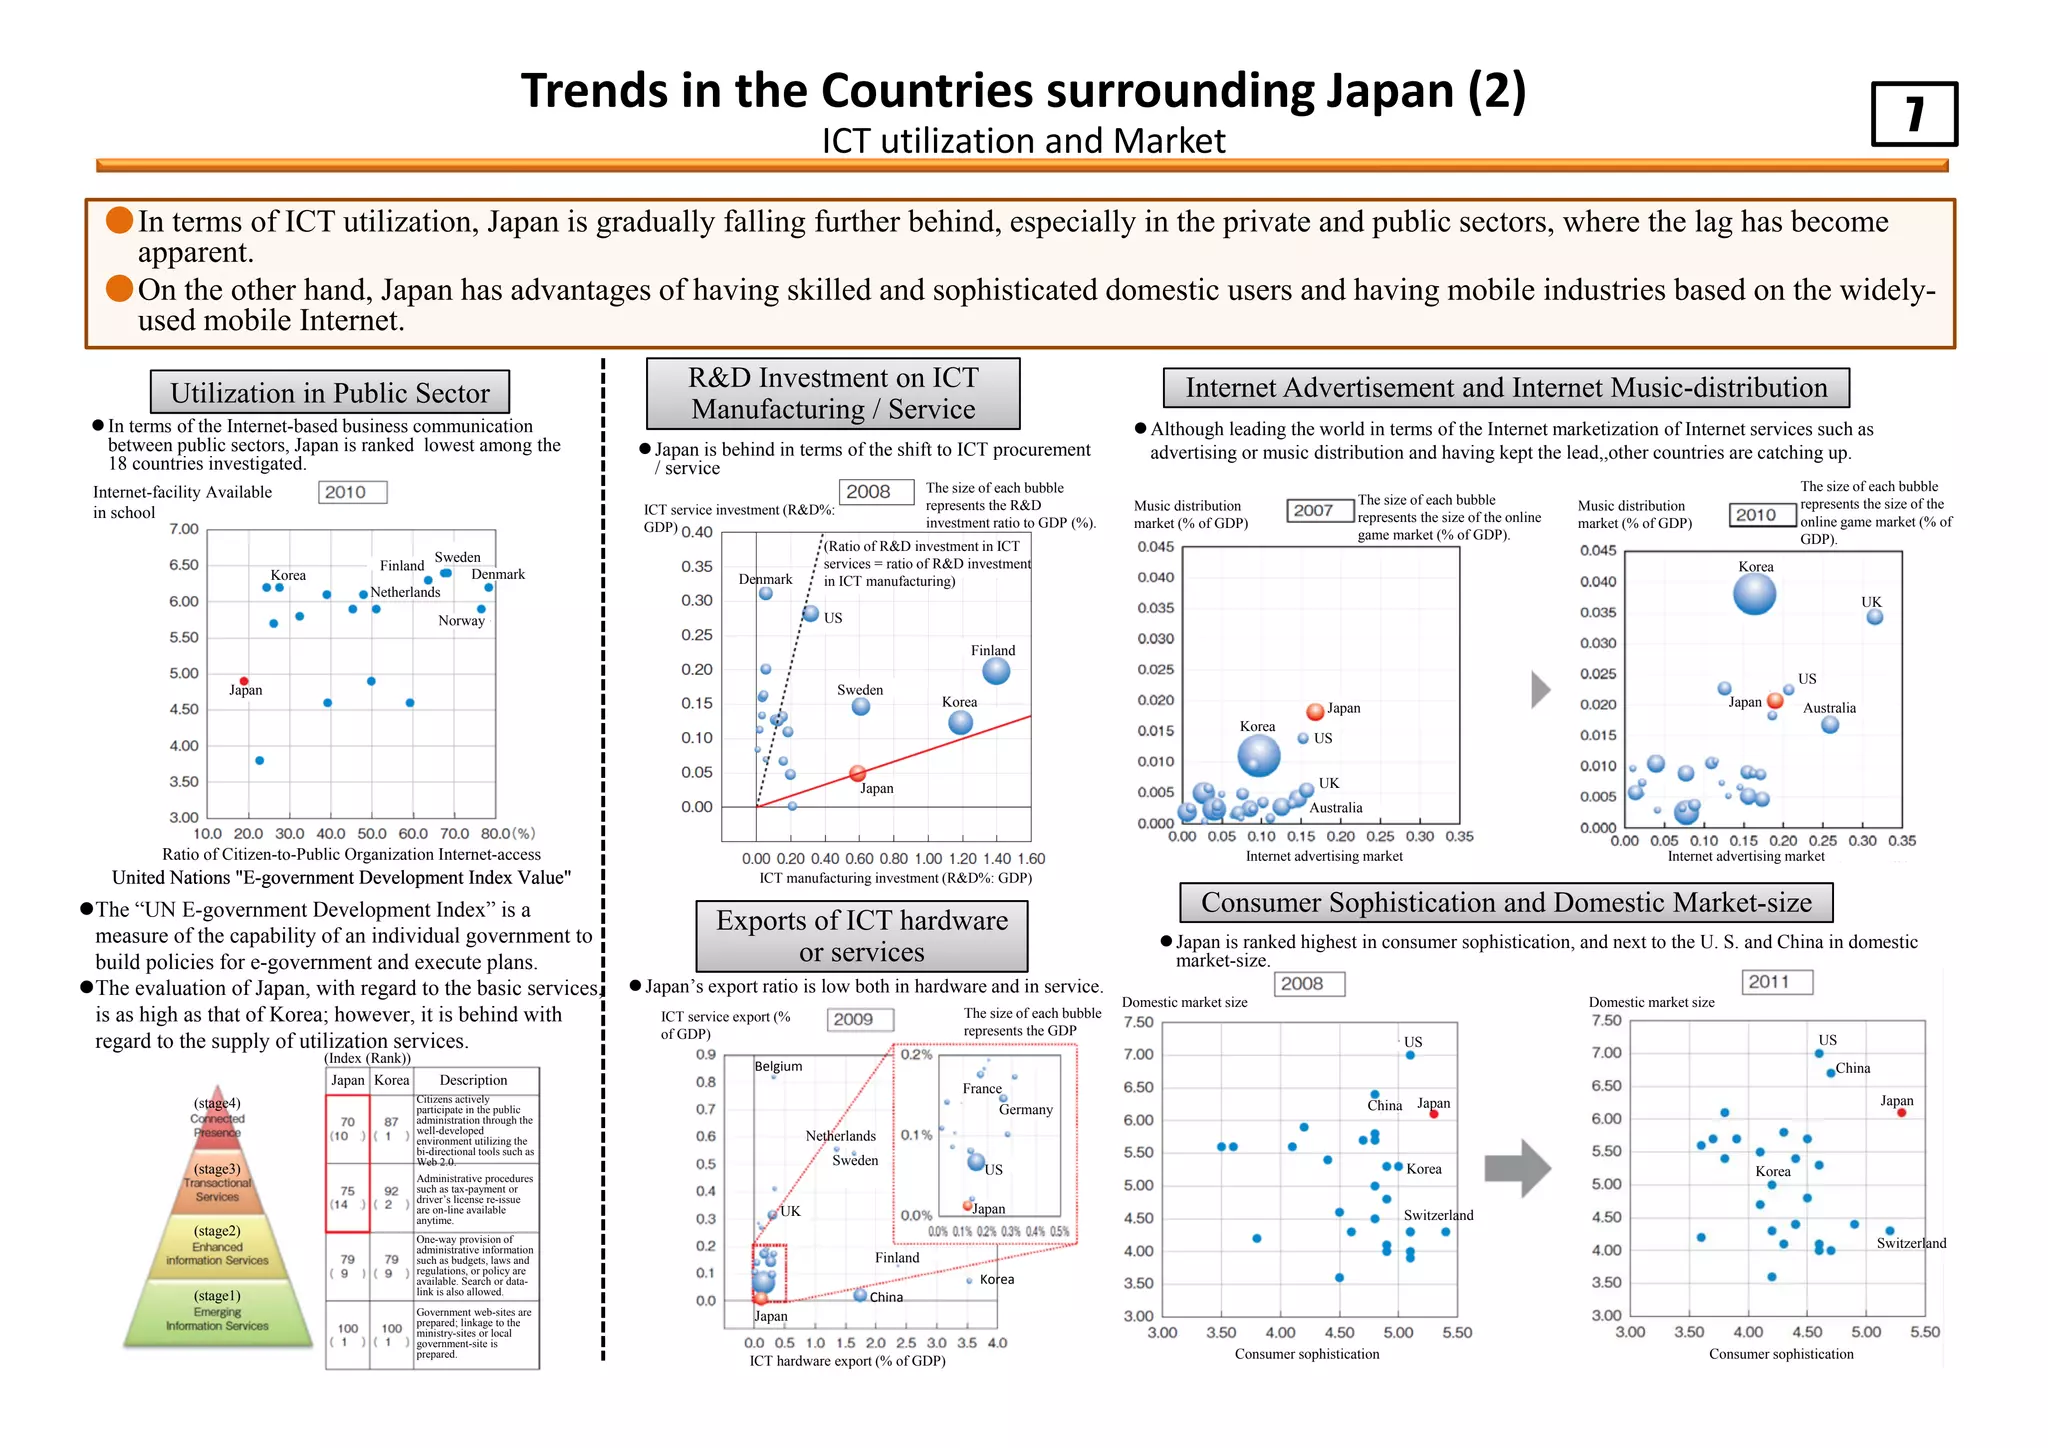
● Evaluating the media: during the time of the occurrence of the earthquake, the radio broadcasting was highly evaluated for its capability of instantaneous information-delivery;
for the period just after the occurrence of the earthquake, the mobile phone and the e-mail were positively evaluated for their bi-directional features, and also the terrestrial TV
broadcasting for its image-delivery features.
● Media-utilization rate: as for the information gathering on the earthquake and tsunami, media with high-instantaneous capacity and broadcasting feature were highly used;
however, the usage rate of radio-broadcasting, the highest rated among the media, was just over 40%.
● Utilization of the Internet: some skilled users realized information gathering and communication with region-specific and instantaneous information-provision capability.
● Evaluation of mobile phones: mobile phones, having been so highly evaluated as ready-to-use information terminals that most people evacuated with them, were highly criticized
in terms of the serious negative-effects caused by their inability of use lasting for many hours.
Information Behaviors and Usage of ICT in the Disaster Areas
Evaluation of the Media used in the Earthquake
Appreciation, Criticism, and Demand for Enhancement of
the Within-the-reach Information Terminals
The interview survey on information behavior in disaster areas and ICT
has been published in the press release, "Results of the survey on
information and communications technology at the time of disaster,"
announced on March 7, 2012, and this part only shows part of the results.
Time-line of the Information-gathering Media Alteration
Immediately after the earthquake, the usefulness of mobile phones, mobile
phone messages and terrestrial broadcasts received higher evaluation and
at the end of April, the evaluation of the usefulness of mobile phones,
mobile phone messages and terrestrial broadcasts exceeded that of radios.
During the period from the occurrence of the
earthquake until the end of April, the websites and
search sites of administrative agencies and news
media received higher evaluation
At the time of occurrence of the quake,
AM radios received the highest evaluation
(60.1%) followed by FM radios.
At the time of
occurrence of the
earthquake
Immediately after
the quake
Until the end of
April
Immediately after the earthquake, radios
were the only means to obtain
information. However, radios were
insufficient to grasp the actual state of
damage in the area and it took a long time
to know of the enormous damage caused
by tsunami. We were unable to know who
was doing what and felt highly
anxiousness.
Phone calls and Emails Broadcasting Internet Others
Time-line of the
Information-gathering
Media Alteration
Fixedlinetelephones
FAX
Mobilephonecalls
Mobilephonemessages
MobilephoneInternet
Onesegmentbroadcasting
onmobilephones
Radios
Carradios
DatabroadcastontheL-
shapedareaofthescreen
Disasterradio
Wordofmouthfrom
neighborhoods
DisasterpreventionEmail
Visualinspection
Publicinformationcar
Others
Internetradios
TVs
CarTVs
Internet
Disasteremergencymessage
board
Immediately after the
earthquake (n=223)
Tsunami information (n=174)
Information for everyday life
after evacuation (n=277)
Information-gathering
media immediately after
the earthquake and the
evaluation thereof
“I was shocked that mobile phones turned out to be completely useless
at the time of the disaster as I had an idea that wireless mobile phones
would be useful at such a time”
“Radio was useful to obtain information but
insufficient to obtain detailed information”
The media actually used (n=223)
The most useful media (n=129)
Changes in the Information-
gathering media by Internet
Active Users*
* “Internet Active Users” means the
following users: (i) users who
answered on Facebook that they were
“heavy users” of Twitter or SNS; and
(ii) users who answered in the
interview that they used Twitter or
SNS immediately after the quake to
collect information for daily life after
the evacuation
Immediately after the
earthquake (n=28)
Tsunami information (n=18)
Information for everyday life
after evacuation (n=32)
Advantage:
Although there were cases where shops were
closed when we visited them according to the
information from TV broadcasts, we could obtain
timely information by using Twitter
Disadvantage:
There were few people who were using Twitter
and thus the information was scarce and Twitter
could not be effectively used.
[Importance of mobile phones as one of the lifelines]
Nowadays, it has become very common to make contact by mobile
phones and we would suffer terribly without them.
I wish mobile phones were available anyhow (at the time of the
disaster). Portable tools were almost limited to mobile phones and if
they were available somehow, we could send mails or use SNS even
if we couldn’t make phone calls.
I was shocked that mobile phone turned out to be completely
useless at the time of disaster as I had an idea that wireless mobile
phones would be useful at such a time.
[Importance of power supply to secure the use of information and
communication tools (especially mobile phones)]
I faced difficulty in obtaining power supply for mobile phones. As I
had installed a solar electric generation in my house, I used them or
cars to charge batteries.
I didn’t use the 1seg function of the mobile phone so as to save
batteries. The repair of electric system is vital for tools to access
information. Smart phones were unavailable for a long time as their
batteries needed charging as well. Power supply is the most
significant thing.
Fixedlinetelephones
FAX
Mobilephonecalls
Mobilephonemessages
MobilephoneInternet
Onesegmentbroadcasting
onmobilephones
Radios
Carradios
DatabroadcastontheL-
shapedareaofthescreen
Disasterradio
Wordofmouthfrom
neighborhoods
DisasterpreventionEmail
Visualinspection
Publicinformationcar
Others
Internetradios
TVs
CarTVs
Internet
Disasteremergencymessage
board
Fixedlinetelephones
FAX
Mobilephonecalls
Mobilephonemessages
MobilephoneInternet
Onesegmentbroadcasting
onmobilephones
Radios
Carradios
DatabroadcastontheL-
shapedareaofthescreen
Disasterradio
Wordofmouthfrom
neighborhoods
DisasterpreventionEmail
Visualinspection
Public
informationcar
Others
Internetradios
TVs
CarTVs
Internet
Disasteremergencymessage
board](https://image.slidesharecdn.com/informationandcommunicationinjapan-151012153530-lva1-app6892/75/Information-and-communication-in-japan-33-2048.jpg)


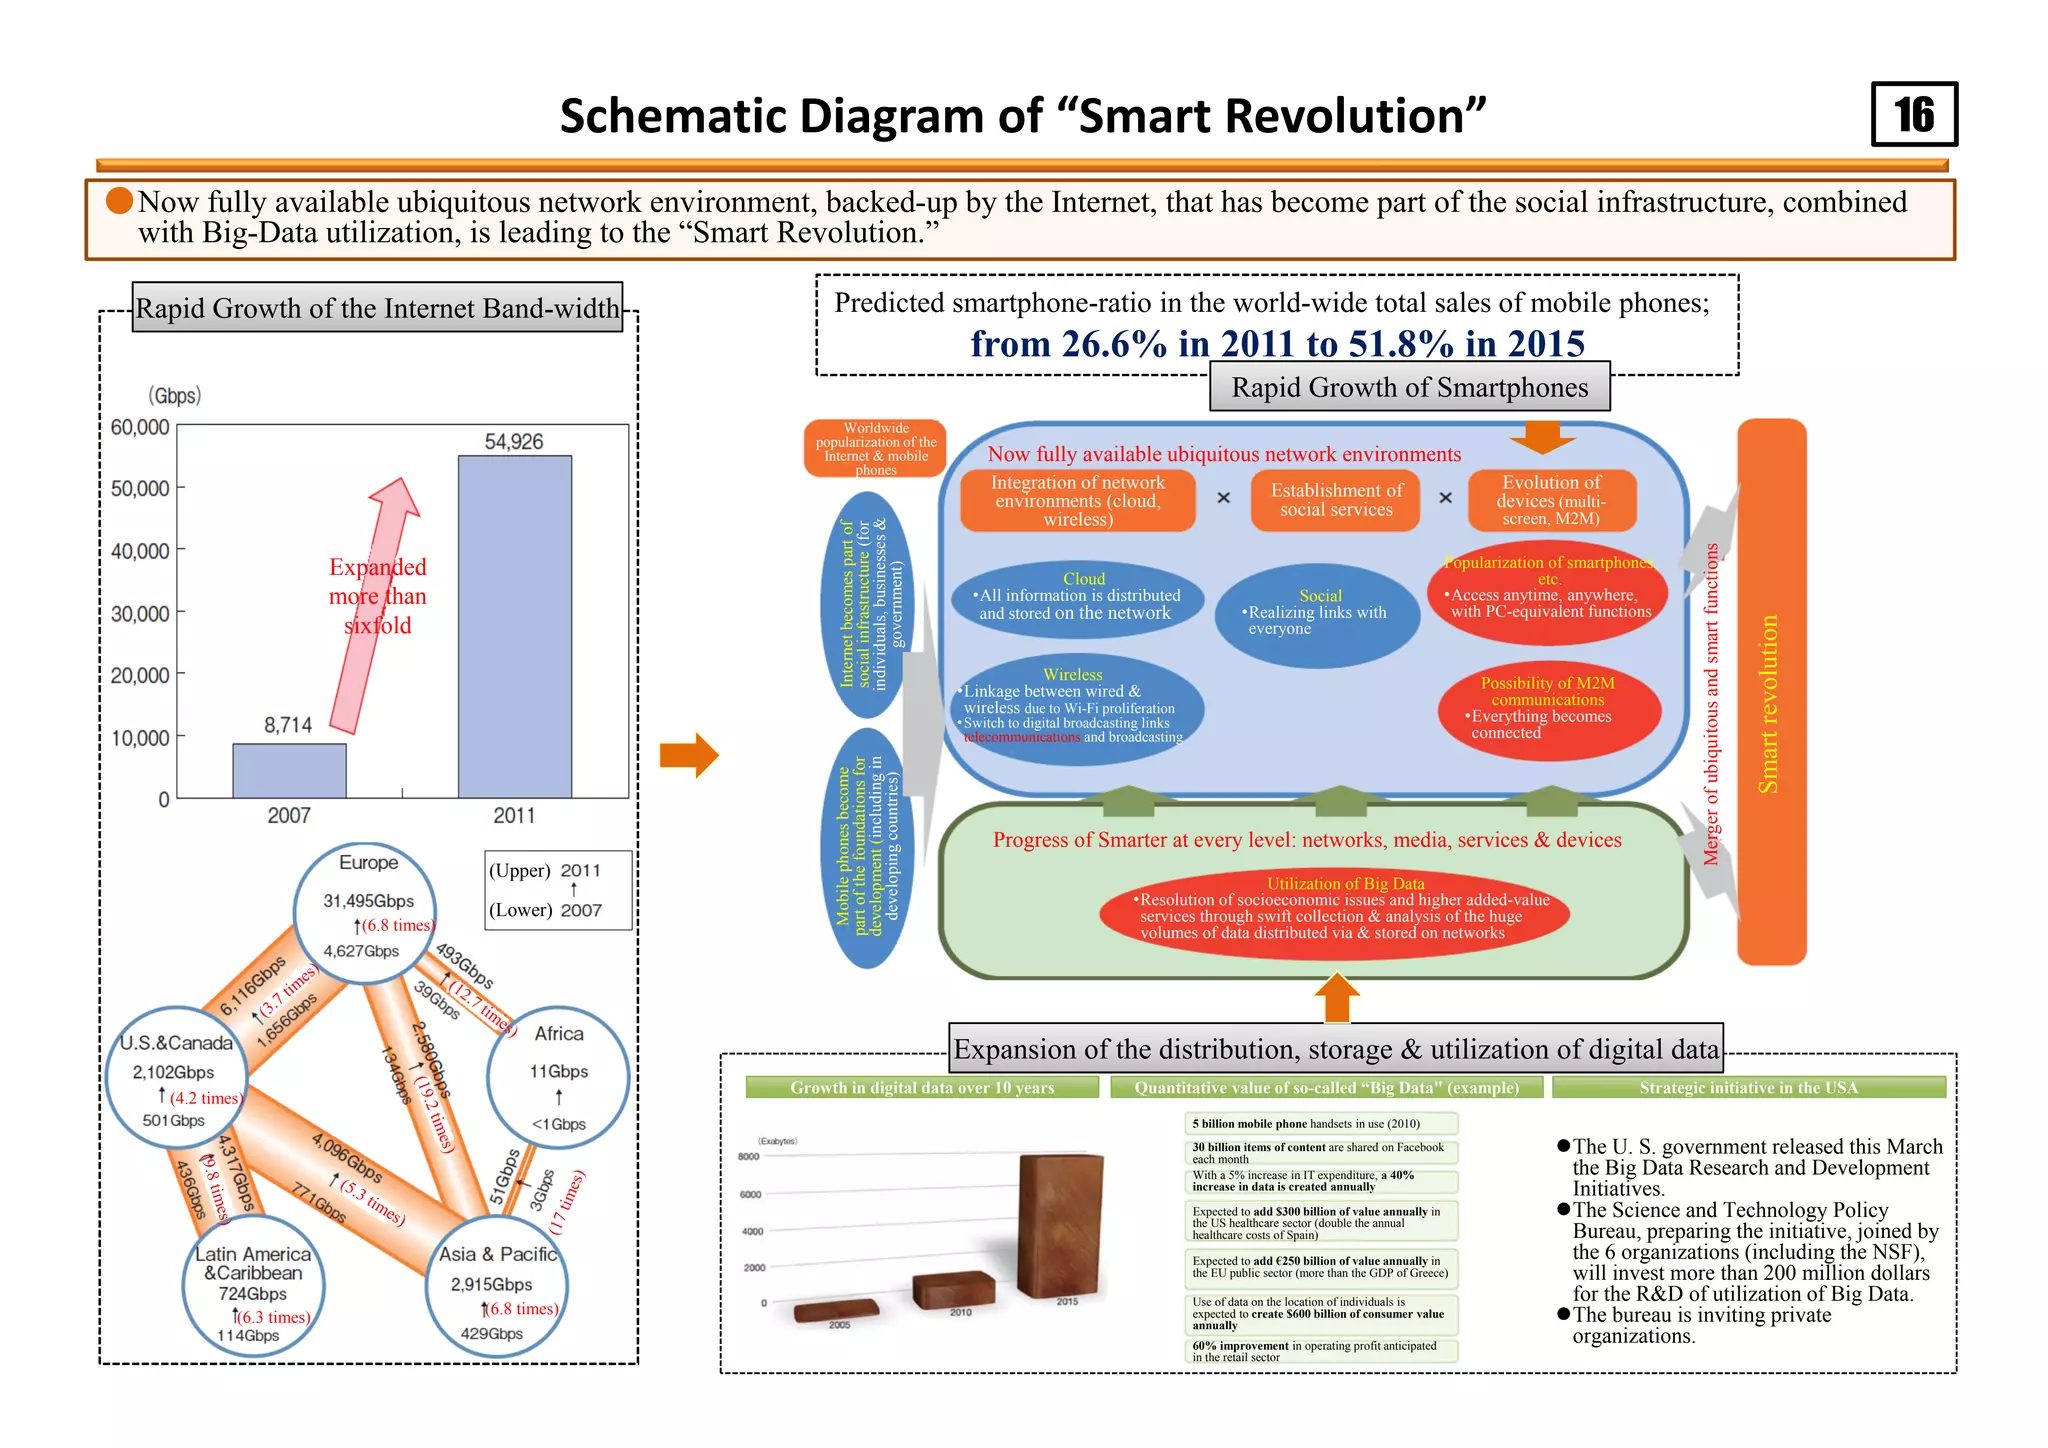
The document is a 2012 white paper from the Japanese Ministry of Internal Affairs and Communications that discusses information and communications trends in Japan. It finds that: 1) While ICT has contributed significantly to economic growth globally and in Japan, Japan's ICT industries and user adoption is lagging compared to other developed countries. 2) The proliferation of smartphones and ubiquitous networks is driving a "Smart Revolution" that is transforming ICT industries and society. However, Japan has been slow to capitalize on these trends globally. 3) Lessons from the 2011 earthquake showed the important role ICT can play in disaster response, but more remains to be done to promote ICT adoption in Japan, especially in the public sector