Download to read offline


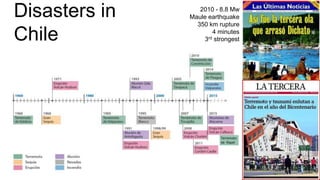

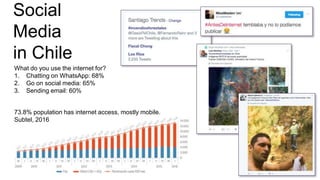


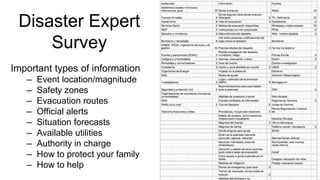
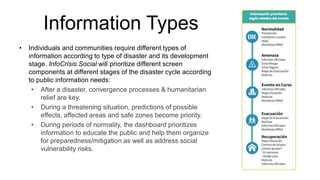
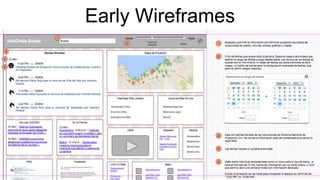


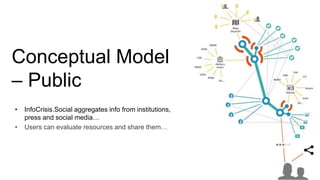
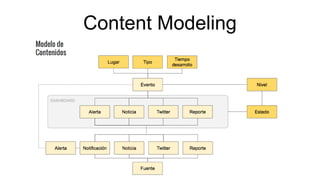

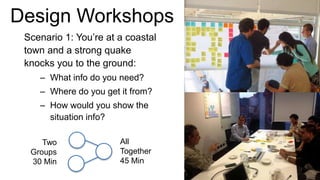

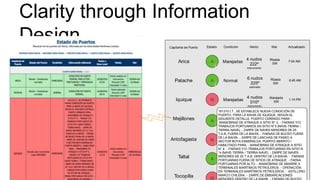

InfoCrisis.Social is a project led by Gonzalo Bacigalupe and Javier Velasco-Martín that aims to create a socially powered information dashboard to help communities face disruptive events like natural disasters in Chile. The dashboard will provide tailored real-time information from official and social media sources to citizens, reporters, and researchers. The project team has conducted expert surveys, design workshops, and early development to design how the dashboard will prioritize and display different types of critical information to users depending on the disaster event and stage.


