Download to read offline
![International Journal on Integrating Technology in Education (IJITE) Vol.2, No.4, December 2013
Influence of Year of Study on Computer Attitude
of Business Education Students in Lagos, Nigeria.
1
Owolabi J. I, 2Owolabi J., 3OlayanjuT. A
Federal College of Education (Technical), Akoka, Lagos, Nigeria
Abstract
The purpose of this study was to examine the attitude to computer among Business Education students in
Lagos State tertiary institutions. The effect of year of study of the Business Education students on
their attitude to computer was studied. Four institutions of higher learning (two universities and two
Colleges of Education) in Lagos State were selected for the study. The sample comprised of 520 Business
Education students. The subjects responded to a computer attitudinal scale and a questionnaire
comprising items on the biodata of respondents. The study adopted the expost-facto research approach as
none of the variables was manipulated. The data collected were analysed using mean, standard deviation
and ANOVA. The statistical package for social sciences (SPSS) software was used to carry out the
analysis. The result revealed the following: year of study had significant effect on the Business
Education students’ attitude to Computer. Useful recommendations as they affect government policies,
delivery of Business Education in our tertiary institutions as well as Business Education students were
made.
Keywords
Attitudes, Influence, Year of study, Computer, Business Education, Student.
1. INTRODUCTION
Computer is now a common tool in education, industry, economy, politics, culture and several
other sectors. Therefore it can no longer be relegated to specialized work place settings. In
education in particular, Computer is both taught and used. Inspite of its importance, the level of
utilization of it is still low.
For instance, in Business education, the use of the
typewriter is still common in typewriting classes. The low level of usage of computer
implies a low attitude to it in certain quarters.
Students’ attitudes to Computer represent their feelings, desires, aversions, fears, convictions and
other tendencies that predispose them to act the way they do. Students’ attitudes to issues or
actions are not inherited, but are as a result of learning[3]. A student does not just deliberately set
himself or herself to like or dislike a subject, but it is because of the sort of experience he or she
had with the subject [2]. This is why attitude was viewed as an opinion, which represents a
person’s overall inclination towards an object, idea or institution [1]. According to [1], for a
child to be properly pre-disposed to learning integrated science, he or she has to form the right
An assessment of the attitude of 200 and 300 level computer education students of Federal
College of Education (special), Oyo, Nigeria towards the inclusion of computer education in
Colleges of Education curriculum, showed that there was a statistical significant difference
between the attitudes of the students at the different levels of study. The 200 level students
showed a more positive attitude [3].
DOI :10.5121/ijite.2013.2402
15](https://image.slidesharecdn.com/influenceofyearofstudyoncomputerattitudeofbusinesseducationstudentsinlagosnigeria-140108225712-phpapp02/75/Influence-of-year-of-study-on-computer-attitude-of-business-education-students-in-lagos-nigeria-1-2048.jpg)
![International Journal on Integrating Technology in Education (IJITE) Vol.2, No.4, December 2013
Computer attitude could be measured with the use of a scale known as ‘Computer Attitude Scale
(CAS). CAS is made up of four components. The first component called “Affect” is
composed of six items which measure feelings towards the Computer. The second component
which is the “Perceived Usefulness” (PU) is composed of five (5) items. PU measures the
individual’s belief about the usefulness of Computer in their jobs. T he t hi r d c o mp o n e n t
w h i c h i s “ pe r c e i ve d c o n t r o l ” is composed of six items. It measures the perceived
comfort level or difficulty of using Computer. The fourth component “Behavioural Intentions”
measures the Behavioural Intention and actions with respect to Computer [5]
Business education practice requires the utilisation of Computer tools for both training and
practice. The use of typewriter is no more popular. The computer is now required to do most of
the word processing and allied duties. Besides, the accounting packages are now available
for a more effective and stress free accounting. This makes the study about utilization of
Computer in Business education imperative. The extent to which an individual will use it will
depend on whether or not he is favourably disposed to it; hence the need for the study on the
attitude of Business Education students on the utilisation of Computer. This study will test and
discuss hypotheses on general (hypothesis 1) and specific (hypotheses 2-5) attitudes of
Business Education students to Computer as follows:
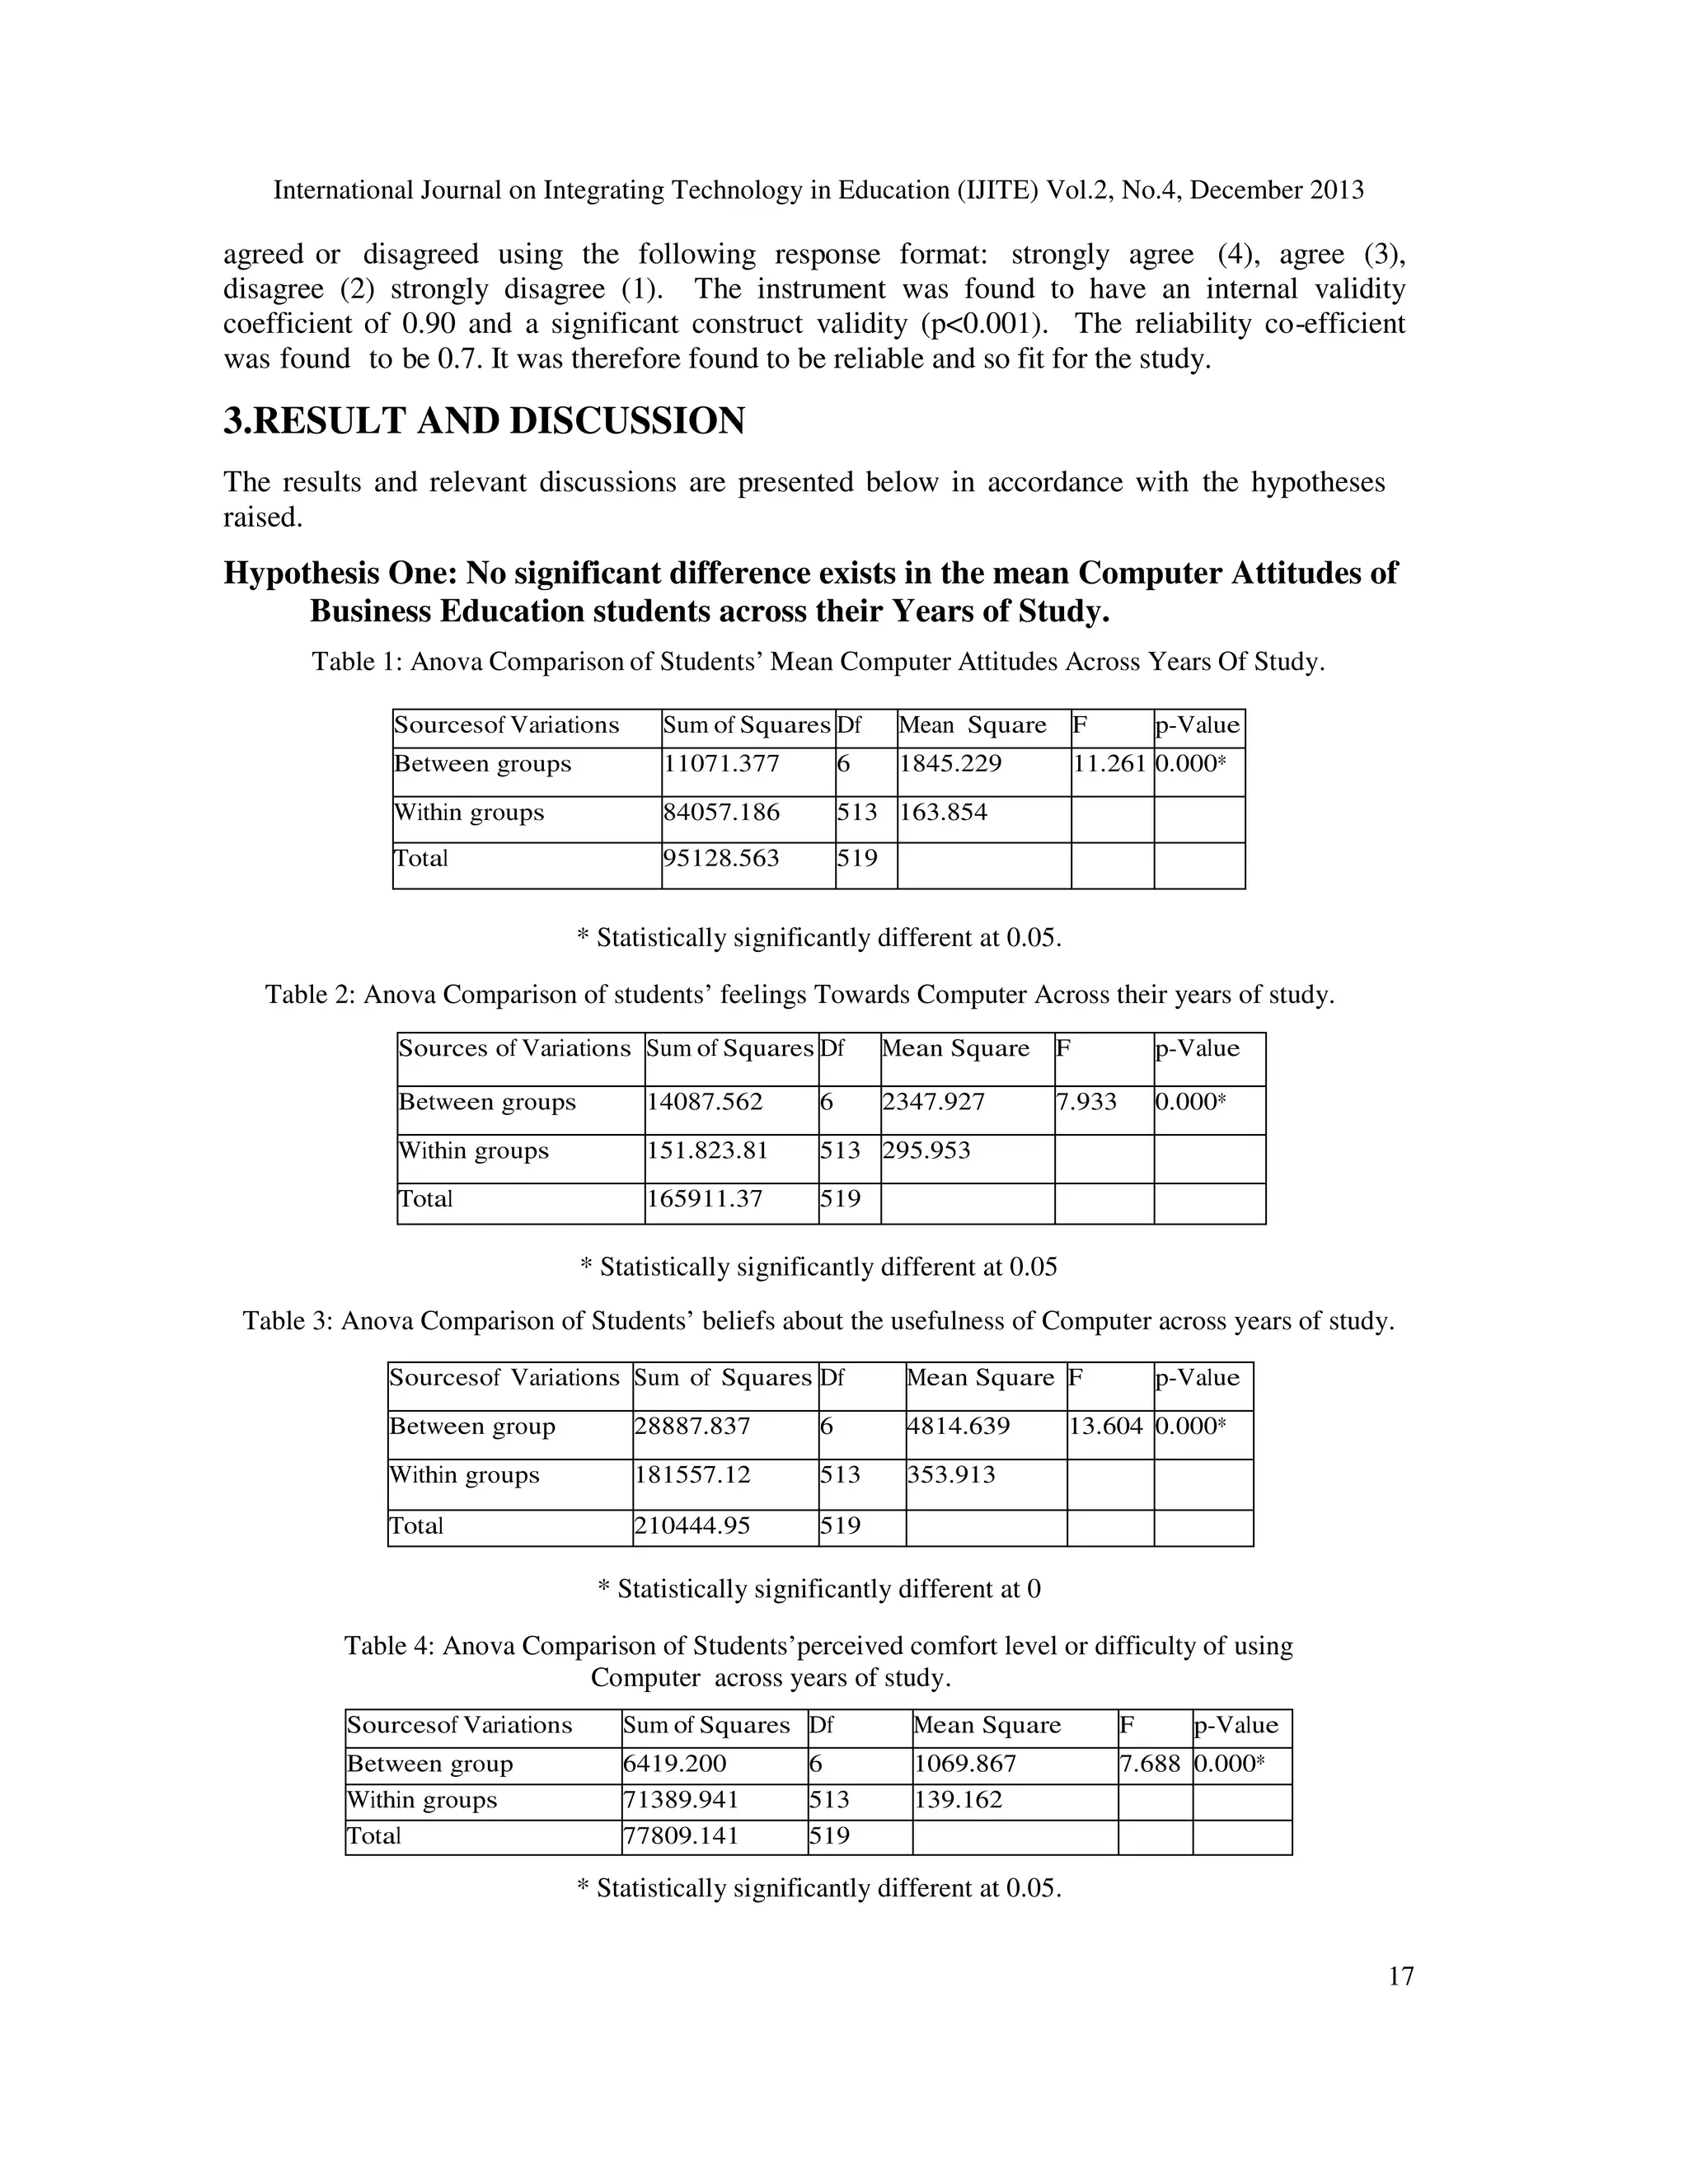
1. No significant difference exists in the mean Computer attitudes of Business education
students across their year of study.
2. There is no significant difference in the Business education students’ feelings towards
Computer across their year of study.
3. There is no significant difference in the Business education students’ beliefs about the
usefulness of
Computer across their year of study.
4. There is no significant difference in the Business education students’ perceived comfort
level or difficulty of using Computer across their year of study.
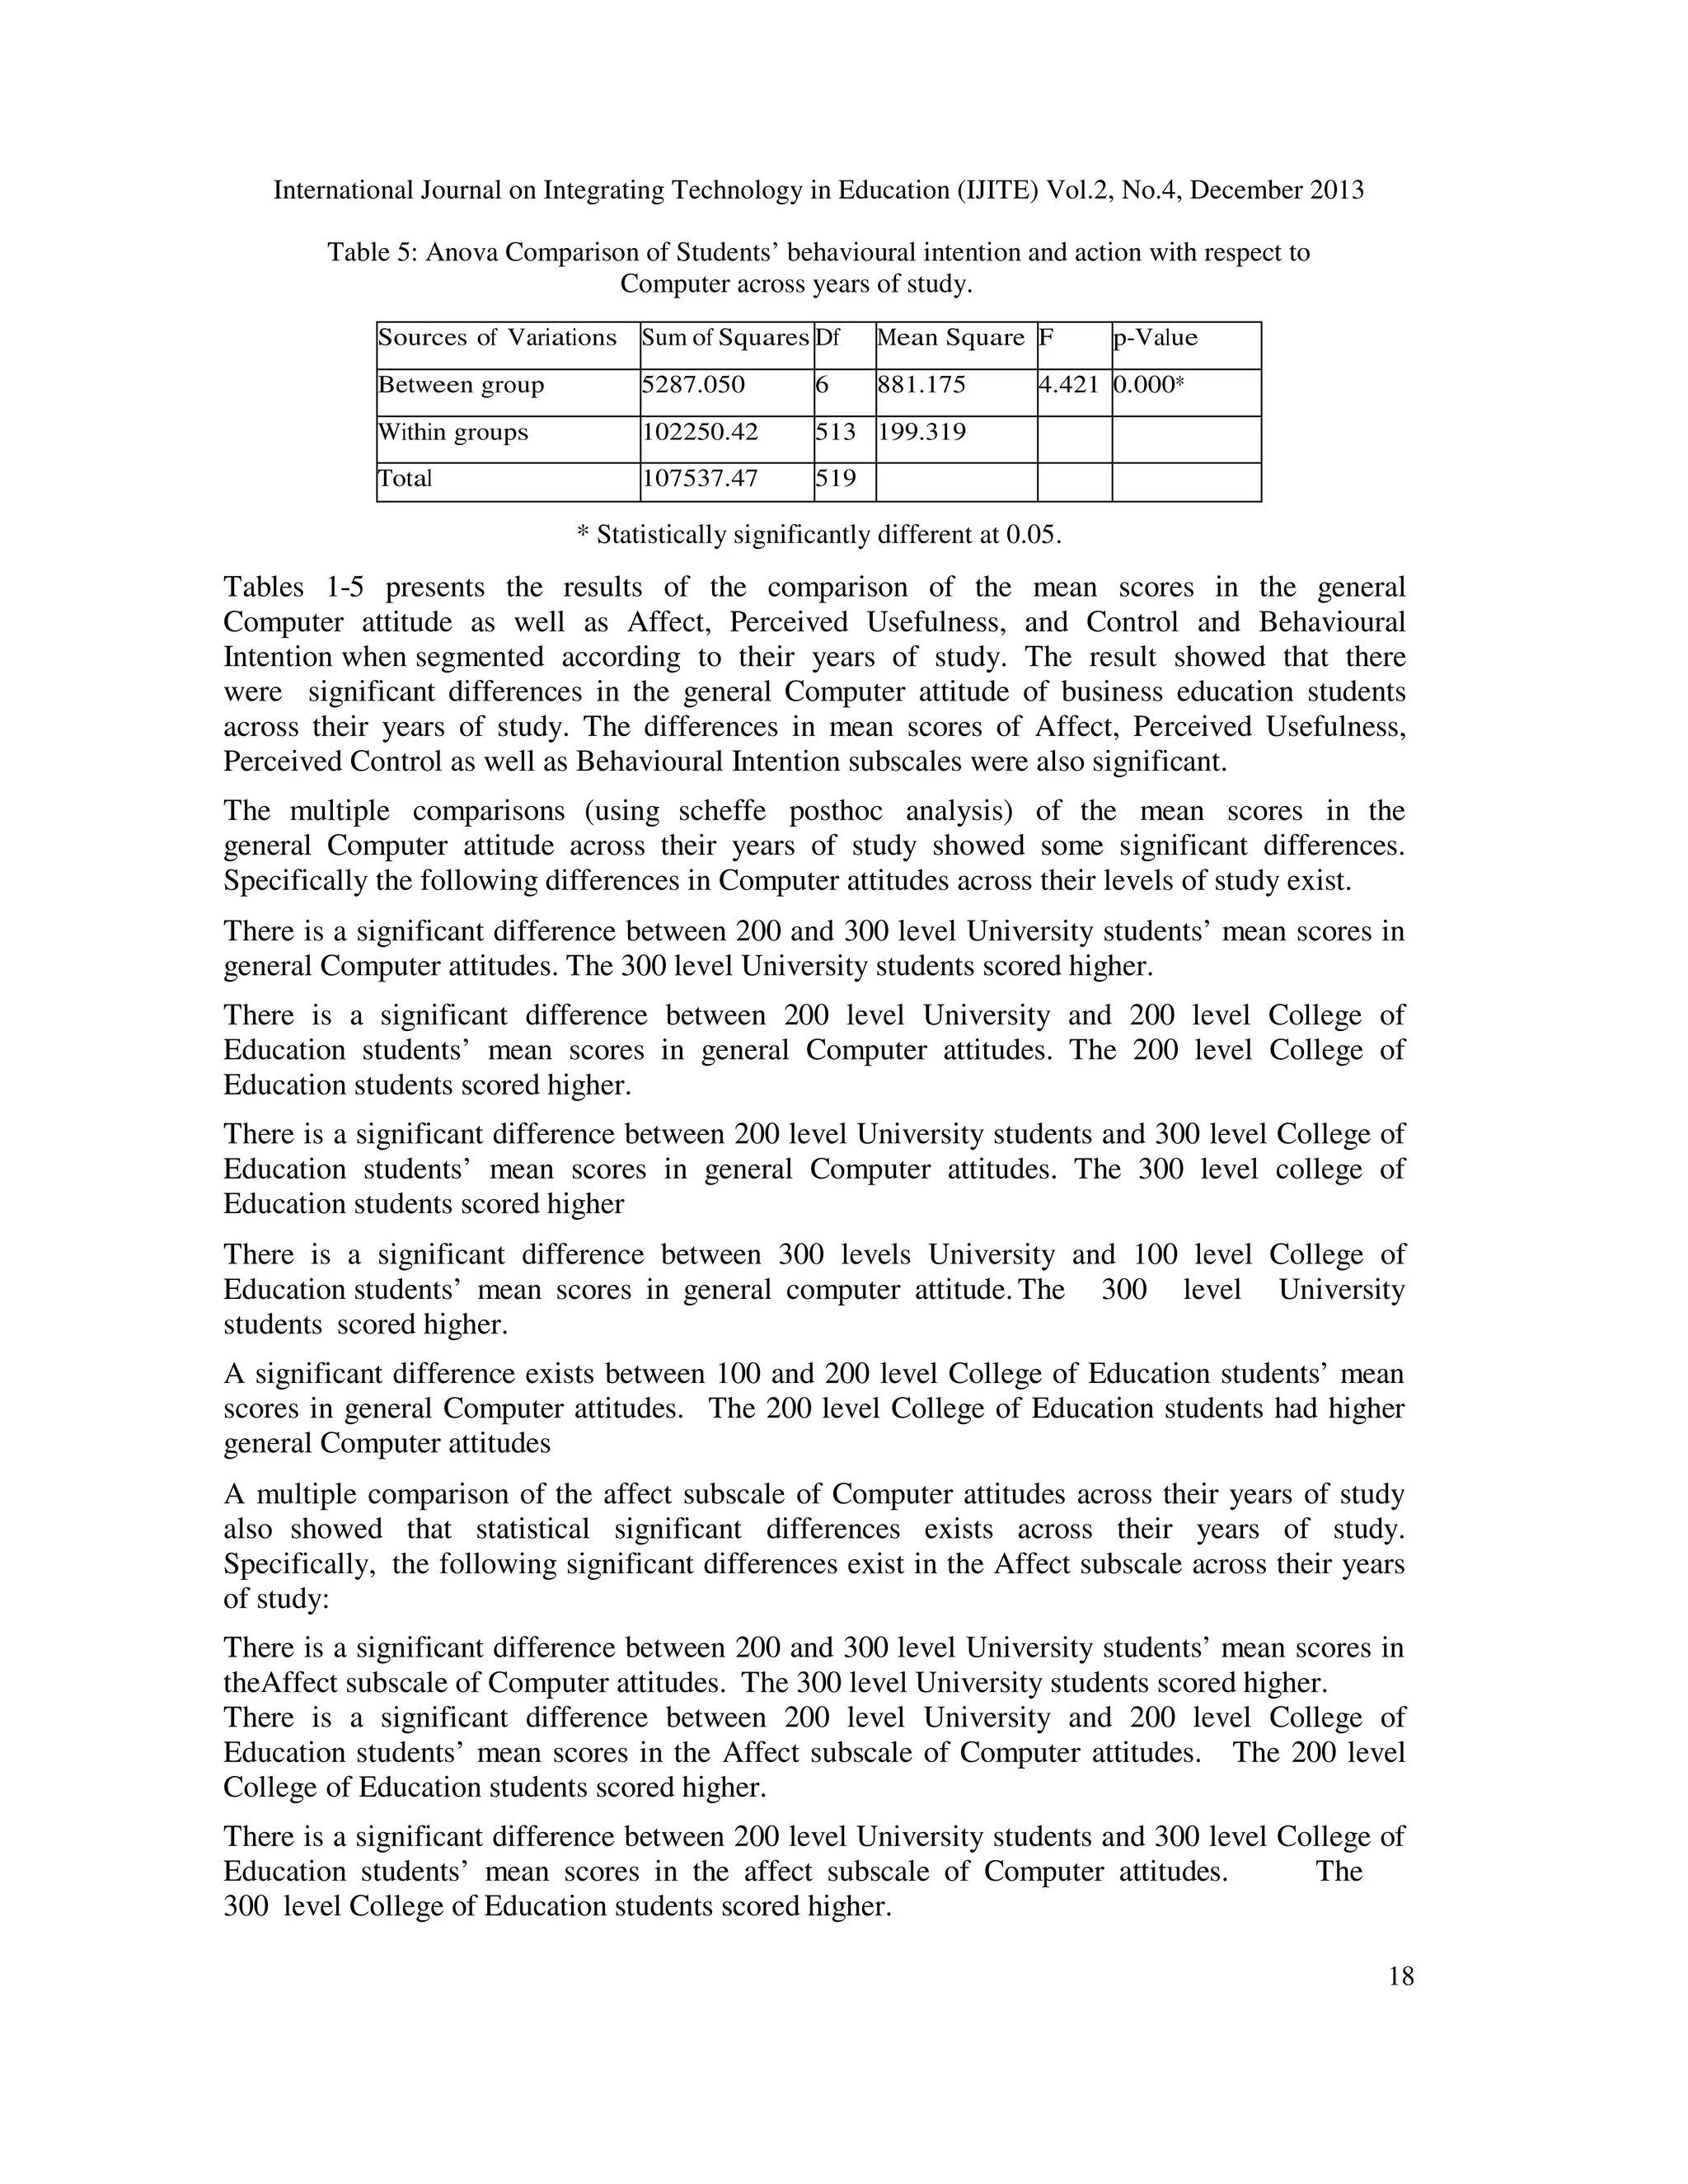
5. There is no significant difference in the Business education students’ behavioural
intention and action with respect to Computer across their year of study.
2. METHOD
The study adopted an expost facto design with the Business Education students in tertiary
institutions in Lagos State, Nigeria as population for the study. Purposive sampling
procedure was used. Two government owned universities (one federal government owned and
one state owned) and Two government owned Colleges of Education (one federal government
owned and one state owned) where Business Education courses are offered, were selected for the
study. The computer attitude scale (CAS), originally developed and validated by Selwyn and
later adapted by Soh was administered on 520 Business education students from the four
selected tertiary institutions. CAS comprised of four components. The first component called
“Affect” is composed of six items measuring feelings towards computers. The second one
called “Perceived usefulness” (PU) which comprises of five items measures the individual’s
belief about the usefulness of computer in their studies. “Perceived Control” which is the third
component is composed of six
items and measures the perceived comfort level or difficulty encountered in Computer
usage. “Behavioural intentions” comprising of four items measures the Behavioural intention
and actions with respect to computer usage. Each item is an attitudinal statement to which they
16](https://image.slidesharecdn.com/influenceofyearofstudyoncomputerattitudeofbusinesseducationstudentsinlagosnigeria-140108225712-phpapp02/75/Influence-of-year-of-study-on-computer-attitude-of-business-education-students-in-lagos-nigeria-2-2048.jpg)
![International Journal on Integrating Technology in Education (IJITE) Vol.2, No.4, December 2013
There is a significant difference between 200 and 300 level University students. The 300
level University students had higher mean scores.
In this study, the year of study had significant impact on respondents’ attitudes to Computer. The
finding in this study confirms the finding of [3] but contradict the finding
of [4]. The
disparity in the findings could be explained by the geographical scope of the study. [3] and the
current study drew sample from a single state whereas [4] drew his sample from Lagos and Ogun
States.
4. CONCLUSION
The purpose of the study was to investigate Business Education students’ Attitude to
Computer. It also studied the influence of years of study on Business Education Students’
attitude to computer. It could therefore be concluded that years of study is a strong factor in
determining Business Education students’ attitude to Computer.
5. RECOMMENDATION FOR IMPLEMENTATION
Based on the findings of this study and the conclusion drawn, the following are suggested for
implementations.
The government should intensify her effort on the Computer based policies. The policies should
be reviewed to lay more emphasis (especially at the University level) on practical skill
acquisition.
In the delivery of Business Education courses, students should be encouraged and compelled to
use Computer tools.
The activities of students’ professional associations should be geared towards encouraging
the use ofComputer.
By now, the computer should be made to completely replace the typewriter.
words, typewriter should be phased out completely.
In other
Each Business Education student should be encouraged to have his/her own personal computer.
REFERENCES
[1]
P.O. Agogo, “The Attitudes of Students as a factor in the Learning of Integrated Science .A case
study of School in Oju Local Government Area of Benue State” Teacher Education Today. Journal of
the Committee of Provosts of Colleges of Education, Nigeria, 1989.
[2]
P.O. Agogo,. “The need of Scientific Attitude Formation and Development among Secondary
School Students in Benue State”. Journal of Science and TechnologyEducation Nigeria, 1991.
[3]
A.Ogwuegbu, “Students’ Attitude towards the Inclusion of Computer Education in Colleges of
Education Curriculum: A case study of Federal College of Education (Special),
Oyo”.A
Paperpresented at the Annual National Conference of National Council for
ExceptionalChildren(NCEC), Minna, Nigeria, 2002.
[4]
J..Owolabi, “Exploring Mathematics Teacher Trainees’ Attitude to and use of Information and
Communication Technology”. Unpublished M. Ed thesis submitted to International Centre for
Educational Evaluation, Institute of Education, University of Ibadan, Nigeria, 2006.
[5]
N. Selwyn, “Students Attitude towards computers: Validation of a Computer Attitude Scale for 16-19
Computer Education”, 1997.
[6]
SEPA: Handbook for Teachers of Science, FEP International Private Ltd, Singapore, 1978.
20](https://image.slidesharecdn.com/influenceofyearofstudyoncomputerattitudeofbusinesseducationstudentsinlagosnigeria-140108225712-phpapp02/75/Influence-of-year-of-study-on-computer-attitude-of-business-education-students-in-lagos-nigeria-6-2048.jpg)


This study examined the influence of the year of study on the computer attitudes of business education students in Lagos, Nigeria, revealing significant differences across various years of study. The data were collected from 520 students using a computer attitude scale and analyzed through ANOVA, indicating that higher levels of study were associated with more positive attitudes towards computers. Recommendations include enhancing government policies on computer use in education and encouraging students to replace typewriters with personal computers.


![Vibe Coding vs. Spec-Driven Development [Free Meetup]](https://cdn.slidesharecdn.com/ss_thumbnails/vibecodingvsspecdrivendevelopment-251209105622-43f455e7-thumbnail.jpg?width=640&height=640&fit=bounds)


