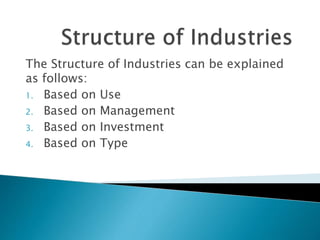
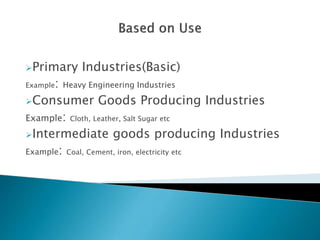
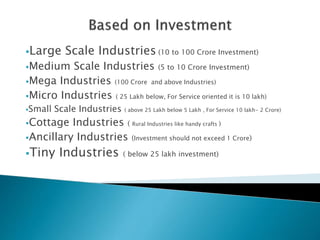
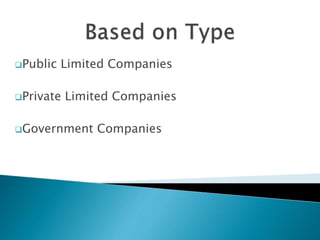
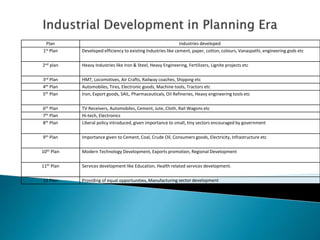
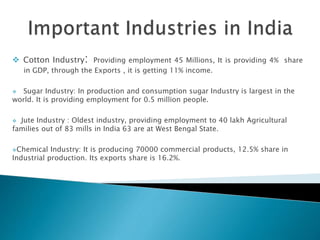
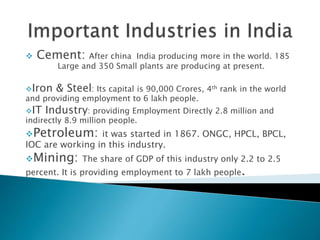
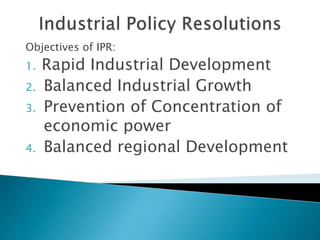
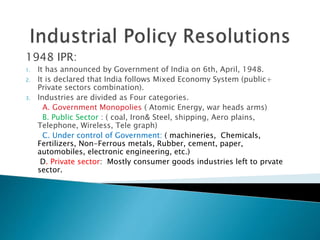
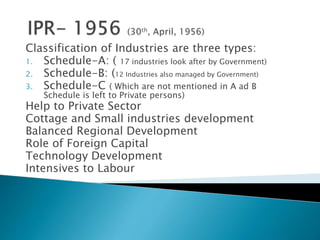
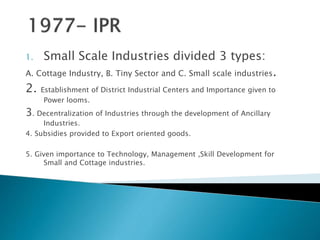
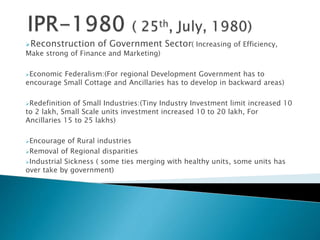
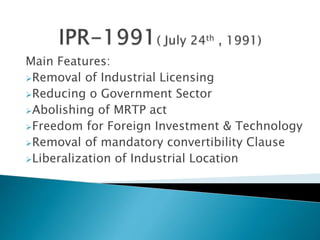
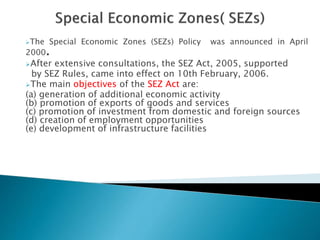
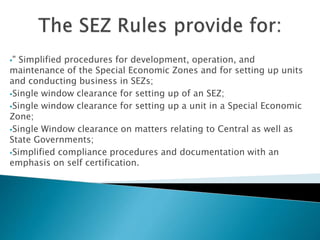
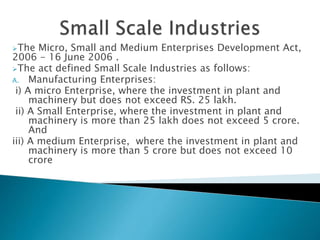
Industrial Sector
The Structure of Industries can be explained
as follows:
1. Based on Use
2. Based on Management
3. Based on Investment
4. Based on Type
Primary Industries(Basic)
Example: Heavy Engineering Industries
Consumer Goods Producing Industries
Example: Cloth, Leather, Salt Sugar etc
Intermediate goods producing Industries
Example: Coal, Cement, iron, electricity etc
Public Sector Firms
Private Sector
Joint Sector
Large Scale Industries (10 to 100 Crore Investment)
Medium Scale Industries (5 to 10 Crore Investment)
Mega Industries (100 Crore and above Industries)
Micro Industries ( 25 Lakh below, For Service oriented it is 10 lakh)
Small Scale Industries ( above 25 Lakh below 5 Lakh , For Service 10 lakh- 2 Crore)
Cottage Industries ( Rural Industries like handy crafts )
Ancillary Industries (Investment should not exceed 1 Crore)
Tiny Industries ( below 25 lakh investment)
Public Limited Companies
Private Limited Companies
Government Companies
I. Primary Industry (Nature related, Forests, Flowers, Fishes)
II. Genetic Industry ( Plants, Animals Farms)
III. Extractive Industry ( Oils, Coal, minerals, iron ore)
IV. Manufacture Industry ( Final goods like Cloth, Sugar, soaps, chemicals)
V. Construction Industry ( Housing, Bridges, Roads, Barrages, Dams etc)
VI. Services Industries (Hotels, Tourism, Entertanment)
 There are three components in Index of
Industrial products.
I. Mining
II. Manufacturing and
III. Electricity
 The Classification of Index of Industries
depends on its use.
 The Growth of Industries can be explained
through IIP.
 For the under stand of growth rate of
Industries it can considered last five years.
Groups 2009-10 2010-11 2011-12 2013-14 2013-14
Mining 7.9 5.2 -2.0 -2.3 -0.6
Manufacturing 4.8 8.9 3.0 1.3 -0.8
Electricity 6.1 5.5 8.2 4.0 6.4
General Index 5.3 8.2 2.9 1.1 -0.8
Sector 2009-10 2010-11 2011-12 2012-13 2013-14
Coal 8.1 -0.2 1.3 4.6 0.7
Crude Oil 0.5 11.9 1.0 -0.6 -0.2
Natural Gas 44.6 10.0 -8.9 -14.5 -13.0
Refineries goods -0.4 3.0 3.1 29.0 1.6
Chemicals & fertilizers 12.7 0.0 0.4 -3.4 1.5
Steel 6.0 13.2 10.3 4.1 6.8
Cement 10.5 4.5 6.7 7.7 3.0
Electricity 6.2 5.6 8.1 4.0 5.7
Total Index 6.6 6.6 5.0 6.5 3.1
Plan Industries developed
1st Plan Developed efficiency to existing Industries like cement, paper, cotton, colours, Vanaspathi, engineering gods etc
2nd plan Heavy Industries like Iron & Steel, Heavy Engineering, Fertilizers, Lignite projects etc
3rd Plan HMT, Locomotives, Air Crafts, Railway coaches, Shipping etc
4th Plan Automobiles, Tires, Electronic goods, Machine tools, Tractors etc
5th Plan Iron, Export goods, SAIL, Pharmaceuticals, Oil Refineries, Heavy engineering tools etc
6th Plan TV Receivers, Automobiles, Cement, Jute, Cloth, Rail Wagons etc
7th Plan Hi-tech, Electronics
8th Plan Liberal policy introduced, given importance to small, tiny sectors encouraged by government
9th Plan Importance given to Cement, Coal, Crude Oil, Consumers goods, Electricity, Infrastructure etc
10th Plan Modern Technology Development, Exports promotion, Regional Development
11th Plan Services development like Education, Health related services development.
12 Plan Providing of equal opportunities, Manufacturing sector development
 Cotton Industry: Providing employment 45 Millions, It is providing 4% share
in GDP, through the Exports , it is getting 11% income.
 Sugar Industry: In production and consumption sugar Industry is largest in the
world. It is providing employment for 0.5 million people.
 Jute Industry : Oldest industry, providing employment to 40 lakh Agricultural
families out of 83 mills in India 63 are at West Bengal State.
Chemical Industry: It is producing 70000 commercial products, 12.5% share in
Industrial production. Its exports share is 16.2%.
 Cement: After china India producing more in the world. 185
Large and 350 Small plants are producing at present.
Iron & Steel: Its capital is 90,000 Crores, 4th rank in the world
and providing employment to 6 lakh people.
IT Industry: providing Employment Directly 2.8 million and
indirectly 8.9 million people.
Petroleum: it was started in 1867. ONGC, HPCL, BPCL,
IOC are working in this industry.
Mining: The share of GDP of this industry only 2.2 to 2.5
percent. It is providing employment to 7 lakh people.
Objectives of IPR:
1. Rapid Industrial Development
2. Balanced Industrial Growth
3. Prevention of Concentration of
economic power
4. Balanced regional Development
1948 IPR:
1. It has announced by Government of India on 6th, April, 1948.
2. It is declared that India follows Mixed Economy System (public+
Private sectors combination).
3. Industries are divided as Four categories.
A. Government Monopolies ( Atomic Energy, war heads arms)
B. Public Sector : ( coal, Iron& Steel, shipping, Aero plains,
Telephone, Wireless, Tele graph)
C. Under control of Government: ( machineries, Chemicals,
Fertilizers, Non-Ferrous metals, Rubber, cement, paper,
automobiles, electronic engineering, etc.)
D. Private sector: Mostly consumer goods industries left to prvate
sector.
Classification of Industries are three types:
1. Schedule-A: ( 17 industries look after by Government)
2. Schedule-B: (12 Industries also managed by Government)
3. Schedule-C ( Which are not mentioned in A ad B
Schedule is left to Private persons)
Help to Private Sector
Cottage and Small industries development
Balanced Regional Development
Role of Foreign Capital
Technology Development
Intensives to Labour
1. Small Scale Industries divided 3 types:
A. Cottage Industry, B. Tiny Sector and C. Small scale industries.
2. Establishment of District Industrial Centers and Importance given to
Power looms.
3. Decentralization of Industries through the development of Ancillary
Industries.
4. Subsidies provided to Export oriented goods.
5. Given importance to Technology, Management ,Skill Development for
Small and Cottage industries.
Reconstruction of Government Sector( Increasing of Efficiency,
Make strong of Finance and Marketing)
Economic Federalism:(For regional Development Government has to
encourage Small Cottage and Ancillaries has to develop in backward areas)
Redefinition of Small Industries:(Tiny Industry Investment limit increased 10
to 2 lakh, Small Scale units investment increased 10 to 20 lakh, For
Ancillaries 15 to 25 lakhs)
Encourage of Rural industries
Removal of Regional disparities
Industrial Sickness ( some ties merging with healthy units, some units has
over take by government)
Main Features:
Removal of Industrial Licensing
Reducing o Government Sector
Abolishing of MRTP act
Freedom for Foreign Investment & Technology
Removal of mandatory convertibility Clause
Liberalization of Industrial Location
The Special Economic Zones (SEZs) Policy was announced in April
2000.
After extensive consultations, the SEZ Act, 2005, supported
by SEZ Rules, came into effect on 10th February, 2006.
The main objectives of the SEZ Act are:
(a) generation of additional economic activity
(b) promotion of exports of goods and services
(c) promotion of investment from domestic and foreign sources
(d) creation of employment opportunities
(e) development of infrastructure facilities
" Simplified procedures for development, operation, and
maintenance of the Special Economic Zones and for setting up units
and conducting business in SEZs;
Single window clearance for setting up of an SEZ;
Single window clearance for setting up a unit in a Special Economic
Zone;
Single Window clearance on matters relating to Central as well as
State Governments;
Simplified compliance procedures and documentation with an
emphasis on self certification.
The Micro, Small and Medium Enterprises Development Act,
2006 - 16 June 2006 .
The act defined Small Scale Industries as follows:
A. Manufacturing Enterprises:
i) A micro Enterprise, where the investment in plant and
machinery but does not exceed RS. 25 lakh.
ii) A Small Enterprise, where the investment in plant and
machinery is more than 25 lakh does not exceed 5 crore.
And
iii) A medium Enterprise, where the investment in plant and
machinery is more than 5 crore but does not exceed 10
crore
B. Service Enterprises:
i) A micro Enterprise, where the investment in
equipment does not exceed RS. 10 lakh.
ii) A Small Enterprise, where the investment in
equipment is more than 10 lakh does not
exceed 2 crore. And
iii) A medium Enterprise, where the
investment in equipment is more than 2
crore but does not exceed 5 crore
1. Finance and Credit
2. Infrastructural Constraints.
3. Inverted Tariff Structure
4. Availability of Raw Materials
5. Problem of marketing
6. Delayed payments
7. Problem of Sickness
8. Adverse effects of economic Reforms.
Internal Sources ( Savings, Surplus of other units):
Equities, Debenchers, and Bonds:
Public Deposits:
Bank Loans:
Indigenous Bankers:
Foreign Capital:
Development banks: IDBI, IFCI, ICICI, IIBI, SIDBI, and
IDFC( Infrastructure Development Finance Company)

Industrial sector

  • 1.
  • 2.
    The Structure ofIndustries can be explained as follows: 1. Based on Use 2. Based on Management 3. Based on Investment 4. Based on Type
  • 3.
    Primary Industries(Basic) Example: HeavyEngineering Industries Consumer Goods Producing Industries Example: Cloth, Leather, Salt Sugar etc Intermediate goods producing Industries Example: Coal, Cement, iron, electricity etc
  • 4.
    Public Sector Firms PrivateSector Joint Sector
  • 5.
    Large Scale Industries(10 to 100 Crore Investment) Medium Scale Industries (5 to 10 Crore Investment) Mega Industries (100 Crore and above Industries) Micro Industries ( 25 Lakh below, For Service oriented it is 10 lakh) Small Scale Industries ( above 25 Lakh below 5 Lakh , For Service 10 lakh- 2 Crore) Cottage Industries ( Rural Industries like handy crafts ) Ancillary Industries (Investment should not exceed 1 Crore) Tiny Industries ( below 25 lakh investment)
  • 6.
    Public Limited Companies PrivateLimited Companies Government Companies
  • 7.
    I. Primary Industry(Nature related, Forests, Flowers, Fishes) II. Genetic Industry ( Plants, Animals Farms) III. Extractive Industry ( Oils, Coal, minerals, iron ore) IV. Manufacture Industry ( Final goods like Cloth, Sugar, soaps, chemicals) V. Construction Industry ( Housing, Bridges, Roads, Barrages, Dams etc) VI. Services Industries (Hotels, Tourism, Entertanment)
  • 8.
     There arethree components in Index of Industrial products. I. Mining II. Manufacturing and III. Electricity  The Classification of Index of Industries depends on its use.  The Growth of Industries can be explained through IIP.  For the under stand of growth rate of Industries it can considered last five years.
  • 9.
    Groups 2009-10 2010-112011-12 2013-14 2013-14 Mining 7.9 5.2 -2.0 -2.3 -0.6 Manufacturing 4.8 8.9 3.0 1.3 -0.8 Electricity 6.1 5.5 8.2 4.0 6.4 General Index 5.3 8.2 2.9 1.1 -0.8
  • 10.
    Sector 2009-10 2010-112011-12 2012-13 2013-14 Coal 8.1 -0.2 1.3 4.6 0.7 Crude Oil 0.5 11.9 1.0 -0.6 -0.2 Natural Gas 44.6 10.0 -8.9 -14.5 -13.0 Refineries goods -0.4 3.0 3.1 29.0 1.6 Chemicals & fertilizers 12.7 0.0 0.4 -3.4 1.5 Steel 6.0 13.2 10.3 4.1 6.8 Cement 10.5 4.5 6.7 7.7 3.0 Electricity 6.2 5.6 8.1 4.0 5.7 Total Index 6.6 6.6 5.0 6.5 3.1
  • 11.
    Plan Industries developed 1stPlan Developed efficiency to existing Industries like cement, paper, cotton, colours, Vanaspathi, engineering gods etc 2nd plan Heavy Industries like Iron & Steel, Heavy Engineering, Fertilizers, Lignite projects etc 3rd Plan HMT, Locomotives, Air Crafts, Railway coaches, Shipping etc 4th Plan Automobiles, Tires, Electronic goods, Machine tools, Tractors etc 5th Plan Iron, Export goods, SAIL, Pharmaceuticals, Oil Refineries, Heavy engineering tools etc 6th Plan TV Receivers, Automobiles, Cement, Jute, Cloth, Rail Wagons etc 7th Plan Hi-tech, Electronics 8th Plan Liberal policy introduced, given importance to small, tiny sectors encouraged by government 9th Plan Importance given to Cement, Coal, Crude Oil, Consumers goods, Electricity, Infrastructure etc 10th Plan Modern Technology Development, Exports promotion, Regional Development 11th Plan Services development like Education, Health related services development. 12 Plan Providing of equal opportunities, Manufacturing sector development
  • 12.
     Cotton Industry:Providing employment 45 Millions, It is providing 4% share in GDP, through the Exports , it is getting 11% income.  Sugar Industry: In production and consumption sugar Industry is largest in the world. It is providing employment for 0.5 million people.  Jute Industry : Oldest industry, providing employment to 40 lakh Agricultural families out of 83 mills in India 63 are at West Bengal State. Chemical Industry: It is producing 70000 commercial products, 12.5% share in Industrial production. Its exports share is 16.2%.
  • 13.
     Cement: Afterchina India producing more in the world. 185 Large and 350 Small plants are producing at present. Iron & Steel: Its capital is 90,000 Crores, 4th rank in the world and providing employment to 6 lakh people. IT Industry: providing Employment Directly 2.8 million and indirectly 8.9 million people. Petroleum: it was started in 1867. ONGC, HPCL, BPCL, IOC are working in this industry. Mining: The share of GDP of this industry only 2.2 to 2.5 percent. It is providing employment to 7 lakh people.
  • 14.
    Objectives of IPR: 1.Rapid Industrial Development 2. Balanced Industrial Growth 3. Prevention of Concentration of economic power 4. Balanced regional Development
  • 15.
    1948 IPR: 1. Ithas announced by Government of India on 6th, April, 1948. 2. It is declared that India follows Mixed Economy System (public+ Private sectors combination). 3. Industries are divided as Four categories. A. Government Monopolies ( Atomic Energy, war heads arms) B. Public Sector : ( coal, Iron& Steel, shipping, Aero plains, Telephone, Wireless, Tele graph) C. Under control of Government: ( machineries, Chemicals, Fertilizers, Non-Ferrous metals, Rubber, cement, paper, automobiles, electronic engineering, etc.) D. Private sector: Mostly consumer goods industries left to prvate sector.
  • 16.
    Classification of Industriesare three types: 1. Schedule-A: ( 17 industries look after by Government) 2. Schedule-B: (12 Industries also managed by Government) 3. Schedule-C ( Which are not mentioned in A ad B Schedule is left to Private persons) Help to Private Sector Cottage and Small industries development Balanced Regional Development Role of Foreign Capital Technology Development Intensives to Labour
  • 17.
    1. Small ScaleIndustries divided 3 types: A. Cottage Industry, B. Tiny Sector and C. Small scale industries. 2. Establishment of District Industrial Centers and Importance given to Power looms. 3. Decentralization of Industries through the development of Ancillary Industries. 4. Subsidies provided to Export oriented goods. 5. Given importance to Technology, Management ,Skill Development for Small and Cottage industries.
  • 18.
    Reconstruction of GovernmentSector( Increasing of Efficiency, Make strong of Finance and Marketing) Economic Federalism:(For regional Development Government has to encourage Small Cottage and Ancillaries has to develop in backward areas) Redefinition of Small Industries:(Tiny Industry Investment limit increased 10 to 2 lakh, Small Scale units investment increased 10 to 20 lakh, For Ancillaries 15 to 25 lakhs) Encourage of Rural industries Removal of Regional disparities Industrial Sickness ( some ties merging with healthy units, some units has over take by government)
  • 19.
    Main Features: Removal ofIndustrial Licensing Reducing o Government Sector Abolishing of MRTP act Freedom for Foreign Investment & Technology Removal of mandatory convertibility Clause Liberalization of Industrial Location
  • 20.
    The Special EconomicZones (SEZs) Policy was announced in April 2000. After extensive consultations, the SEZ Act, 2005, supported by SEZ Rules, came into effect on 10th February, 2006. The main objectives of the SEZ Act are: (a) generation of additional economic activity (b) promotion of exports of goods and services (c) promotion of investment from domestic and foreign sources (d) creation of employment opportunities (e) development of infrastructure facilities
  • 21.
    " Simplified proceduresfor development, operation, and maintenance of the Special Economic Zones and for setting up units and conducting business in SEZs; Single window clearance for setting up of an SEZ; Single window clearance for setting up a unit in a Special Economic Zone; Single Window clearance on matters relating to Central as well as State Governments; Simplified compliance procedures and documentation with an emphasis on self certification.
  • 22.
    The Micro, Smalland Medium Enterprises Development Act, 2006 - 16 June 2006 . The act defined Small Scale Industries as follows: A. Manufacturing Enterprises: i) A micro Enterprise, where the investment in plant and machinery but does not exceed RS. 25 lakh. ii) A Small Enterprise, where the investment in plant and machinery is more than 25 lakh does not exceed 5 crore. And iii) A medium Enterprise, where the investment in plant and machinery is more than 5 crore but does not exceed 10 crore
  • 23.
    B. Service Enterprises: i)A micro Enterprise, where the investment in equipment does not exceed RS. 10 lakh. ii) A Small Enterprise, where the investment in equipment is more than 10 lakh does not exceed 2 crore. And iii) A medium Enterprise, where the investment in equipment is more than 2 crore but does not exceed 5 crore
  • 24.
    1. Finance andCredit 2. Infrastructural Constraints. 3. Inverted Tariff Structure 4. Availability of Raw Materials 5. Problem of marketing 6. Delayed payments 7. Problem of Sickness 8. Adverse effects of economic Reforms.
  • 25.
    Internal Sources (Savings, Surplus of other units): Equities, Debenchers, and Bonds: Public Deposits: Bank Loans: Indigenous Bankers: Foreign Capital: Development banks: IDBI, IFCI, ICICI, IIBI, SIDBI, and IDFC( Infrastructure Development Finance Company)