Download to read offline
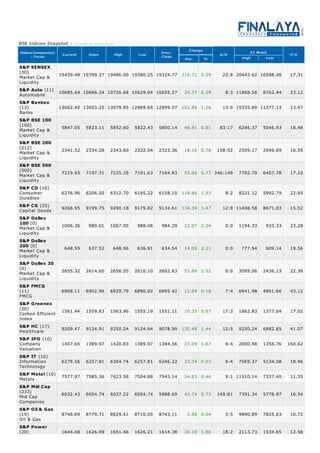
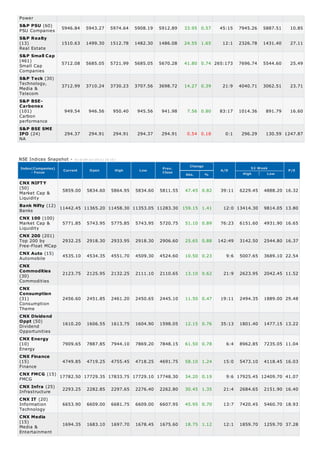
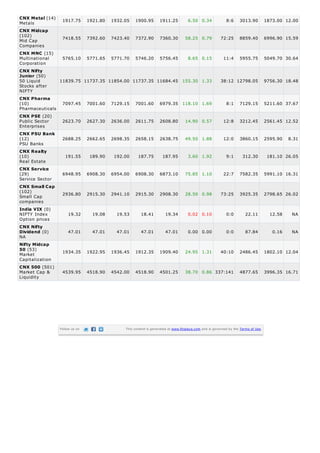

The document provides a snapshot of various Indian stock market indices as of July 9, 2013, including the S&P BSE SENSEX (30 companies), Nifty 50, Bank Nifty, and other sectoral indices. It lists the current value, day's high and low, previous close, change in points and percentage, and other metrics like P/E ratio, 52-week high and low for each index. The table also categorizes the indices by number and type of constituent companies and provides a market capitalization and liquidity focus for some.


