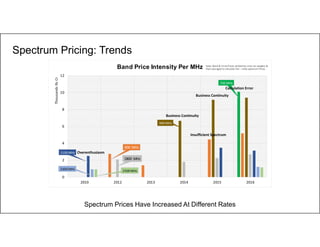
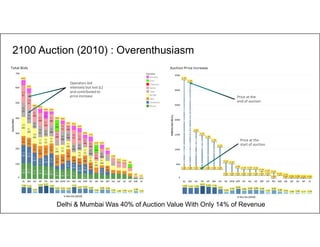
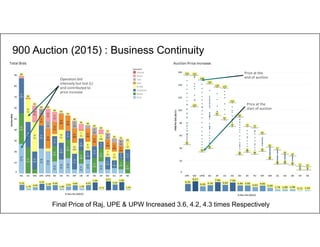
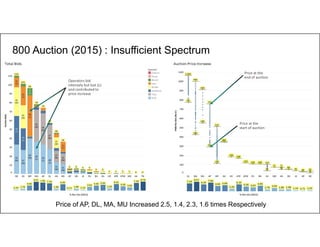
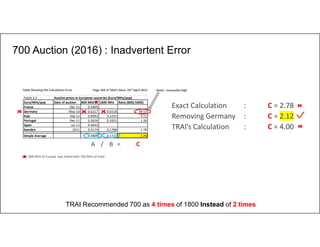
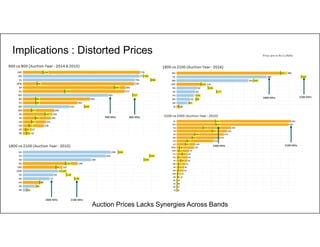
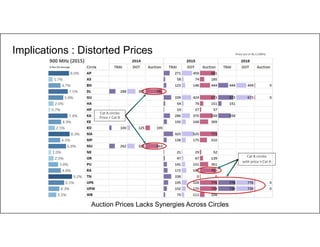
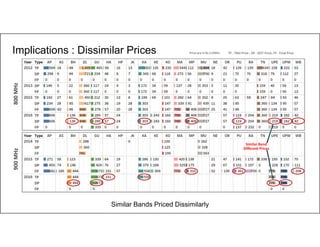
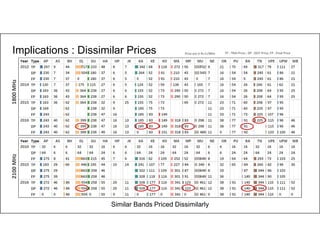
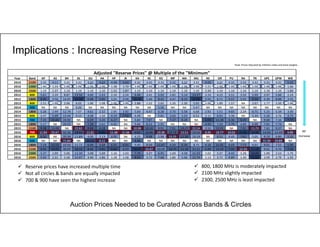
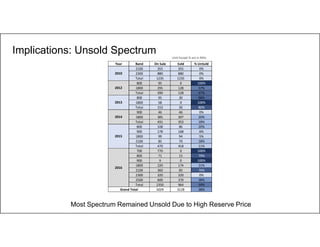
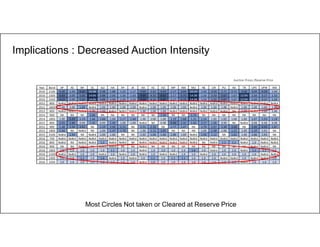
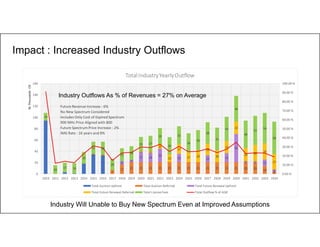
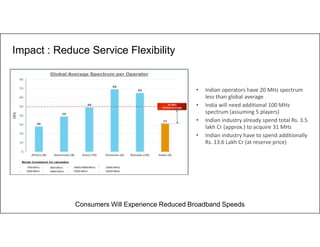
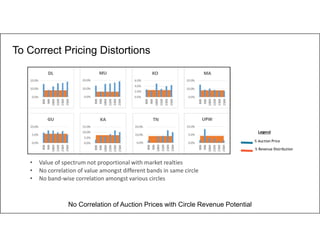
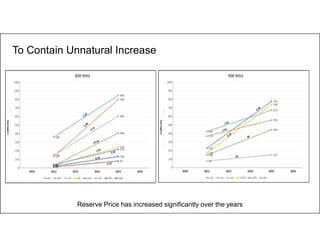
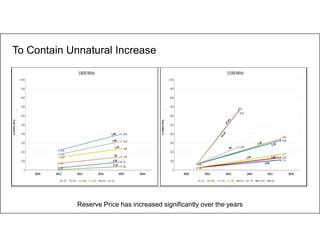
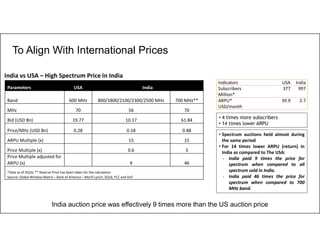
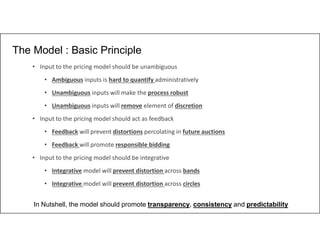
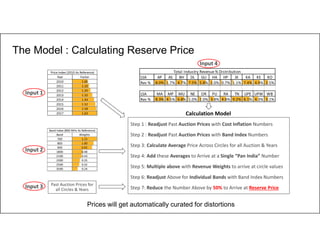
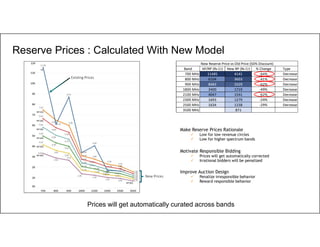
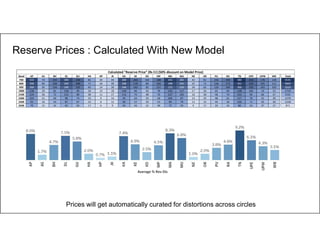
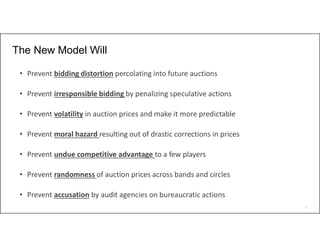
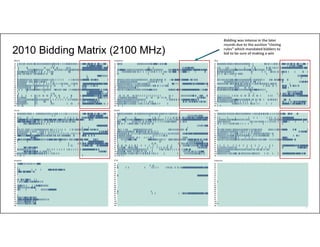
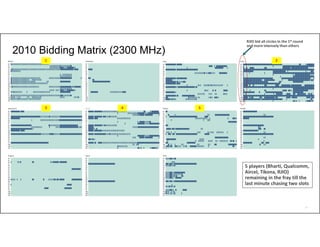
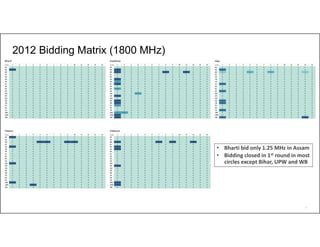
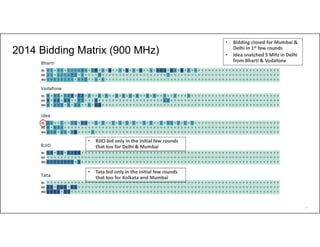
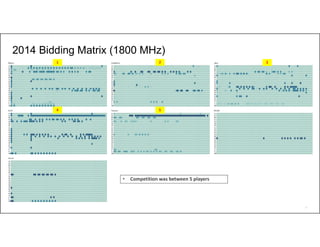
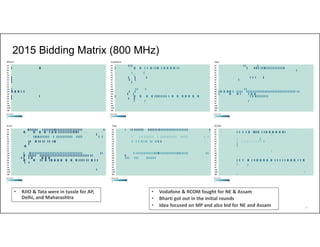
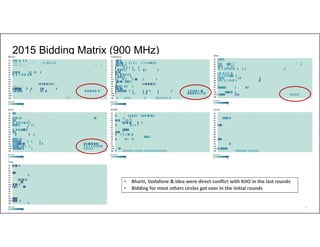
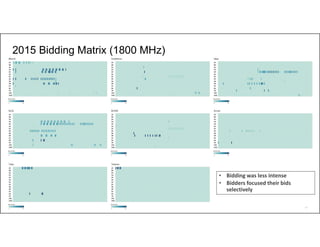
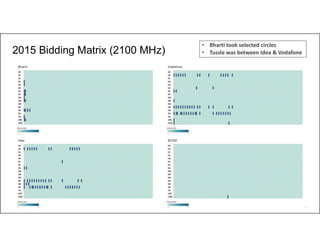
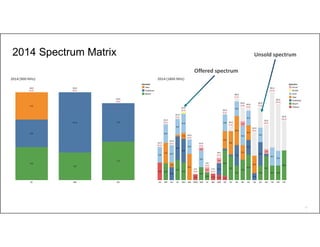
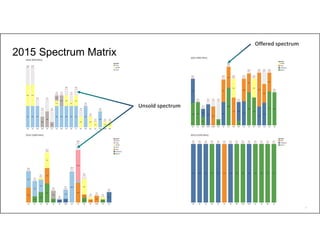
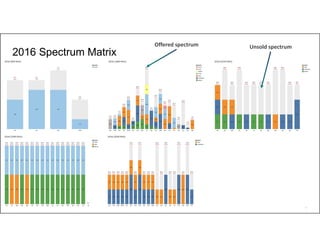
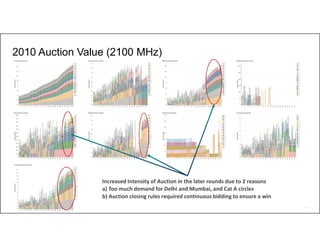
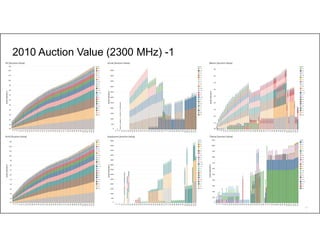
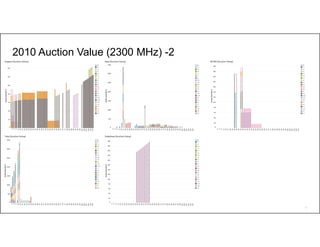
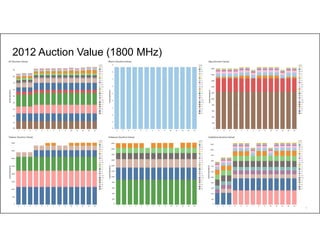
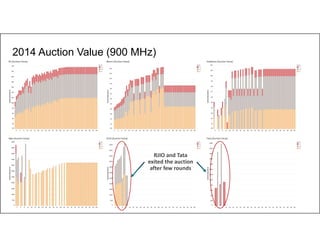
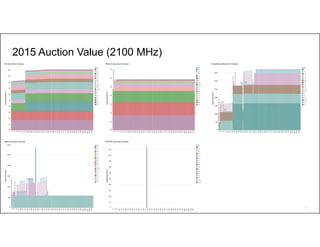
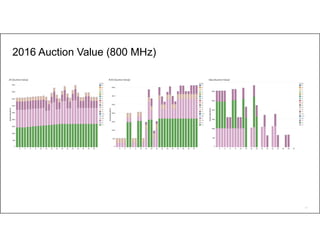
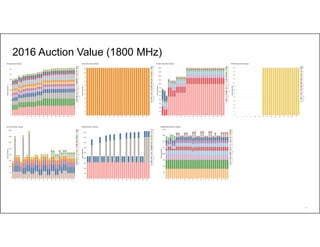
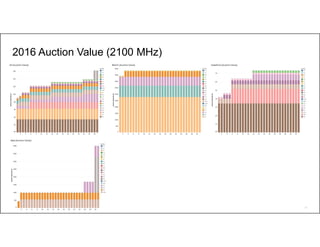
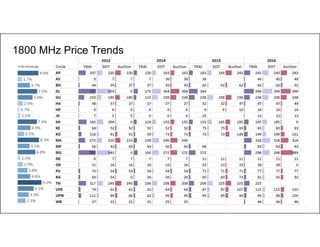
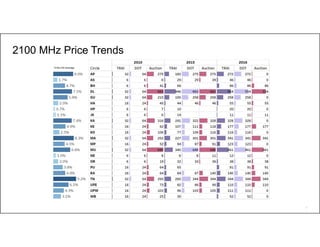
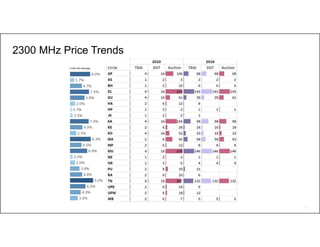
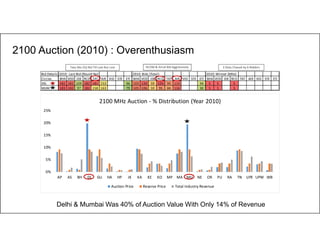
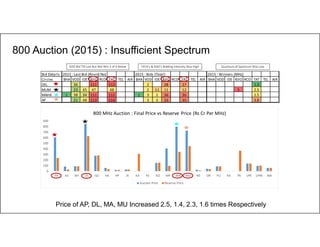
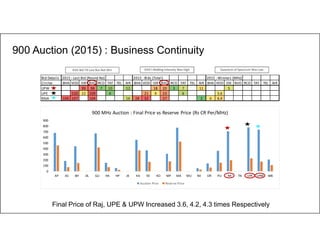
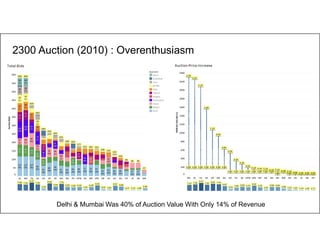
1
Indian Spectrum Auctions:
The Need for a New Model to Calculate
Reserve Price
(Revised Version)
Parag Kar
2
Outline
• Auction : Past Experiences
• High Spectrum Price : Implications
• New Pricing Model : The Need
• The Pricing Model : Overview
• Conclusion
3
Auctions: Past Experiences
4
700 MHz
800 MHz
900 MHz
1800 MHz
2100 MHz
2300 MHz
2500 MHz
0
2
4
6
8
10
12
2010 2012 2013 2014 2015 2016
ThousandsRsCr
Band Price Intensity Per MHz
Spectrum Pricing: Trends
Spectrum Prices Have Increased At Different Rates
Note :Band & Circle Prices divided by circle rev weights &
then averaged to calculate Pan – India spectrum Prices
Business Continuity
Insufficient Spectrum
Calculation Error
Business Continuity
Overenthusiasm
5
2100 Auction (2010) : Overenthusiasm
Delhi & Mumbai Was 40% of Auction Value With Only 14% of Revenue
% Rev Dis (2010) % Rev Dis (2010)
Operators bid
intensely but lost (L)
and contributed to
price increase
Price at the
start of auction
Price at the
end of auction
6
900 Auction (2015) : Business Continuity
Final Price of Raj, UPE & UPW Increased 3.6, 4.2, 4.3 times Respectively
% Rev Dis (2015) % Rev Dis (2015)
Operators bid
intensely but lost (L)
and contributed to
price increase
Price at the
end of auction
Price at the
start of auction
7
800 Auction (2015) : Insufficient Spectrum
Price of AP, DL, MA, MU Increased 2.5, 1.4, 2.3, 1.6 times Respectively
% Rev Dis (2015) % Rev Dis (2015)
Operators bid
intensely but lost (L)
and contributed to
price increase
Price at the
start of auction
Price at the
end of auction
8
TRAI Recommended 700 as 4 times of 1800 Instead of 2 times
Table 3.5 Auction prices in European countries (Euro/MHz/pop)
Euro/MHz/pop Date of auction 800 MHz 1800 MHz Ratio (800/1800)
France Dec-11 0.5809
Germany May-10 0.6217 0.0218 28.52
Italy Sep-11 0.6993 0.2252 3.11
Portugal Dec-11 0.3616 0.2651 1.36
Spain Jul-11 0.4043
Sweden 2011 0.3174 0.1788 1.78
Simple Average 0.4809 0.1727 2.78
Page 104 of TRAI’s Reco 23rd April 2012Table Showing the Calculation Error
Exact Calculation : C = 2.78
Removing Germany : C = 2.12
TRAI’s Calculation : C = 4.00
800 MHz of Europe was linked with 700 MHz of India
A B/ = C
Ratio : Unusually High
700 Auction (2016) : Inadvertent Error
9
Implications : Distorted Prices
Auction Prices Lacks Synergies Across Bands
900 MHz 800 MHz
1800 MHz 2100 MHz
2100 MHz1800 MHz
2100 MHz2300 MHz
Price are in Rs Cr/MHz
10
Implications : Distorted Prices
Auction Prices Lacks Synergies Across Circles
% Rev Dis Average
900 MHz (2015)
Cat B circles
with price > Cat A
Price are in Rs Cr/MHz
Cat A circles
Price < Cat B
11
Implications : Dissimilar Prices
800MHz900MHz
Similar Bands Priced Dissimilarly
TP : TRAI Price ; DP : DOT Price; FP : Final Price
Similar Band
Different Prices
Price are in Rs Cr/MHz
12
Implications : Dissimilar Prices
1800MHz2100MHz
Similar Bands Priced Dissimilarly
TP : TRAI Price ; DP : DOT Price; FP : Final PricePrice are in Rs Cr/MHz
13
Auction Prices Needed to be Curated Across Bands & Circles
 Reserve prices have increased multiple time
 Not all circles & bands are equally impacted
 700 & 900 have seen the highest increase
 800, 1800 MHz is moderately impacted
 2100 MHz slightly impacted
 2300, 2500 MHz is least impacted
Note :Prices Adjusted by inflation index and band weights
RP
Increase
Year Band AP AS BH DL GU HA HP JK KA KE KO MP MA MU NE OR PU RA TN UPE UPW WB
2010 2100 3.32 4.11 3.32 3.32 3.32 3.32 4.58 5.63 3.32 3.32 3.32 3.32 3.32 3.32 4.03 3.32 3.32 3.32 3.32 3.32 3.32 5.52
2010 2300 1.00 1.24 1.00 1.00 1.00 1.00 1.38 1.70 1.00 1.00 1.00 1.00 1.00 1.00 1.21 1.00 1.00 1.00 1.00 1.00 1.00 1.66
2010 2500 1.10 1.37 1.10 1.10 1.10 1.10 1.52 1.87 1.10 1.10 1.10 1.10 1.10 1.10 1.34 1.10 1.10 1.10 1.10 1.10 1.10 1.84
2012 800 5.61 2.24 8.87 13.56 4.40 2.43 2.24 2.24 6.46 3.41 5.93 2.82 5.14 13.27 2.24 4.23 3.51 3.50 5.99 3.97 5.60 2.24
2012 1800 8.90 3.56 14.07 21.50 6.98 3.85 3.55 3.56 10.24 5.40 9.41 4.47 8.15 21.05 3.55 6.71 5.57 5.55 9.50 6.30 8.89 3.55
2013 800 2.51 1.00 3.96 6.05 1.96 1.08 1.00 1.00 2.88 1.52 2.65 1.26 2.30 5.93 1.00 1.89 1.57 NA 2.67 1.77 2.50 1.00
2014 900 NA NA NA 6.00 NA NA NA NA NA NA 5.56 NA NA 5.47 NA NA NA NA NA NA NA NA
2014 1800 5.26 2.99 12.74 7.07 4.61 2.32 2.85 2.92 5.00 4.47 6.28 3.70 5.58 6.68 2.92 5.51 4.65 2.24 6.71 5.25 5.34 3.00
2015 800 3.47 5.49 13.44 9.15 4.08 1.50 4.14 7.52 4.49 NA 5.81 3.60 5.03 6.51 2.11 6.01 3.36 NA 5.34 5.30 3.76 3.75
2015 900 7.25 15.44 24.92 NA 6.69 3.20 6.27 NA 5.84 7.07 NA 7.37 8.29 NA 5.93 11.28 6.36 8.29 NA 9.60 7.16 7.77
2015 1800 5.17 NA 20.22 NA 7.28 2.61 4.05 NA 5.66 6.11 5.95 NA NA NA 4.35 7.50 5.79 4.89 6.88 7.91 7.74 NA
2015 2100 9.38 13.08 NA 22.62 8.80 4.18 NA NA 10.98 10.10 9.91 7.91 10.27 22.14 3.53 12.01 NA 7.91 11.73 7.82 9.37 NA
2016 700 11.84 25.47 32.26 19.45 11.61 6.05 11.48 11.48 9.02 10.86 19.38 10.76 15.51 14.54 6.95 19.77 10.02 11.84 10.98 14.93 12.49 9.89
2016 800 8.50 NA 20.34 11.89 4.00 2.13 4.95 NA 4.25 9.08 5.98 15.25 11.20 10.19 NA 8.52 4.45 7.63 5.05 8.19 6.80 5.10
2016 900 NA NA 71.84 NA 10.21 6.11 NA NA 8.46 NA NA NA NA NA NA NA NA NA NA 31.39 29.89 NA
2016 1800 7.14 15.53 19.43 11.72 6.99 3.68 6.91 6.91 5.43 6.50 11.67 6.50 9.34 8.75 4.18 11.91 6.03 7.13 6.61 9.01 7.52 5.99
2016 2100 8.92 19.93 30.07 18.16 8.46 4.81 9.64 6.53 10.75 15.47 10.14 10.75 11.18 15.11 5.09 13.29 7.95 12.24 11.28 9.61 9.70 7.56
2016 2300 5.37 2.09 5.06 11.30 3.08 1.69 1.16 1.43 7.74 3.37 6.95 1.69 4.58 11.53 1.02 3.37 4.42 1.26 10.43 1.90 2.53 1.75
2016 2500 5.93 2.31 5.58 12.47 3.40 1.86 1.28 1.58 8.55 3.72 7.68 1.86 5.06 12.74 1.13 3.72 4.89 1.40 11.52 2.09 2.79 1.93
Adjusted "Reserve Prices" @ Multiple of the "Minimum"
Implications : Increasing Reserve Price
14
Implications: Unsold Spectrum
Most Spectrum Remained Unsold Due to High Reserve Price
Year Band On Sale Sold % UnSold
2100 355 355 0%
2300 880 880 0%
Total 1235 1235 0%
800 95 0 100%
1800 295 128 57%
Total 390 128 67%
800 95 30 68%
1800 58 0 100%
Total 153 30 80%
900 46 46 0%
1800 385 307 20%
Total 431 353 18%
800 108 86 20%
900 178 168 6%
1800 99 94 5%
2100 85 70 18%
Total 470 418 11%
700 770 0 100%
800 71 15 79%
900 9 0 100%
1800 220 174 21%
2100 360 85 76%
2300 320 320 0%
2500 600 370 38%
Total 2350 964 59%
5029 3128 38%Grand Total
2010
2012
2013
2014
2015
2016
Unit Except % are in MHz
15
Year Band AP AS BH DL GU HA HP JK KA KE KO MP MA MU NE OR PU RA TN UPE UPW WB
2010 2100 4.30 1.50 6.83 10.38 3.38 1.88 1.33 1.17 4.94 2.63 4.54 2.17 3.94 10.16 1.50 3.33 2.71 2.71 4.58 3.04 4.29 1.04
2010 2300 6.63 2.00 5.00 14.06 3.88 2.00 1.50 1.50 9.69 4.33 8.83 2.17 5.75 14.38 1.50 3.50 5.67 1.67 12.94 2.50 3.17 1.33
2010 2500 6.63 2.00 5.00 14.06 3.88 2.00 1.50 1.50 9.69 4.33 8.83 2.17 5.75 14.38 1.50 3.50 5.67 1.67 12.94 2.50 3.17 1.33
2012 800 NoBid NoBid NoBid NoBid NoBid NoBid NoBid NoBid NoBid NoBid NoBid NoBid NoBid NoBid NoBid NoBid NoBid NoBid NoBid NoBid NoBid NoBid
2012 1800 1.00 1.00 1.09 NoBid 1.00 1.00 1.00 1.00 NoBid 1.00 1.00 1.00 1.00 NoBid 1.00 1.00 1.00 NoBid 1.00 1.00 1.00 1.00
2013 800 NoBid NoBid NoBid 1.00 1.00 NoBid NoBid NoBid 1.00 1.00 1.00 NoBid NoBid NoBid NoBid NoBid NoBid NA 1.00 NoBid 1.00 1.00
2014 900 NA NA NA 2.06 NA NA NA NA NA NA 1.56 NA NA 1.72 NA NA NA NA NA NA NA NA
2014 1800 1.00 5.29 1.19 1.66 1.66 1.04 1.17 1.40 1.00 1.00 1.00 1.19 1.68 1.31 1.14 1.00 1.02 1.00 1.00 1.07 1.53 1.19
2015 800 2.55 2.86 0.99 1.35 0.99 1.46 1.00 1.00 NoBid NA 0.98 4.40 2.32 1.63 2.17 1.08 0.99 NA NoBid 0.98 0.98 0.98
2015 900 1.48 2.50 3.01 NA 1.59 2.00 2.15 NA 1.51 2.20 NA 1.77 1.47 NA 1.79 2.07 2.39 3.60 NA 3.40 4.35 1.87
2015 1800 1.44 NA NoBid NA 1.00 1.47 1.78 NA 1.00 1.12 2.05 NA NA NA 1.00 1.48 1.00 1.22 1.00 1.10 1.01 NA
2015 2100 NoBid 1.34 NA NoBid 1.00 1.00 NA NA 1.02 1.06 1.06 1.06 1.00 NoBid 1.50 1.12 NA 1.61 1.00 1.06 1.03 NA
2016 700 NoBid NoBid NoBid NoBid NoBid NoBid NoBid NoBid NoBid NoBid NoBid NoBid NoBid NoBid NoBid NoBid NoBid NoBid NoBid NoBid NoBid NoBid
2016 800 NoBid NA NoBid NoBid 1.2 NoBid NoBid NA NoBid NoBid NoBid NoBid NoBid NoBid NA NoBid 1.2 1.1 NoBid 1.0 NoBid NoBid
2016 900 NA NA NoBid NA NoBid NoBid NA NA NoBid NA NA NA NA NA NA NA NA NA NA NoBid NoBid NA
2016 1800 1.0 1.0 1.0 1.0 1.0 1.1 1.0 1.0 NoBid 1.0 1.0 1.0 1.0 1.6 1.0 NoBid 1.0 1.0 NoBid 1.2 1.1 1.0
2016 2100 NoBid NoBid 1.0 1.0 NoBid 1.0 NoBid 1.0 NoBid 1.0 NoBid NoBid 1.0 1.0 NoBid 1.0 1.0 1.0 1.0 1.0 NoBid NoBid
2016 2300 1.0 1.0 1.1 1.0 1.6 NoBid 1.0 NoBid 1.0 1.1 1.0 1.1 1.1 1.0 1.0 1.0 NoBid NoBid 1.0 NoBid NoBid 1.0
2016 2500 1.0 1.0 1.0 1.0 1.0 1.0 1.0 1.0 NoBid 1.0 1.0 1.0 1.0 1.0 1.0 1.0 1.0 1.0 NoBid 1.0 1.0 1.0
Implications : Decreased Auction Intensity
Most Circles Not taken or Cleared at Reserve Price
Auction Prices /Reserve Price
16
High Spectrum Price: Implications
17
1 1
7
17 21 21 21 21 21 21 21 21 21 21 21 21 20 20 14
4
6
4
17 16
23
14 12 15
50
2 2 11
3
1 3
8
13
17
17 20
20
20
22
22
24 30 29
27
14
16
17 18
20
22 24
20
23
24
25 27
29
30
32
34
36
38
41
43
46
48
51
54
58
0.00 %
10.00 %
20.00 %
30.00 %
40.00 %
50.00 %
60.00 %
70.00 %
80.00 %
90.00 %
100.00 %
0
20
40
60
80
100
120
140
160
2010 2011 2012 2013 2014 2015 2016 2017 2018 2019 2020 2021 2022 2023 2024 2025 2026 2027 2028 2029 2030 2031 2032 2033 2034
RsThousandsCR
TotalIndustryYearlyOutflow
Total Auction Upfront Total Auction Deferred Total Future Renewal Upfront
Total Future Renewal Deferred Total License Fees Total Outflow % of AGR
Industry Will Unable to Buy New Spectrum Even at Improved Assumptions
Impact : Increased Industry Outflows
Future Revenue Increase : 6%
No New Spectrum Considered
Includes Only Cost of Expired Spectrum
900 MHz Price Aligned with 800
Future Spectrum Price Increase : 2%
IMG Rate : 16 years and 8%
Industry Outflows As % of Revenues = 27% on Average
18
• Indian operators have 20 MHz spectrum
less than global average
• India will need additional 100 MHz
spectrum (assuming 5 players)
• Indian industry already spend total Rs. 3.5
lakh Cr (approx.) to acquire 31 MHz
• Indian industry have to spend additionally
Rs. 13.6 Lakh Cr (at reserve price)
Impact : Reduce Service Flexibility
Consumers Will Experience Reduced Broadband Speeds
19
New Pricing Model: The Need
20
• Value of spectrum not proportional with market realties
• No correlation of value amongst different bands in same circle
• No band-wise correlation amongst various circles
% Auction Price
% Revenue Distribution
Legend
To Correct Pricing Distortions
No Correlation of Auction Prices with Circle Revenue Potential
21
To Contain Unnatural Increase
Reserve Price has increased significantly over the years
22
To Contain Unnatural Increase
Reserve Price has increased significantly over the years
23
India vs USA – High Spectrum Price in India
Parameters USA India
Band 600 MHz 800/1800/2100/2300/2500 MHz 700 MHz**
MHz 70 56 70
Bid (USD Bn) 19.77 10.17 61.84
Price/MHz (USD Bn) 0.28 0.18 0.88
ARPU Multiple (x) 15 15
Price Multiple (x) 0.6 3
Price Multiple adjusted for
ARPU (x) 9 46
*Data as of 3Q16; ** Reserve Price has been taken for the calculation
Source: Global Wireless Matrix – Bank of America – Merill Lynch, 3Q16, FCC and DoT
Indicators USA India
Subscribers
Million*
377 997
ARPU*
USD/month
39.9 2.7
• 4 times more subscribers
• 14 times lower ARPU
• Spectrum auctions held almost during
the same period
• For 14 times lower ARPU (return) in
India as compared to The USA:
- India paid 9 times the price for
spectrum when compared to all
spectrum sold in India.
- India paid 46 times the price for
spectrum when compared to 700
MHz band.
To Align With International Prices
India auction price was effectively 9 times more than the US auction price
24
The Pricing Model : Overview
25
The Model : Basic Principle
• Input to the pricing model should be unambiguous
• Ambiguous inputs is hard to quantify administratively
• Unambiguous inputs will make the process robust
• Unambiguous inputs will remove element of discretion
• Input to the pricing model should act as feedback
• Feedback will prevent distortions percolating in future auctions
• Feedback will promote responsible bidding
• Input to the pricing model should be integrative
• Integrative model will prevent distortion across bands
• Integrative model will prevent distortion across circles
In Nutshell, the model should promote transparency, consistency and predictability
26
Step 1 : Readjust Past Auction Prices with Cost Inflation Numbers
Step 2 : Readjust Past Auction Prices with Band Index Numbers
Step 3: Calculate Average Price Across Circles for all Auction & Years
Step 4: Add these Averages to Arrive at a Single “Pan India” Number
Step 5: Multiple above with Revenue Weights to arrive at circle values
Step 6: Readjust Above for Individual Bands with Band Index Numbers
Step 7: Reduce the Number Above by 50% to Arrive at Reserve Price
Prices will get automatically curated for distortions
Input 1
Input 2
Past Auction Prices for
all Circles & Years
Input 3
Input 4
Calculation Model
LSA AP AS BH DL GU HA HP JK KA KE KO
Rev % 8.0% 1.7% 4.7% 7.5% 5.8% 2.0% 0.7% 1.1% 7.4% 4.9% 2.5%
LSA MA MP MU NE OR PU RA TN UPE UPW WB
Rev % 8.3% 4.5% 6.8% 1.0% 2.0% 3.8% 4.8% 9.2% 6.1% 4.3% 3.1%
Total Industry Revenue % Distribution
The Model : Calculating Reserve Price
Year Factor
2010 1.00
2011 1.10
2012 1.20
2013 1.32
2014 1.44
2015 1.52
2016 1.58
2017 1.63
Price Index (2010 As Reference)
Band Weights
700 1.15
800 1.00
900 0.92
1800 0.48
2100 0.43
2300 0.35
2500 0.32
3500 0.24
Band Index (800 MHz As Reference)
27
Reserve Prices : Calculated With New Model
Prices will get automatically curated across bands
Existing Prices
New Prices
Make Reserve Prices Rationale
 Low for low revenue circles
 Low for higher spectrum bands
Motivate Responsible Bidding
 Prices will get automatically corrected
 Irrational bidders will be penalized
Improve Auction Design
 Penalize irresponsible behavior
 Reward responsible behavior
Band AP/RP (Rs Cr) New RP (Rs Cr) % Change Type
700 MHz 11485 4141 -64% Decrease
800 MHz 6104 3603 -41% Decrease
900 MHz 8683 3329 -62% Decrease
1800 MHz 3400 1719 -49% Decrease
2100 MHz 4047 1541 -62% Decrease
2300 MHz 1693 1279 -24% Decrease
2500 MHz 1634 1158 -29% Decrease
3500 MHz 871
New Reserve Price vs Old Price (50% Discount)
28
Reserve Prices : Calculated With New Model
Prices will get automatically curated for distortions across circles
Average % Rev Dis
Band AP AS BH DL GU HA HP JK KA KE KO MP MA MU NE OR PU RA TN UPE UPW WB Total
700 333 70 194 309 239 81 30 44 308 203 102 188 342 281 42 81 156 199 380 253 178 128 4141
800 290 60 169 269 208 71 26 39 268 176 89 163 298 245 37 71 136 173 331 220 155 111 3603
900 268 56 156 249 192 65 24 36 248 163 82 151 275 226 34 65 126 160 306 203 143 103 3329
1800 138 29 81 128 99 34 13 18 128 84 42 78 142 117 17 34 65 83 158 105 74 53 1719
2100 124 26 72 115 89 30 11 17 115 75 38 70 127 105 16 30 58 74 141 94 66 47 1541
2300 103 21 60 96 74 25 9 14 95 63 32 58 106 87 13 25 48 61 117 78 55 39 1279
2500 93 19 54 87 67 23 8 12 86 57 29 53 96 79 12 23 44 56 106 71 50 36 1158
3500 70 15 41 65 50 17 6 9 65 43 22 40 72 59 9 17 33 42 80 53 37 27 871
Calculated "Reserve Price" (Rs Cr) (50% discount on Model Price)
29
Conclusion
30
The New Model Will
• Prevent bidding distortion percolating into future auctions
• Prevent irresponsible bidding by penalizing speculative actions
• Prevent volatility in auction prices and make it more predictable
• Prevent moral hazard resulting out of drastic corrections in prices
• Prevent undue competitive advantage to a few players
• Prevent randomness of auction prices across bands and circles
• Prevent accusation by audit agencies on bureaucratic actions
31
Thank You
32
Back Up
33
2010 Bidding Matrix (2100 MHz)
Bidding was intense in the later
rounds due to the auction “closing
rules” which mandated bidders to
bid to be sure of making a win
34
2010 Bidding Matrix (2300 MHz)
RJIO bid all circles in the 1st round
and more intensely than others
5 players (Bharti, Qualcomm,
Aircel, Tikona, RJIO)
remaining in the fray till the
last minute chasing two slots
1 2
3 4 5
35
2012 Bidding Matrix (1800 MHz)
• Bharti bid only 1.25 MHz in Assam
• Bidding closed in 1st round in most
circles except Bihar, UPW and WB
36
2014 Bidding Matrix (900 MHz)
• Bidding closed for Mumbai &
Delhi in 1st few rounds
• Idea snatched 5 MHz in Delhi
from Bharti & Vodafone
• RJIO bid only in the initial few rounds
that too for Delhi & Mumbai
• Tata bid only in the initial few rounds
that too for Kolkata and Mumbai
37
2014 Bidding Matrix (1800 MHz)
• Competition was between 5 players
1 2 3
4 5
38
2015 Bidding Matrix (800 MHz)
• Vodafone & RCOM fought for NE & Assam
• Bharti got out in the initial rounds
• Idea focused on MP and also bid for NE and Assam
• RJIO & Tata were in tussle for AP,
Delhi, and Maharashtra
39
2015 Bidding Matrix (900 MHz)
• Bharti, Vodafone & Idea were direct conflict with RJIO in the last rounds
• Bidding for most others circles got over in the initial rounds
40
2015 Bidding Matrix (1800 MHz)
• Bidding was less intense
• Bidders focused their bids
selectively
41
2015 Bidding Matrix (2100 MHz)
• Bharti took selected circles
• Tussle was between Idea & Vodafone
42
2016 Bidding Matrix (800 MHz)
• Tussle was between RJIO and Idea
43
2016 Bidding Matrix (1800 MHz)
1 2 3
4 5
• Competition was between 5 players
• Tata bid AP, Maharashtra and Mumbai
• Mumbai saw demand from RJIO, Tata and
Idea
• UPE saw a tussle between RJIO & Vodafone
44
2016 Bidding Matrix (2100 MHz)
• Only 3 players seeking spectrum
• Auction got over in the initial rounds
45
2016 Bidding Matrix (2300 MHz)
• Only 3 players were seeking spectrum,
except RCOM who bid only Gujarat
46
2016 Bidding Matrix (2500 MHz)
• Only 2 players were seeking spectrum
47
2010 Spectrum Matrix
All spectrum got sold
48
2012 Spectrum Matrix
Unsold spectrum
Offered spectrum
49
2013 Spectrum Matrix
Unsold spectrum
Offered spectrum
50
2014 Spectrum Matrix Unsold spectrum
Offered spectrum
51
2015 Spectrum Matrix
Unsold spectrum
Offered spectrum
52
2016 Spectrum Matrix
Unsold spectrumOffered spectrum
53
2010 Auction Value (2100 MHz)
Increased Intensity of Auction in the later rounds due to 2 reasons
a) Too much demand for Delhi and Mumbai, and Cat A circles
b) Auction closing rules required continuous bidding to ensure a win
54
2010 Auction Value (2300 MHz) -1
55
2010 Auction Value (2300 MHz) -2
56
2012 Auction Value (1800 MHz)
57
2014 Auction Value (900 MHz)
RJIO and Tata
exited the auction
after few rounds
58
2014 Auction Value (1800 MHz)
59
2015 Auction Value (800 MHz)
RJIO could not out bid Tata as the latter
was bidding in chunks of 1.25 MHz
60
2015 Auction Value (900 MHz)
RJIO’s late entry into the fray raised the price for Bharti and Vodafone
61
2015 Auction Value (1800 MHz)
62
2015 Auction Value (2100 MHz)
63
2016 Auction Value (800 MHz)
64
2016 Auction Value (1800 MHz)
65
2016 Auction Value (2100 MHz)
66
2016 Auction Value (2300 MHz)
67
2016 Auction Value (2500 MHz)
68
800 MHz Price Trends
% Rev Dis Average
69
70
900 MHz Price Trends
% Rev Dis Average
71
1800 MHz Price Trends
% Rev Dis Average
72
2100 MHz Price Trends
% Rev Dis Average
73
2300 MHz Price Trends
% Rev Dis Average
74
Delhi & Mumbai Was 40% of Auction Value With Only 14% of Revenue
Bid Details 2010 : Last Bid (Round No) 2010: Bids (Total) 2010: Winner (MHz)
Circles BHA VOD IDE RCO TAT AIR VID STE ETI BHA VOD IDE RCO TAT AIR VID STE ETI BHA VOD IDE RCO TAT AIR VID STE ETI
DEL 182 181 109 182 181 153 96 103 120 59 125 95 113 34 5 5 5
MUM 183 182 97 182 158 163 79 105 106 59 95 84 116 30 5 5 5
0%
5%
10%
15%
20%
25%
AP AS BH DL GU HA HP JK KA KE KO MP MA MU NE OR PU RA TN UPE UPW WB
2100 MHz Auction - % Distribution (Year 2010)
Auction Price Reserve Price Total Industry Revenue
3 Slots Chased by 6 BiddersTata (No 2G) Bid Till Last But Lost RCOM & Aircel Bid Aggressively
2100 Auction (2010) : Overenthusiasm
75
Price of AP, DL, MA, MU Increased 2.5, 1.4, 2.3, 1.6 times Respectively
0
100
200
300
400
500
600
700
800
900
AP AS BH DL GU HA HP JK KA KE KO MP MA MU NE OR PU RA TN UPE UPW WB
800 MHz Auction : Final Price vs Reserve Price (Rs Cr Per MHz)
Auction Price Reserve Price
Bid Details 2015 : Last Bid (Round No) 2015 : Bids (Total) 2015 : Winners (MHz)
Circles BHA VOD IDE RJIO RCO TAT TEL AIR BHA VOD IDE RJIO RCO TAT TEL AIR BHA VOD IDE RJIO RCO TAT TEL AIR
DEL 36 111 112 2 28 27 1.3
MUM 23 45 47 48 2 11 11 12 5 2.5
MAHA 1 38 34 111 112 1 3 2 36 36 2.5
AP 21 48 113 114 3 3 33 35 3.8
RJIO Bid Till Last But Not Win 3 of 4 Below TATA’s & RJIO’s Bidding Intensity Was High Quantum of Spectrum Was Low
800 Auction (2015) : Insufficient Spectrum
76
Final Price of Raj, UPE & UPW Increased 3.6, 4.2, 4.3 times Respectively
Bid Details 2015 : Last Bid (Round No) 2015 : Bids (Total) 2015 : Winners (MHz)
Circles BHA VOD IDE RJIO RCO TAT TEL AIR BHA VOD IDE RJIO RCO TAT TEL AIR BHA VOD IDE RJIO RCO TAT TEL AIR
UPW 99 98 7 10 12 18 20 3 7 11 5
UPE 110 22 109 6 21 9 23 6 5.6
RAJA 106 107 104 16 28 32 27 2 6 6.4
0
100
200
300
400
500
600
700
800
900
AP AS BH DL GU HA HP JK KA KE KO MP MA MU NE OR PU RA TN UPE UPW WB
900 MHz Auction : Final Price vs Reserve Price (Rs CR Per/MHz)
Auction Price Reserve Price
RJIO Bid Till Last But Not Win RJIO’s Bidding Intensity Was High Quantum of Spectrum Was Low
900 Auction (2015) : Business Continuity
77
2300 Auction (2010) : Overenthusiasm
Delhi & Mumbai Was 40% of Auction Value With Only 14% of Revenue

Indian Spectrum Auctions : Design Issues & Way Forward

  • 1.
    1 Indian Spectrum Auctions: TheNeed for a New Model to Calculate Reserve Price (Revised Version) Parag Kar
  • 2.
    2 Outline • Auction :Past Experiences • High Spectrum Price : Implications • New Pricing Model : The Need • The Pricing Model : Overview • Conclusion
  • 3.
  • 4.
    4 700 MHz 800 MHz 900MHz 1800 MHz 2100 MHz 2300 MHz 2500 MHz 0 2 4 6 8 10 12 2010 2012 2013 2014 2015 2016 ThousandsRsCr Band Price Intensity Per MHz Spectrum Pricing: Trends Spectrum Prices Have Increased At Different Rates Note :Band & Circle Prices divided by circle rev weights & then averaged to calculate Pan – India spectrum Prices Business Continuity Insufficient Spectrum Calculation Error Business Continuity Overenthusiasm
  • 5.
    5 2100 Auction (2010): Overenthusiasm Delhi & Mumbai Was 40% of Auction Value With Only 14% of Revenue % Rev Dis (2010) % Rev Dis (2010) Operators bid intensely but lost (L) and contributed to price increase Price at the start of auction Price at the end of auction
  • 6.
    6 900 Auction (2015): Business Continuity Final Price of Raj, UPE & UPW Increased 3.6, 4.2, 4.3 times Respectively % Rev Dis (2015) % Rev Dis (2015) Operators bid intensely but lost (L) and contributed to price increase Price at the end of auction Price at the start of auction
  • 7.
    7 800 Auction (2015): Insufficient Spectrum Price of AP, DL, MA, MU Increased 2.5, 1.4, 2.3, 1.6 times Respectively % Rev Dis (2015) % Rev Dis (2015) Operators bid intensely but lost (L) and contributed to price increase Price at the start of auction Price at the end of auction
  • 8.
    8 TRAI Recommended 700as 4 times of 1800 Instead of 2 times Table 3.5 Auction prices in European countries (Euro/MHz/pop) Euro/MHz/pop Date of auction 800 MHz 1800 MHz Ratio (800/1800) France Dec-11 0.5809 Germany May-10 0.6217 0.0218 28.52 Italy Sep-11 0.6993 0.2252 3.11 Portugal Dec-11 0.3616 0.2651 1.36 Spain Jul-11 0.4043 Sweden 2011 0.3174 0.1788 1.78 Simple Average 0.4809 0.1727 2.78 Page 104 of TRAI’s Reco 23rd April 2012Table Showing the Calculation Error Exact Calculation : C = 2.78 Removing Germany : C = 2.12 TRAI’s Calculation : C = 4.00 800 MHz of Europe was linked with 700 MHz of India A B/ = C Ratio : Unusually High 700 Auction (2016) : Inadvertent Error
  • 9.
    9 Implications : DistortedPrices Auction Prices Lacks Synergies Across Bands 900 MHz 800 MHz 1800 MHz 2100 MHz 2100 MHz1800 MHz 2100 MHz2300 MHz Price are in Rs Cr/MHz
  • 10.
    10 Implications : DistortedPrices Auction Prices Lacks Synergies Across Circles % Rev Dis Average 900 MHz (2015) Cat B circles with price > Cat A Price are in Rs Cr/MHz Cat A circles Price < Cat B
  • 11.
    11 Implications : DissimilarPrices 800MHz900MHz Similar Bands Priced Dissimilarly TP : TRAI Price ; DP : DOT Price; FP : Final Price Similar Band Different Prices Price are in Rs Cr/MHz
  • 12.
    12 Implications : DissimilarPrices 1800MHz2100MHz Similar Bands Priced Dissimilarly TP : TRAI Price ; DP : DOT Price; FP : Final PricePrice are in Rs Cr/MHz
  • 13.
    13 Auction Prices Neededto be Curated Across Bands & Circles  Reserve prices have increased multiple time  Not all circles & bands are equally impacted  700 & 900 have seen the highest increase  800, 1800 MHz is moderately impacted  2100 MHz slightly impacted  2300, 2500 MHz is least impacted Note :Prices Adjusted by inflation index and band weights RP Increase Year Band AP AS BH DL GU HA HP JK KA KE KO MP MA MU NE OR PU RA TN UPE UPW WB 2010 2100 3.32 4.11 3.32 3.32 3.32 3.32 4.58 5.63 3.32 3.32 3.32 3.32 3.32 3.32 4.03 3.32 3.32 3.32 3.32 3.32 3.32 5.52 2010 2300 1.00 1.24 1.00 1.00 1.00 1.00 1.38 1.70 1.00 1.00 1.00 1.00 1.00 1.00 1.21 1.00 1.00 1.00 1.00 1.00 1.00 1.66 2010 2500 1.10 1.37 1.10 1.10 1.10 1.10 1.52 1.87 1.10 1.10 1.10 1.10 1.10 1.10 1.34 1.10 1.10 1.10 1.10 1.10 1.10 1.84 2012 800 5.61 2.24 8.87 13.56 4.40 2.43 2.24 2.24 6.46 3.41 5.93 2.82 5.14 13.27 2.24 4.23 3.51 3.50 5.99 3.97 5.60 2.24 2012 1800 8.90 3.56 14.07 21.50 6.98 3.85 3.55 3.56 10.24 5.40 9.41 4.47 8.15 21.05 3.55 6.71 5.57 5.55 9.50 6.30 8.89 3.55 2013 800 2.51 1.00 3.96 6.05 1.96 1.08 1.00 1.00 2.88 1.52 2.65 1.26 2.30 5.93 1.00 1.89 1.57 NA 2.67 1.77 2.50 1.00 2014 900 NA NA NA 6.00 NA NA NA NA NA NA 5.56 NA NA 5.47 NA NA NA NA NA NA NA NA 2014 1800 5.26 2.99 12.74 7.07 4.61 2.32 2.85 2.92 5.00 4.47 6.28 3.70 5.58 6.68 2.92 5.51 4.65 2.24 6.71 5.25 5.34 3.00 2015 800 3.47 5.49 13.44 9.15 4.08 1.50 4.14 7.52 4.49 NA 5.81 3.60 5.03 6.51 2.11 6.01 3.36 NA 5.34 5.30 3.76 3.75 2015 900 7.25 15.44 24.92 NA 6.69 3.20 6.27 NA 5.84 7.07 NA 7.37 8.29 NA 5.93 11.28 6.36 8.29 NA 9.60 7.16 7.77 2015 1800 5.17 NA 20.22 NA 7.28 2.61 4.05 NA 5.66 6.11 5.95 NA NA NA 4.35 7.50 5.79 4.89 6.88 7.91 7.74 NA 2015 2100 9.38 13.08 NA 22.62 8.80 4.18 NA NA 10.98 10.10 9.91 7.91 10.27 22.14 3.53 12.01 NA 7.91 11.73 7.82 9.37 NA 2016 700 11.84 25.47 32.26 19.45 11.61 6.05 11.48 11.48 9.02 10.86 19.38 10.76 15.51 14.54 6.95 19.77 10.02 11.84 10.98 14.93 12.49 9.89 2016 800 8.50 NA 20.34 11.89 4.00 2.13 4.95 NA 4.25 9.08 5.98 15.25 11.20 10.19 NA 8.52 4.45 7.63 5.05 8.19 6.80 5.10 2016 900 NA NA 71.84 NA 10.21 6.11 NA NA 8.46 NA NA NA NA NA NA NA NA NA NA 31.39 29.89 NA 2016 1800 7.14 15.53 19.43 11.72 6.99 3.68 6.91 6.91 5.43 6.50 11.67 6.50 9.34 8.75 4.18 11.91 6.03 7.13 6.61 9.01 7.52 5.99 2016 2100 8.92 19.93 30.07 18.16 8.46 4.81 9.64 6.53 10.75 15.47 10.14 10.75 11.18 15.11 5.09 13.29 7.95 12.24 11.28 9.61 9.70 7.56 2016 2300 5.37 2.09 5.06 11.30 3.08 1.69 1.16 1.43 7.74 3.37 6.95 1.69 4.58 11.53 1.02 3.37 4.42 1.26 10.43 1.90 2.53 1.75 2016 2500 5.93 2.31 5.58 12.47 3.40 1.86 1.28 1.58 8.55 3.72 7.68 1.86 5.06 12.74 1.13 3.72 4.89 1.40 11.52 2.09 2.79 1.93 Adjusted "Reserve Prices" @ Multiple of the "Minimum" Implications : Increasing Reserve Price
  • 14.
    14 Implications: Unsold Spectrum MostSpectrum Remained Unsold Due to High Reserve Price Year Band On Sale Sold % UnSold 2100 355 355 0% 2300 880 880 0% Total 1235 1235 0% 800 95 0 100% 1800 295 128 57% Total 390 128 67% 800 95 30 68% 1800 58 0 100% Total 153 30 80% 900 46 46 0% 1800 385 307 20% Total 431 353 18% 800 108 86 20% 900 178 168 6% 1800 99 94 5% 2100 85 70 18% Total 470 418 11% 700 770 0 100% 800 71 15 79% 900 9 0 100% 1800 220 174 21% 2100 360 85 76% 2300 320 320 0% 2500 600 370 38% Total 2350 964 59% 5029 3128 38%Grand Total 2010 2012 2013 2014 2015 2016 Unit Except % are in MHz
  • 15.
    15 Year Band APAS BH DL GU HA HP JK KA KE KO MP MA MU NE OR PU RA TN UPE UPW WB 2010 2100 4.30 1.50 6.83 10.38 3.38 1.88 1.33 1.17 4.94 2.63 4.54 2.17 3.94 10.16 1.50 3.33 2.71 2.71 4.58 3.04 4.29 1.04 2010 2300 6.63 2.00 5.00 14.06 3.88 2.00 1.50 1.50 9.69 4.33 8.83 2.17 5.75 14.38 1.50 3.50 5.67 1.67 12.94 2.50 3.17 1.33 2010 2500 6.63 2.00 5.00 14.06 3.88 2.00 1.50 1.50 9.69 4.33 8.83 2.17 5.75 14.38 1.50 3.50 5.67 1.67 12.94 2.50 3.17 1.33 2012 800 NoBid NoBid NoBid NoBid NoBid NoBid NoBid NoBid NoBid NoBid NoBid NoBid NoBid NoBid NoBid NoBid NoBid NoBid NoBid NoBid NoBid NoBid 2012 1800 1.00 1.00 1.09 NoBid 1.00 1.00 1.00 1.00 NoBid 1.00 1.00 1.00 1.00 NoBid 1.00 1.00 1.00 NoBid 1.00 1.00 1.00 1.00 2013 800 NoBid NoBid NoBid 1.00 1.00 NoBid NoBid NoBid 1.00 1.00 1.00 NoBid NoBid NoBid NoBid NoBid NoBid NA 1.00 NoBid 1.00 1.00 2014 900 NA NA NA 2.06 NA NA NA NA NA NA 1.56 NA NA 1.72 NA NA NA NA NA NA NA NA 2014 1800 1.00 5.29 1.19 1.66 1.66 1.04 1.17 1.40 1.00 1.00 1.00 1.19 1.68 1.31 1.14 1.00 1.02 1.00 1.00 1.07 1.53 1.19 2015 800 2.55 2.86 0.99 1.35 0.99 1.46 1.00 1.00 NoBid NA 0.98 4.40 2.32 1.63 2.17 1.08 0.99 NA NoBid 0.98 0.98 0.98 2015 900 1.48 2.50 3.01 NA 1.59 2.00 2.15 NA 1.51 2.20 NA 1.77 1.47 NA 1.79 2.07 2.39 3.60 NA 3.40 4.35 1.87 2015 1800 1.44 NA NoBid NA 1.00 1.47 1.78 NA 1.00 1.12 2.05 NA NA NA 1.00 1.48 1.00 1.22 1.00 1.10 1.01 NA 2015 2100 NoBid 1.34 NA NoBid 1.00 1.00 NA NA 1.02 1.06 1.06 1.06 1.00 NoBid 1.50 1.12 NA 1.61 1.00 1.06 1.03 NA 2016 700 NoBid NoBid NoBid NoBid NoBid NoBid NoBid NoBid NoBid NoBid NoBid NoBid NoBid NoBid NoBid NoBid NoBid NoBid NoBid NoBid NoBid NoBid 2016 800 NoBid NA NoBid NoBid 1.2 NoBid NoBid NA NoBid NoBid NoBid NoBid NoBid NoBid NA NoBid 1.2 1.1 NoBid 1.0 NoBid NoBid 2016 900 NA NA NoBid NA NoBid NoBid NA NA NoBid NA NA NA NA NA NA NA NA NA NA NoBid NoBid NA 2016 1800 1.0 1.0 1.0 1.0 1.0 1.1 1.0 1.0 NoBid 1.0 1.0 1.0 1.0 1.6 1.0 NoBid 1.0 1.0 NoBid 1.2 1.1 1.0 2016 2100 NoBid NoBid 1.0 1.0 NoBid 1.0 NoBid 1.0 NoBid 1.0 NoBid NoBid 1.0 1.0 NoBid 1.0 1.0 1.0 1.0 1.0 NoBid NoBid 2016 2300 1.0 1.0 1.1 1.0 1.6 NoBid 1.0 NoBid 1.0 1.1 1.0 1.1 1.1 1.0 1.0 1.0 NoBid NoBid 1.0 NoBid NoBid 1.0 2016 2500 1.0 1.0 1.0 1.0 1.0 1.0 1.0 1.0 NoBid 1.0 1.0 1.0 1.0 1.0 1.0 1.0 1.0 1.0 NoBid 1.0 1.0 1.0 Implications : Decreased Auction Intensity Most Circles Not taken or Cleared at Reserve Price Auction Prices /Reserve Price
  • 16.
  • 17.
    17 1 1 7 17 2121 21 21 21 21 21 21 21 21 21 21 20 20 14 4 6 4 17 16 23 14 12 15 50 2 2 11 3 1 3 8 13 17 17 20 20 20 22 22 24 30 29 27 14 16 17 18 20 22 24 20 23 24 25 27 29 30 32 34 36 38 41 43 46 48 51 54 58 0.00 % 10.00 % 20.00 % 30.00 % 40.00 % 50.00 % 60.00 % 70.00 % 80.00 % 90.00 % 100.00 % 0 20 40 60 80 100 120 140 160 2010 2011 2012 2013 2014 2015 2016 2017 2018 2019 2020 2021 2022 2023 2024 2025 2026 2027 2028 2029 2030 2031 2032 2033 2034 RsThousandsCR TotalIndustryYearlyOutflow Total Auction Upfront Total Auction Deferred Total Future Renewal Upfront Total Future Renewal Deferred Total License Fees Total Outflow % of AGR Industry Will Unable to Buy New Spectrum Even at Improved Assumptions Impact : Increased Industry Outflows Future Revenue Increase : 6% No New Spectrum Considered Includes Only Cost of Expired Spectrum 900 MHz Price Aligned with 800 Future Spectrum Price Increase : 2% IMG Rate : 16 years and 8% Industry Outflows As % of Revenues = 27% on Average
  • 18.
    18 • Indian operatorshave 20 MHz spectrum less than global average • India will need additional 100 MHz spectrum (assuming 5 players) • Indian industry already spend total Rs. 3.5 lakh Cr (approx.) to acquire 31 MHz • Indian industry have to spend additionally Rs. 13.6 Lakh Cr (at reserve price) Impact : Reduce Service Flexibility Consumers Will Experience Reduced Broadband Speeds
  • 19.
  • 20.
    20 • Value ofspectrum not proportional with market realties • No correlation of value amongst different bands in same circle • No band-wise correlation amongst various circles % Auction Price % Revenue Distribution Legend To Correct Pricing Distortions No Correlation of Auction Prices with Circle Revenue Potential
  • 21.
    21 To Contain UnnaturalIncrease Reserve Price has increased significantly over the years
  • 22.
    22 To Contain UnnaturalIncrease Reserve Price has increased significantly over the years
  • 23.
    23 India vs USA– High Spectrum Price in India Parameters USA India Band 600 MHz 800/1800/2100/2300/2500 MHz 700 MHz** MHz 70 56 70 Bid (USD Bn) 19.77 10.17 61.84 Price/MHz (USD Bn) 0.28 0.18 0.88 ARPU Multiple (x) 15 15 Price Multiple (x) 0.6 3 Price Multiple adjusted for ARPU (x) 9 46 *Data as of 3Q16; ** Reserve Price has been taken for the calculation Source: Global Wireless Matrix – Bank of America – Merill Lynch, 3Q16, FCC and DoT Indicators USA India Subscribers Million* 377 997 ARPU* USD/month 39.9 2.7 • 4 times more subscribers • 14 times lower ARPU • Spectrum auctions held almost during the same period • For 14 times lower ARPU (return) in India as compared to The USA: - India paid 9 times the price for spectrum when compared to all spectrum sold in India. - India paid 46 times the price for spectrum when compared to 700 MHz band. To Align With International Prices India auction price was effectively 9 times more than the US auction price
  • 24.
  • 25.
    25 The Model :Basic Principle • Input to the pricing model should be unambiguous • Ambiguous inputs is hard to quantify administratively • Unambiguous inputs will make the process robust • Unambiguous inputs will remove element of discretion • Input to the pricing model should act as feedback • Feedback will prevent distortions percolating in future auctions • Feedback will promote responsible bidding • Input to the pricing model should be integrative • Integrative model will prevent distortion across bands • Integrative model will prevent distortion across circles In Nutshell, the model should promote transparency, consistency and predictability
  • 26.
    26 Step 1 :Readjust Past Auction Prices with Cost Inflation Numbers Step 2 : Readjust Past Auction Prices with Band Index Numbers Step 3: Calculate Average Price Across Circles for all Auction & Years Step 4: Add these Averages to Arrive at a Single “Pan India” Number Step 5: Multiple above with Revenue Weights to arrive at circle values Step 6: Readjust Above for Individual Bands with Band Index Numbers Step 7: Reduce the Number Above by 50% to Arrive at Reserve Price Prices will get automatically curated for distortions Input 1 Input 2 Past Auction Prices for all Circles & Years Input 3 Input 4 Calculation Model LSA AP AS BH DL GU HA HP JK KA KE KO Rev % 8.0% 1.7% 4.7% 7.5% 5.8% 2.0% 0.7% 1.1% 7.4% 4.9% 2.5% LSA MA MP MU NE OR PU RA TN UPE UPW WB Rev % 8.3% 4.5% 6.8% 1.0% 2.0% 3.8% 4.8% 9.2% 6.1% 4.3% 3.1% Total Industry Revenue % Distribution The Model : Calculating Reserve Price Year Factor 2010 1.00 2011 1.10 2012 1.20 2013 1.32 2014 1.44 2015 1.52 2016 1.58 2017 1.63 Price Index (2010 As Reference) Band Weights 700 1.15 800 1.00 900 0.92 1800 0.48 2100 0.43 2300 0.35 2500 0.32 3500 0.24 Band Index (800 MHz As Reference)
  • 27.
    27 Reserve Prices :Calculated With New Model Prices will get automatically curated across bands Existing Prices New Prices Make Reserve Prices Rationale  Low for low revenue circles  Low for higher spectrum bands Motivate Responsible Bidding  Prices will get automatically corrected  Irrational bidders will be penalized Improve Auction Design  Penalize irresponsible behavior  Reward responsible behavior Band AP/RP (Rs Cr) New RP (Rs Cr) % Change Type 700 MHz 11485 4141 -64% Decrease 800 MHz 6104 3603 -41% Decrease 900 MHz 8683 3329 -62% Decrease 1800 MHz 3400 1719 -49% Decrease 2100 MHz 4047 1541 -62% Decrease 2300 MHz 1693 1279 -24% Decrease 2500 MHz 1634 1158 -29% Decrease 3500 MHz 871 New Reserve Price vs Old Price (50% Discount)
  • 28.
    28 Reserve Prices :Calculated With New Model Prices will get automatically curated for distortions across circles Average % Rev Dis Band AP AS BH DL GU HA HP JK KA KE KO MP MA MU NE OR PU RA TN UPE UPW WB Total 700 333 70 194 309 239 81 30 44 308 203 102 188 342 281 42 81 156 199 380 253 178 128 4141 800 290 60 169 269 208 71 26 39 268 176 89 163 298 245 37 71 136 173 331 220 155 111 3603 900 268 56 156 249 192 65 24 36 248 163 82 151 275 226 34 65 126 160 306 203 143 103 3329 1800 138 29 81 128 99 34 13 18 128 84 42 78 142 117 17 34 65 83 158 105 74 53 1719 2100 124 26 72 115 89 30 11 17 115 75 38 70 127 105 16 30 58 74 141 94 66 47 1541 2300 103 21 60 96 74 25 9 14 95 63 32 58 106 87 13 25 48 61 117 78 55 39 1279 2500 93 19 54 87 67 23 8 12 86 57 29 53 96 79 12 23 44 56 106 71 50 36 1158 3500 70 15 41 65 50 17 6 9 65 43 22 40 72 59 9 17 33 42 80 53 37 27 871 Calculated "Reserve Price" (Rs Cr) (50% discount on Model Price)
  • 29.
  • 30.
    30 The New ModelWill • Prevent bidding distortion percolating into future auctions • Prevent irresponsible bidding by penalizing speculative actions • Prevent volatility in auction prices and make it more predictable • Prevent moral hazard resulting out of drastic corrections in prices • Prevent undue competitive advantage to a few players • Prevent randomness of auction prices across bands and circles • Prevent accusation by audit agencies on bureaucratic actions
  • 31.
  • 32.
  • 33.
    33 2010 Bidding Matrix(2100 MHz) Bidding was intense in the later rounds due to the auction “closing rules” which mandated bidders to bid to be sure of making a win
  • 34.
    34 2010 Bidding Matrix(2300 MHz) RJIO bid all circles in the 1st round and more intensely than others 5 players (Bharti, Qualcomm, Aircel, Tikona, RJIO) remaining in the fray till the last minute chasing two slots 1 2 3 4 5
  • 35.
    35 2012 Bidding Matrix(1800 MHz) • Bharti bid only 1.25 MHz in Assam • Bidding closed in 1st round in most circles except Bihar, UPW and WB
  • 36.
    36 2014 Bidding Matrix(900 MHz) • Bidding closed for Mumbai & Delhi in 1st few rounds • Idea snatched 5 MHz in Delhi from Bharti & Vodafone • RJIO bid only in the initial few rounds that too for Delhi & Mumbai • Tata bid only in the initial few rounds that too for Kolkata and Mumbai
  • 37.
    37 2014 Bidding Matrix(1800 MHz) • Competition was between 5 players 1 2 3 4 5
  • 38.
    38 2015 Bidding Matrix(800 MHz) • Vodafone & RCOM fought for NE & Assam • Bharti got out in the initial rounds • Idea focused on MP and also bid for NE and Assam • RJIO & Tata were in tussle for AP, Delhi, and Maharashtra
  • 39.
    39 2015 Bidding Matrix(900 MHz) • Bharti, Vodafone & Idea were direct conflict with RJIO in the last rounds • Bidding for most others circles got over in the initial rounds
  • 40.
    40 2015 Bidding Matrix(1800 MHz) • Bidding was less intense • Bidders focused their bids selectively
  • 41.
    41 2015 Bidding Matrix(2100 MHz) • Bharti took selected circles • Tussle was between Idea & Vodafone
  • 42.
    42 2016 Bidding Matrix(800 MHz) • Tussle was between RJIO and Idea
  • 43.
    43 2016 Bidding Matrix(1800 MHz) 1 2 3 4 5 • Competition was between 5 players • Tata bid AP, Maharashtra and Mumbai • Mumbai saw demand from RJIO, Tata and Idea • UPE saw a tussle between RJIO & Vodafone
  • 44.
    44 2016 Bidding Matrix(2100 MHz) • Only 3 players seeking spectrum • Auction got over in the initial rounds
  • 45.
    45 2016 Bidding Matrix(2300 MHz) • Only 3 players were seeking spectrum, except RCOM who bid only Gujarat
  • 46.
    46 2016 Bidding Matrix(2500 MHz) • Only 2 players were seeking spectrum
  • 47.
    47 2010 Spectrum Matrix Allspectrum got sold
  • 48.
    48 2012 Spectrum Matrix Unsoldspectrum Offered spectrum
  • 49.
    49 2013 Spectrum Matrix Unsoldspectrum Offered spectrum
  • 50.
    50 2014 Spectrum MatrixUnsold spectrum Offered spectrum
  • 51.
    51 2015 Spectrum Matrix Unsoldspectrum Offered spectrum
  • 52.
    52 2016 Spectrum Matrix UnsoldspectrumOffered spectrum
  • 53.
    53 2010 Auction Value(2100 MHz) Increased Intensity of Auction in the later rounds due to 2 reasons a) Too much demand for Delhi and Mumbai, and Cat A circles b) Auction closing rules required continuous bidding to ensure a win
  • 54.
    54 2010 Auction Value(2300 MHz) -1
  • 55.
    55 2010 Auction Value(2300 MHz) -2
  • 56.
  • 57.
    57 2014 Auction Value(900 MHz) RJIO and Tata exited the auction after few rounds
  • 58.
  • 59.
    59 2015 Auction Value(800 MHz) RJIO could not out bid Tata as the latter was bidding in chunks of 1.25 MHz
  • 60.
    60 2015 Auction Value(900 MHz) RJIO’s late entry into the fray raised the price for Bharti and Vodafone
  • 61.
  • 62.
  • 63.
  • 64.
  • 65.
  • 66.
  • 67.
  • 68.
    68 800 MHz PriceTrends % Rev Dis Average
  • 69.
  • 70.
    70 900 MHz PriceTrends % Rev Dis Average
  • 71.
    71 1800 MHz PriceTrends % Rev Dis Average
  • 72.
    72 2100 MHz PriceTrends % Rev Dis Average
  • 73.
    73 2300 MHz PriceTrends % Rev Dis Average
  • 74.
    74 Delhi & MumbaiWas 40% of Auction Value With Only 14% of Revenue Bid Details 2010 : Last Bid (Round No) 2010: Bids (Total) 2010: Winner (MHz) Circles BHA VOD IDE RCO TAT AIR VID STE ETI BHA VOD IDE RCO TAT AIR VID STE ETI BHA VOD IDE RCO TAT AIR VID STE ETI DEL 182 181 109 182 181 153 96 103 120 59 125 95 113 34 5 5 5 MUM 183 182 97 182 158 163 79 105 106 59 95 84 116 30 5 5 5 0% 5% 10% 15% 20% 25% AP AS BH DL GU HA HP JK KA KE KO MP MA MU NE OR PU RA TN UPE UPW WB 2100 MHz Auction - % Distribution (Year 2010) Auction Price Reserve Price Total Industry Revenue 3 Slots Chased by 6 BiddersTata (No 2G) Bid Till Last But Lost RCOM & Aircel Bid Aggressively 2100 Auction (2010) : Overenthusiasm
  • 75.
    75 Price of AP,DL, MA, MU Increased 2.5, 1.4, 2.3, 1.6 times Respectively 0 100 200 300 400 500 600 700 800 900 AP AS BH DL GU HA HP JK KA KE KO MP MA MU NE OR PU RA TN UPE UPW WB 800 MHz Auction : Final Price vs Reserve Price (Rs Cr Per MHz) Auction Price Reserve Price Bid Details 2015 : Last Bid (Round No) 2015 : Bids (Total) 2015 : Winners (MHz) Circles BHA VOD IDE RJIO RCO TAT TEL AIR BHA VOD IDE RJIO RCO TAT TEL AIR BHA VOD IDE RJIO RCO TAT TEL AIR DEL 36 111 112 2 28 27 1.3 MUM 23 45 47 48 2 11 11 12 5 2.5 MAHA 1 38 34 111 112 1 3 2 36 36 2.5 AP 21 48 113 114 3 3 33 35 3.8 RJIO Bid Till Last But Not Win 3 of 4 Below TATA’s & RJIO’s Bidding Intensity Was High Quantum of Spectrum Was Low 800 Auction (2015) : Insufficient Spectrum
  • 76.
    76 Final Price ofRaj, UPE & UPW Increased 3.6, 4.2, 4.3 times Respectively Bid Details 2015 : Last Bid (Round No) 2015 : Bids (Total) 2015 : Winners (MHz) Circles BHA VOD IDE RJIO RCO TAT TEL AIR BHA VOD IDE RJIO RCO TAT TEL AIR BHA VOD IDE RJIO RCO TAT TEL AIR UPW 99 98 7 10 12 18 20 3 7 11 5 UPE 110 22 109 6 21 9 23 6 5.6 RAJA 106 107 104 16 28 32 27 2 6 6.4 0 100 200 300 400 500 600 700 800 900 AP AS BH DL GU HA HP JK KA KE KO MP MA MU NE OR PU RA TN UPE UPW WB 900 MHz Auction : Final Price vs Reserve Price (Rs CR Per/MHz) Auction Price Reserve Price RJIO Bid Till Last But Not Win RJIO’s Bidding Intensity Was High Quantum of Spectrum Was Low 900 Auction (2015) : Business Continuity
  • 77.
    77 2300 Auction (2010): Overenthusiasm Delhi & Mumbai Was 40% of Auction Value With Only 14% of Revenue