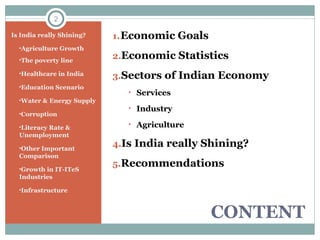
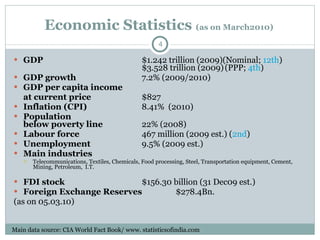
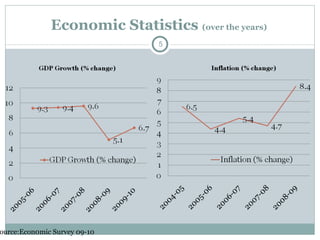
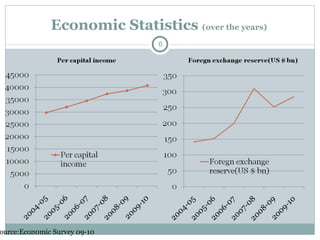
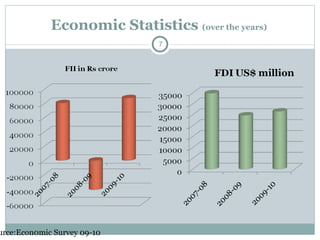
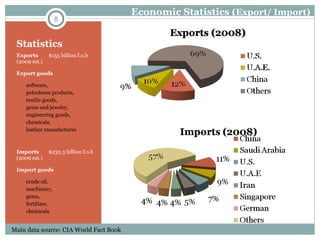
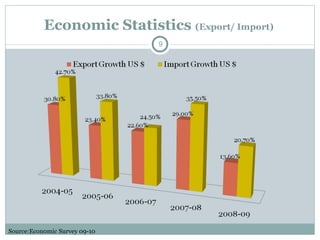
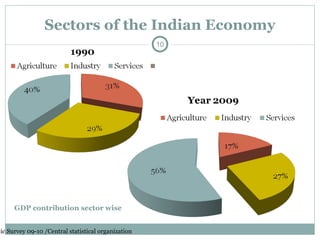
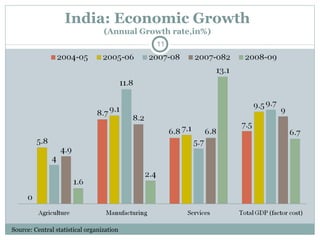
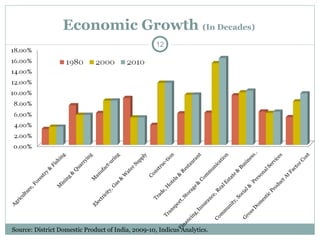
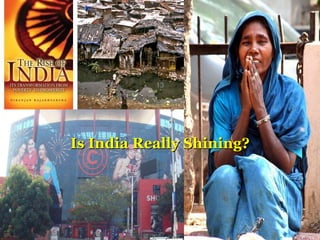
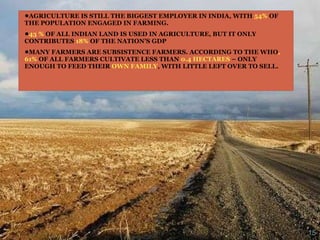
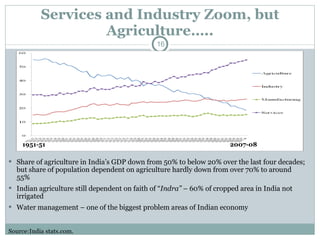
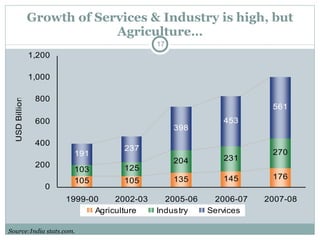
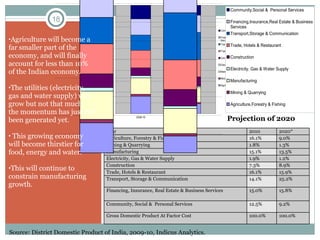
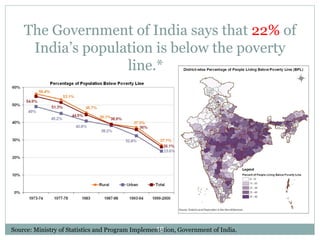
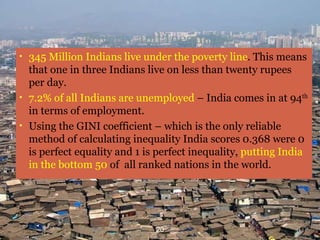
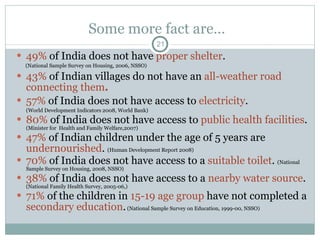
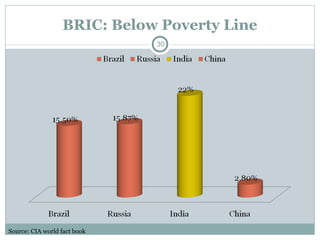
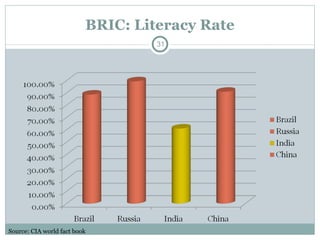
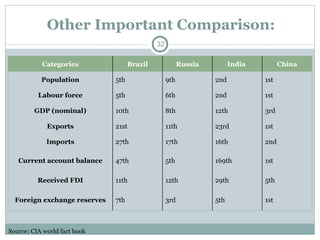
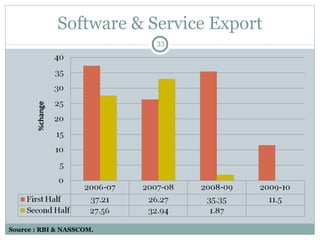
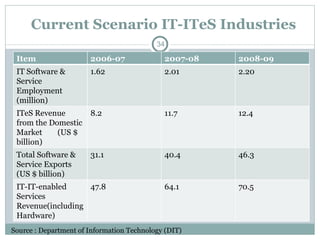
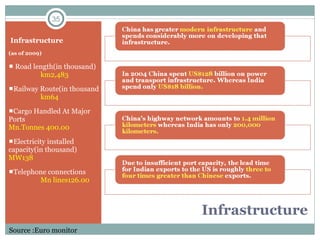
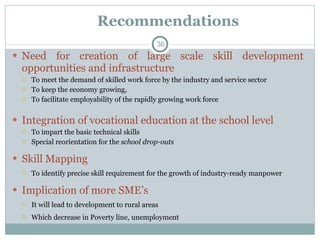
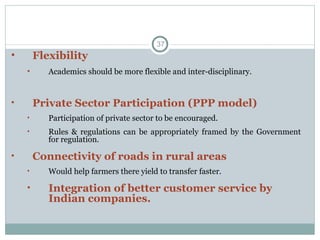
IIPM TOWER,893/4,BHANDARKAR ROAD,DECCAN GYMKHANA,PUNE-411004,PH:020-66420401/2 FAX 020-66420422 PRSENTED BY :  ADITYA BANDHOKAR,  ARNOLD FERNANDES, KULDEEP SONI,  ROBIN ANTONY,  VRUSHABH PATIL IIPMites presents,
CONTENT Economic Goals Economic Statistics Sectors of Indian Economy Services  Industry Agriculture Is India really Shining? Recommendations Is India really Shining? Agriculture Growth The poverty line Healthcare in India  Education Scenario Water & Energy Supply Corruption  Literacy Rate & Unemployment Other Important Comparison Growth in IT-ITeS Industries Infrastructure
Macroeconomic goals are determined by governments as representatives of society. Final Goals: High Growth, Smooth Growth, Low Unemployment, and Low Inflation Macroeconomic Goals
Economic Statistics  (as on March2010)  GDP   $1.242 trillion (2009)(Nominal;  12th ) $3.528 trillion (2009)   (PPP;  4th ) GDP growth 7.2% (2009/2010) GDP per capita income  at current price $827 Inflation (CPI) 8.41%  (2010) Population below poverty line 22% (2008) Labour force 467 million (2009 est.) ( 2nd ) Unemployment 9.5% (2009 est.) Main industries   Telecommunications, Textiles, Chemicals, Food processing, Steel, Transportation equipment, Cement, Mining, Petroleum,  I.T. FDI stock $156.30 billion (31 Dec09 est.) Foreign Exchange Reserves   $278.4Bn. (as on 05.03.10) Main data source: CIA World Fact Book/ www. statisticsofindia.com
Economic Statistics  (over the years)  Source:Econ0mic Survey 09-10
Statistics  Exports $155 billion f.o.b (2009 est.) Export goods  software,  petroleum products,  textile goods,  gems and jewelry,  engineering goods,  chemicals,  leather manufactures Imports $232.3 billion f.o.b (2009 est.) Import goods crude oil,  machinery,  gems,  fertilizer,  chemicals Main data source: CIA World Fact Book Economic Statistics  (Export/ Import)
Economic Statistics  (Export/ Import)  Source:Econ0mic Survey 09-10
Sectors of the Indian Economy GDP contribution sector wise Source:Econ0mic Survey 09-10 / Central statistical organization
Source: Central statistical organization  India: Economic Growth (Annual Growth rate,in%)
Economic Growth  (In Decades)  Source: District Domestic Product of India, 2009-10, Indicus Analytics.
Is India Really Shining?
AGRICULTURE IS STILL THE BIGGEST EMPLOYER IN INDIA, WITH  54%  OF THE POPULATION ENGAGED IN FARMING.  43 %  OF ALL INDIAN LAND IS USED IN AGRICULTURE, BUT IT ONLY CONTRIBUTES  18%  OF THE NATION’S GDP MANY FARMERS ARE SUBSISTENCE FARMERS. ACCORDING TO THE WHO , 61%  OF ALL FARMERS CULTIVATE LESS THAN  0.4 HECTARES  – ONLY ENOUGH TO FEED THEIR  OWN FAMILY , WITH LITTLE LEFT OVER TO SELL.
Services and Industry Zoom, but Agriculture….. Share of agriculture in India’s GDP down from 50% to below 20% over the last four decades; but share of population dependent on agriculture hardly down from over 70% to around 55% Indian agriculture still dependent on faith of “ Indra”  – 60% of cropped area in India not irrigated Water management – one of the biggest problem areas of Indian economy Source:India stats.com. 1951-51 2007-08
Growth of Services & Industry is high, but Agriculture… Source:India stats.com.
Agriculture will become a far smaller part of the economy, and will finally account for less than 10% of the Indian economy.  The utilities (electricity, gas and water supply) will grow but not that much; the momentum has just not been generated yet. This growing economy will become thirstier for food, energy and water.  This will continue to constrain manufacturing growth.  Projection of 2020 Source: District Domestic Product of India, 2009-10, Indicus Analytics. Year 2010 2020* Agriculture, Forestry & Fishing 16.1% 9.0% Mining & Quarrying 1.8% 1.3% Manufacturing 15.1% 13.5% Electricity, Gas & Water Supply 1.9% 1.2% Construction 7.3% 8.9% Trade, Hotels & Restaurant 16.1% 15.9% Transport, Storage & Communication 14.1% 25.2% Financing, Insurance, Real Estate & Business Services 15.0% 15.8% Community, Social &  Personal Services 12.5% 9.2% Gross Domestic Product At Factor Cost 100.0% 100.0%
Source: Ministry of Statistics and Program Implementation, Government of India. The Government of India says that  22%  of India’s population is below the poverty line.*
Poverty and Inequality 345 Million Indians live under the poverty line . This means that one in three Indians live on less than twenty rupees per day. 7.2% of all Indians are unemployed  – India comes in at 94 th  in terms of employment.   Using the GINI coefficient – which is the only reliable method of calculating inequality India scores 0.368 were 0 is perfect equality and 1 is perfect inequality,  putting India in the bottom 50  of  all ranked nations in the world.
Some more fact are… 49%  of India does not have  proper shelter .  (National Sample Survey on Housing, 2006, NSSO) 43%  of Indian villages do not have an  all-weather road connecting them . 57%  of India does not have access to  electricity .  (World Development Indicators 2008, World Bank) 80%  of India does not have access to  public health facilities .  (Minister for  Health and Family Welfare,2007) 47%  of Indian children under the age of 5 years are  undernourished .  (Human Development Report 2008) 70%  of India does not have access to a  suitable toilet .  (National Sample Survey on Housing, 2008, NSSO) 38%  of India does not have access to a  nearby water source .  (National Family Health Survey, 2005-06,) 71%  of the children in  15-19 age group  have not completed a  secondary education .  (National Sample Survey on Education, 1999-00, NSSO)
Economic Development : Urbanized Source:Econ0mic Survey 09-10
Below Poverty Line Source: Reserve bank of India 2008-09
Education Our literacy rate is 61% making us the 145 th  in the World, just above war-torn Sudan and just below genocidal Rwanda. Literacy is defined as “The ability to sign one’s name” so complete literacy is likely to be even less.  Guns are more important than books: 2.9% of GDP is spend on defense compared to 2.6% on education. Is it guns or education that will really make India shine?
India consumes 3.4% of global energy.  The Indian power demand is growing at a rapid pace.  The Annual demand is increasing by 3.6% over the last 30 years.  Capacity for power generation in India is 1,49,391.91 MW. Thus the per capita consumption of electricity is the lowest in India.  Power sector faces roadblocks like inefficient distribution systems, Due to Low capacity utilization and poor maintenance. Energy  Consumption Industry & Agriculture are the two main sectors that consume power.  By 2012, India will need another 60 to 70 GW of power, the demand would be 950,000 MW by 2030 For the Indian economy to grow at 9% annually, additional capacity of  60 GW must be added every five years.  This requires approx.  US$100 billion in investment  every five years.  Source: India-Reports
Water Scenario  in India Average water consumption around the world is about 53 liters per head per day.  In India, we have only about 20 liters available per head per day. India can store only small quantities of its rainfall.  Whereas rich countries (such as the U.S. & Australia) have built over 5,000 cubic meters of water storage per capita. China can store about 1,000 cubic meters per capita,  India’s dams can store only 200 cubic meters per person.  Moreover, India can store only about 30 days of rainfall, compared to 900 days in major river basins in areas of developed countries.
Health care  Healthcare: Our Fundamental Right Our life expectancy is 69.8 years, making our life expectancy the 139nth out of 172 countries.  A growing threat: 5.7 million Indians have AIDS or HIV out of which 40 % are women We have only one hospital bed for every 74 patients. We have only one doctor for every 1,230 people. Despite these statistics, the Indian Government still spends more on defense than it does on health.  Source: indiahealthstat.com/indexmundi.com
Corruption Large Bureaucratic structure –a ground for corruption Difficult to manage overlapping government agencies and  paper work-system very complex Foreign investment perceived as slow, difficult way of doing business in such bureaucratic structure Foreign investment done at the cost of delaying projects  Corruption at every stage , this together with other reason added to less likeliness of FDI inflows Source:Econ0mic Survey 09-10
BRIC: Unemployment Source: CIA world fact book
BRIC: Below Poverty Line Source: CIA world fact book
BRIC: Literacy Rate Source: CIA world fact book
Other Important Comparison: Source: CIA world fact book Categories   Brazil    Russia    India     China  Population 5th 9th 2nd 1st Labour force 5th 6th 2nd 1st GDP (nominal) 10th 8th 12th 3rd Exports 21st 11th 23rd 1st Imports 27th 17th 16th 2nd Current account balance 47th 5th 169th 1st Received FDI 11th 12th 29th 5th Foreign exchange reserves 7th 3rd 5th 1st
Software & Service Export Source : RBI & NASSCOM.
Current Scenario IT-ITeS Industries Source : Department of Information Technology (DIT) Item 2006-07 2007-08 2008-09 IT Software & Service Employment (million) 1.62 2.01 2.20 ITeS Revenue from the Domestic Market  (US $ billion) 8.2 11.7 12.4 Total Software & Service Exports  (US $ billion) 31.1 40.4 46.3 IT-IT-enabled Services Revenue(including Hardware) 47.8 64.1 70.5
Infrastructure Infrastructure (as of 2009)     Road length(in thousand)  km2,483 Railway Route(in thousand  km64 Cargo Handled At Major Ports    Mn.Tonnes 400.00 Electricity installed capacity(in thousand)  MW138 Telephone connections Mn lines126.00 Source :Euro monitor
Need for creation of large scale skill development opportunities and infrastructure  To meet the demand of skilled work force by the industry and service sector  To keep the economy growing,  To facilitate employability of the rapidly growing work force  Integration   of vocational education at the school level To impart the basic technical skills Special reorientation for the  school drop-outs   Skill Mapping To identify precise skill requirement for the growth of industry-ready manpower  Implication of more SME’s It will lead to development to rural areas Which decrease in Poverty line, unemployment Recommendations
Flexibility Academics should be more flexible and inter-disciplinary.  Private Sector Participation (PPP model) Participation of private sector to be encouraged. Rules & regulations can be appropriately framed by the Government for regulation. Connectivity of roads in rural areas Would help farmers there yield to transfer faster. Integration of better customer service by Indian companies.
Thank you We are grateful for every person who has been a part of this presentation knowingly or otherwise. For the development of the Presentation, We thank the guidance of Prof. Aashish Suri  (IIPM,Pune) Prof. Kalamkar ( Ghokhale Institute,Pune) Prof. M/s Kalyani  (IMDR,Pune) Prof. Bhandari  (IMERT,Pune)

Indian economy overstated

  • 1.
    IIPM TOWER,893/4,BHANDARKAR ROAD,DECCANGYMKHANA,PUNE-411004,PH:020-66420401/2 FAX 020-66420422 PRSENTED BY : ADITYA BANDHOKAR, ARNOLD FERNANDES, KULDEEP SONI, ROBIN ANTONY, VRUSHABH PATIL IIPMites presents,
  • 2.
    CONTENT Economic GoalsEconomic Statistics Sectors of Indian Economy Services Industry Agriculture Is India really Shining? Recommendations Is India really Shining? Agriculture Growth The poverty line Healthcare in India Education Scenario Water & Energy Supply Corruption Literacy Rate & Unemployment Other Important Comparison Growth in IT-ITeS Industries Infrastructure
  • 3.
    Macroeconomic goals aredetermined by governments as representatives of society. Final Goals: High Growth, Smooth Growth, Low Unemployment, and Low Inflation Macroeconomic Goals
  • 4.
    Economic Statistics (as on March2010) GDP $1.242 trillion (2009)(Nominal;  12th ) $3.528 trillion (2009) (PPP;  4th ) GDP growth 7.2% (2009/2010) GDP per capita income at current price $827 Inflation (CPI) 8.41% (2010) Population below poverty line 22% (2008) Labour force 467 million (2009 est.) ( 2nd ) Unemployment 9.5% (2009 est.) Main industries Telecommunications, Textiles, Chemicals, Food processing, Steel, Transportation equipment, Cement, Mining, Petroleum,  I.T. FDI stock $156.30 billion (31 Dec09 est.) Foreign Exchange Reserves $278.4Bn. (as on 05.03.10) Main data source: CIA World Fact Book/ www. statisticsofindia.com
  • 5.
    Economic Statistics (over the years) Source:Econ0mic Survey 09-10
  • 6.
    Economic Statistics (over the years) Source:Econ0mic Survey 09-10
  • 7.
    Economic Statistics (over the years) Source:Econ0mic Survey 09-10
  • 8.
    Statistics Exports$155 billion f.o.b (2009 est.) Export goods software, petroleum products, textile goods, gems and jewelry, engineering goods, chemicals, leather manufactures Imports $232.3 billion f.o.b (2009 est.) Import goods crude oil, machinery, gems, fertilizer, chemicals Main data source: CIA World Fact Book Economic Statistics (Export/ Import)
  • 9.
    Economic Statistics (Export/ Import) Source:Econ0mic Survey 09-10
  • 10.
    Sectors of theIndian Economy GDP contribution sector wise Source:Econ0mic Survey 09-10 / Central statistical organization
  • 11.
    Source: Central statisticalorganization India: Economic Growth (Annual Growth rate,in%)
  • 12.
    Economic Growth (In Decades) Source: District Domestic Product of India, 2009-10, Indicus Analytics.
  • 13.
  • 15.
    AGRICULTURE IS STILLTHE BIGGEST EMPLOYER IN INDIA, WITH 54% OF THE POPULATION ENGAGED IN FARMING. 43 % OF ALL INDIAN LAND IS USED IN AGRICULTURE, BUT IT ONLY CONTRIBUTES 18% OF THE NATION’S GDP MANY FARMERS ARE SUBSISTENCE FARMERS. ACCORDING TO THE WHO , 61% OF ALL FARMERS CULTIVATE LESS THAN 0.4 HECTARES – ONLY ENOUGH TO FEED THEIR OWN FAMILY , WITH LITTLE LEFT OVER TO SELL.
  • 16.
    Services and IndustryZoom, but Agriculture….. Share of agriculture in India’s GDP down from 50% to below 20% over the last four decades; but share of population dependent on agriculture hardly down from over 70% to around 55% Indian agriculture still dependent on faith of “ Indra” – 60% of cropped area in India not irrigated Water management – one of the biggest problem areas of Indian economy Source:India stats.com. 1951-51 2007-08
  • 17.
    Growth of Services& Industry is high, but Agriculture… Source:India stats.com.
  • 18.
    Agriculture will becomea far smaller part of the economy, and will finally account for less than 10% of the Indian economy. The utilities (electricity, gas and water supply) will grow but not that much; the momentum has just not been generated yet. This growing economy will become thirstier for food, energy and water. This will continue to constrain manufacturing growth. Projection of 2020 Source: District Domestic Product of India, 2009-10, Indicus Analytics. Year 2010 2020* Agriculture, Forestry & Fishing 16.1% 9.0% Mining & Quarrying 1.8% 1.3% Manufacturing 15.1% 13.5% Electricity, Gas & Water Supply 1.9% 1.2% Construction 7.3% 8.9% Trade, Hotels & Restaurant 16.1% 15.9% Transport, Storage & Communication 14.1% 25.2% Financing, Insurance, Real Estate & Business Services 15.0% 15.8% Community, Social & Personal Services 12.5% 9.2% Gross Domestic Product At Factor Cost 100.0% 100.0%
  • 19.
    Source: Ministry ofStatistics and Program Implementation, Government of India. The Government of India says that 22% of India’s population is below the poverty line.*
  • 20.
    Poverty and Inequality345 Million Indians live under the poverty line . This means that one in three Indians live on less than twenty rupees per day. 7.2% of all Indians are unemployed – India comes in at 94 th in terms of employment. Using the GINI coefficient – which is the only reliable method of calculating inequality India scores 0.368 were 0 is perfect equality and 1 is perfect inequality, putting India in the bottom 50 of all ranked nations in the world.
  • 21.
    Some more factare… 49% of India does not have proper shelter . (National Sample Survey on Housing, 2006, NSSO) 43% of Indian villages do not have an all-weather road connecting them . 57% of India does not have access to electricity . (World Development Indicators 2008, World Bank) 80% of India does not have access to public health facilities . (Minister for Health and Family Welfare,2007) 47% of Indian children under the age of 5 years are undernourished . (Human Development Report 2008) 70% of India does not have access to a suitable toilet . (National Sample Survey on Housing, 2008, NSSO) 38% of India does not have access to a nearby water source . (National Family Health Survey, 2005-06,) 71% of the children in 15-19 age group have not completed a secondary education . (National Sample Survey on Education, 1999-00, NSSO)
  • 22.
    Economic Development :Urbanized Source:Econ0mic Survey 09-10
  • 23.
    Below Poverty LineSource: Reserve bank of India 2008-09
  • 24.
    Education Our literacyrate is 61% making us the 145 th in the World, just above war-torn Sudan and just below genocidal Rwanda. Literacy is defined as “The ability to sign one’s name” so complete literacy is likely to be even less. Guns are more important than books: 2.9% of GDP is spend on defense compared to 2.6% on education. Is it guns or education that will really make India shine?
  • 25.
    India consumes 3.4%of global energy. The Indian power demand is growing at a rapid pace. The Annual demand is increasing by 3.6% over the last 30 years. Capacity for power generation in India is 1,49,391.91 MW. Thus the per capita consumption of electricity is the lowest in India. Power sector faces roadblocks like inefficient distribution systems, Due to Low capacity utilization and poor maintenance. Energy Consumption Industry & Agriculture are the two main sectors that consume power. By 2012, India will need another 60 to 70 GW of power, the demand would be 950,000 MW by 2030 For the Indian economy to grow at 9% annually, additional capacity of 60 GW must be added every five years. This requires approx. US$100 billion in investment every five years. Source: India-Reports
  • 26.
    Water Scenario in India Average water consumption around the world is about 53 liters per head per day. In India, we have only about 20 liters available per head per day. India can store only small quantities of its rainfall. Whereas rich countries (such as the U.S. & Australia) have built over 5,000 cubic meters of water storage per capita. China can store about 1,000 cubic meters per capita, India’s dams can store only 200 cubic meters per person. Moreover, India can store only about 30 days of rainfall, compared to 900 days in major river basins in areas of developed countries.
  • 27.
    Health care Healthcare: Our Fundamental Right Our life expectancy is 69.8 years, making our life expectancy the 139nth out of 172 countries. A growing threat: 5.7 million Indians have AIDS or HIV out of which 40 % are women We have only one hospital bed for every 74 patients. We have only one doctor for every 1,230 people. Despite these statistics, the Indian Government still spends more on defense than it does on health. Source: indiahealthstat.com/indexmundi.com
  • 28.
    Corruption Large Bureaucraticstructure –a ground for corruption Difficult to manage overlapping government agencies and paper work-system very complex Foreign investment perceived as slow, difficult way of doing business in such bureaucratic structure Foreign investment done at the cost of delaying projects Corruption at every stage , this together with other reason added to less likeliness of FDI inflows Source:Econ0mic Survey 09-10
  • 29.
    BRIC: Unemployment Source:CIA world fact book
  • 30.
    BRIC: Below PovertyLine Source: CIA world fact book
  • 31.
    BRIC: Literacy RateSource: CIA world fact book
  • 32.
    Other Important Comparison:Source: CIA world fact book Categories   Brazil    Russia    India     China  Population 5th 9th 2nd 1st Labour force 5th 6th 2nd 1st GDP (nominal) 10th 8th 12th 3rd Exports 21st 11th 23rd 1st Imports 27th 17th 16th 2nd Current account balance 47th 5th 169th 1st Received FDI 11th 12th 29th 5th Foreign exchange reserves 7th 3rd 5th 1st
  • 33.
    Software & ServiceExport Source : RBI & NASSCOM.
  • 34.
    Current Scenario IT-ITeSIndustries Source : Department of Information Technology (DIT) Item 2006-07 2007-08 2008-09 IT Software & Service Employment (million) 1.62 2.01 2.20 ITeS Revenue from the Domestic Market (US $ billion) 8.2 11.7 12.4 Total Software & Service Exports (US $ billion) 31.1 40.4 46.3 IT-IT-enabled Services Revenue(including Hardware) 47.8 64.1 70.5
  • 35.
    Infrastructure Infrastructure (asof 2009)     Road length(in thousand) km2,483 Railway Route(in thousand km64 Cargo Handled At Major Ports Mn.Tonnes 400.00 Electricity installed capacity(in thousand) MW138 Telephone connections Mn lines126.00 Source :Euro monitor
  • 36.
    Need for creationof large scale skill development opportunities and infrastructure To meet the demand of skilled work force by the industry and service sector To keep the economy growing, To facilitate employability of the rapidly growing work force Integration of vocational education at the school level To impart the basic technical skills Special reorientation for the school drop-outs Skill Mapping To identify precise skill requirement for the growth of industry-ready manpower Implication of more SME’s It will lead to development to rural areas Which decrease in Poverty line, unemployment Recommendations
  • 37.
    Flexibility Academics shouldbe more flexible and inter-disciplinary. Private Sector Participation (PPP model) Participation of private sector to be encouraged. Rules & regulations can be appropriately framed by the Government for regulation. Connectivity of roads in rural areas Would help farmers there yield to transfer faster. Integration of better customer service by Indian companies.
  • 38.
    Thank you Weare grateful for every person who has been a part of this presentation knowingly or otherwise. For the development of the Presentation, We thank the guidance of Prof. Aashish Suri (IIPM,Pune) Prof. Kalamkar ( Ghokhale Institute,Pune) Prof. M/s Kalyani (IMDR,Pune) Prof. Bhandari (IMERT,Pune)

Editor's Notes

  • #5 Nominal GDP It can be misleading when inflation is not accounted for in the GDP figure because the GDP will appear higher than it actually is. The same concept that applies to return on investment (ROI) applies here. If you have a 10% ROI and inflation for the year has been 3%, your real rate of return would be 7%. Similarly, if the nominal GDP figure has shot up 8% but inflation has been 4%, the real GDP has only increased 4%.  
  • #9 FOB: Flight on board
  • #21 The Gini coefficient is usually defined  mathematically  based on the  Lorenz curve  (below). It can be thought of as the  ratio  of the  area  that lies between the line of equality and the Lorenz curve (marked 'A' in the diagram) over the total area under the line of equality (marked 'A' and 'B' in the diagram); i.e., G=A/(A+B). The Gini coefficient can range from 0 to 1; it is sometimes multiplied by 100 to range between 0 and 100. A low Gini coefficient indicates a more equal distribution, with 0 corresponding to complete equality, while higher Gini coefficients indicate more unequal distribution, with 1 corresponding to complete inequality. To be validly computed, no negative goods can be distributed. Thus, if the Gini coefficient is being used to describe household income  inequality, then no  household  can have a negative income. When used as a measure of income inequality, the most unequal society will be one in which a single person receives 100% of the total income and the remaining people receive none (G=1); and the most equal society will be one in which every person receives the same percentage of the total income (G=0).