Downloaded 16 times


![35
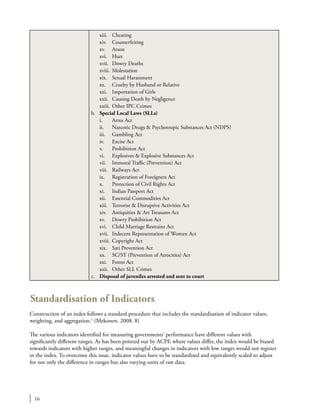
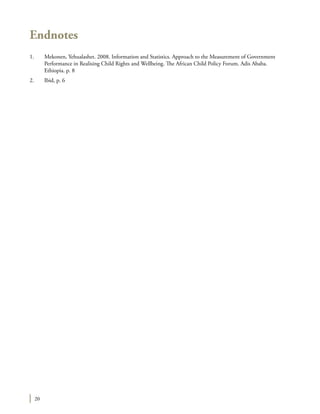
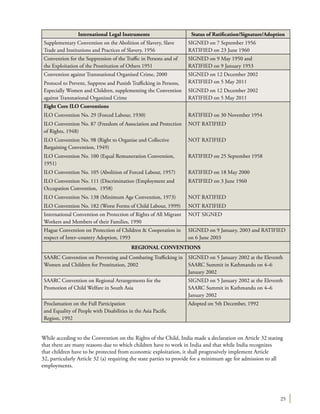
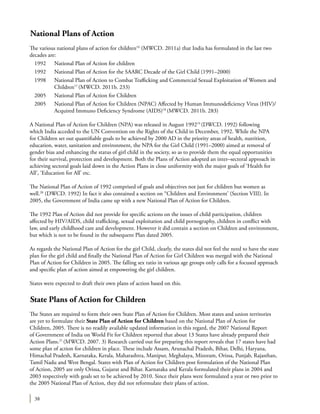
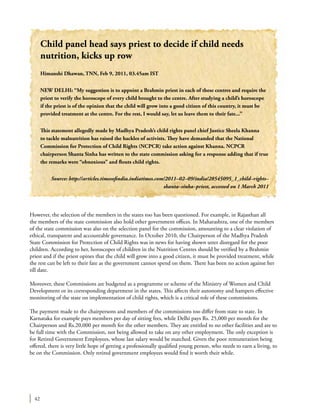
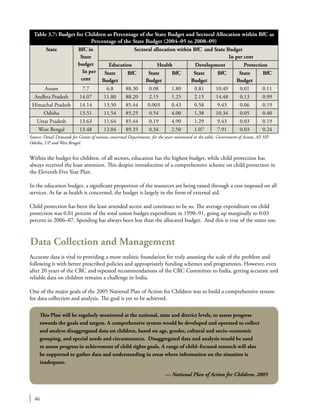
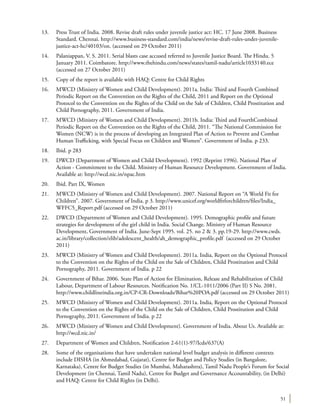
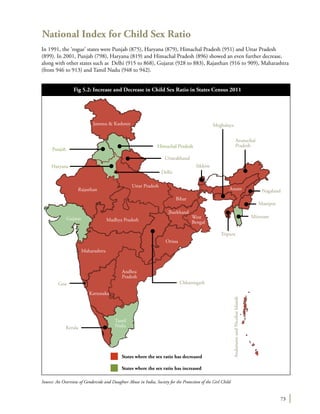
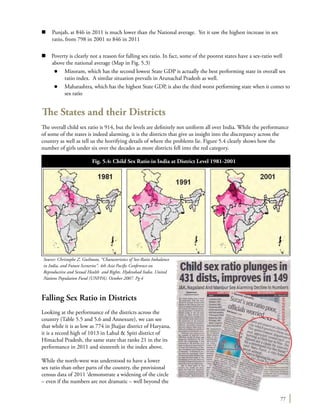
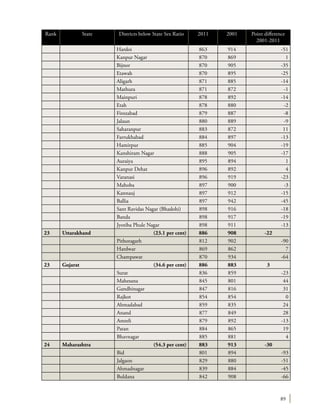
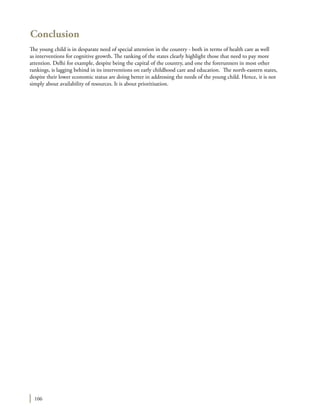
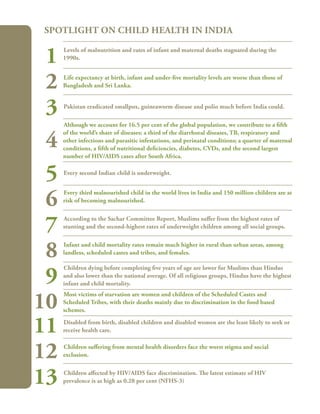
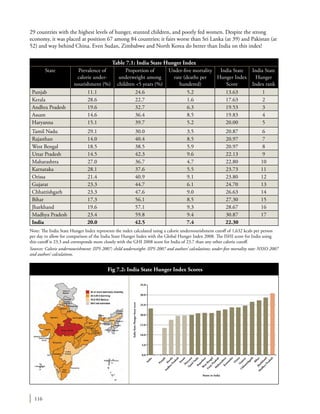
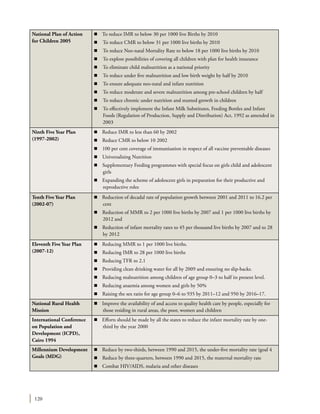
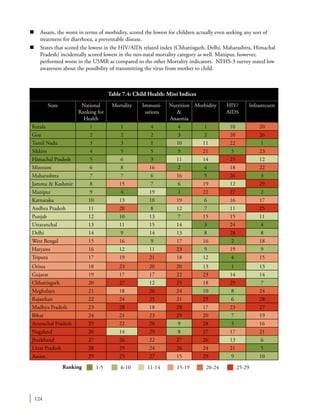
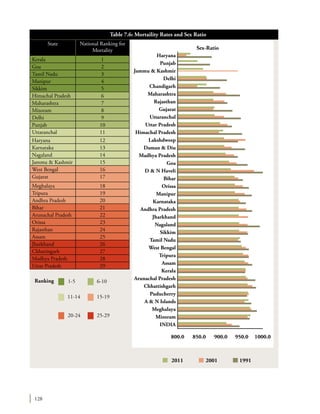
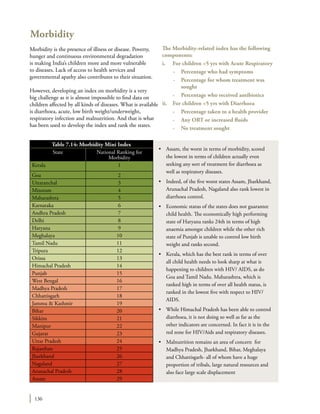
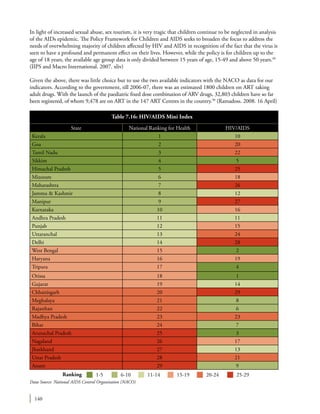
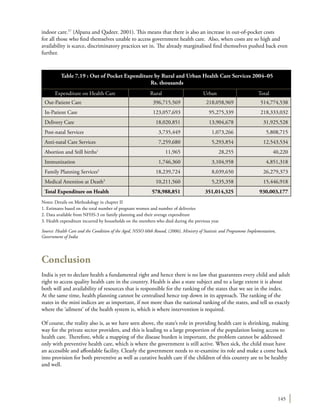
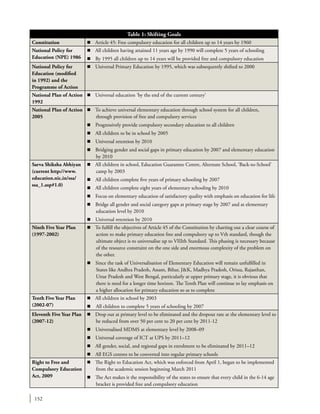
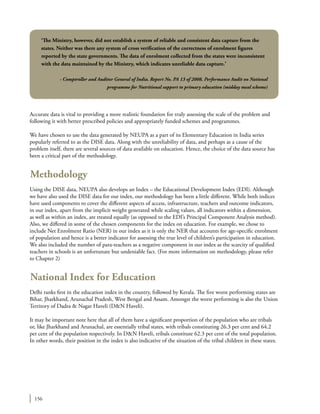
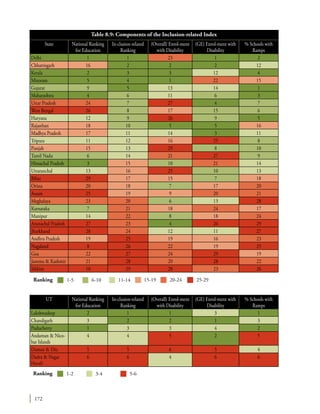
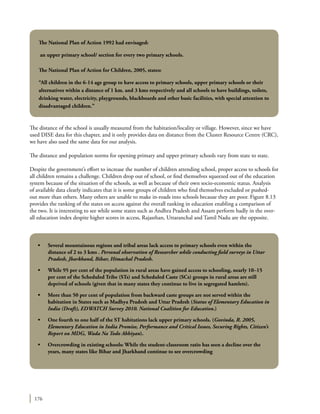
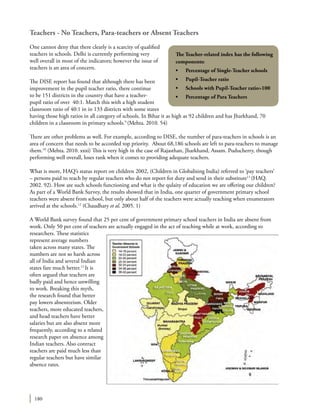
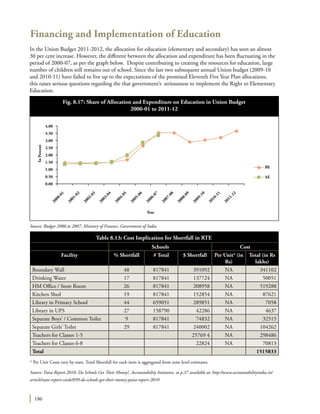
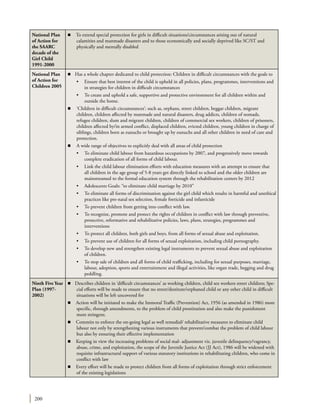
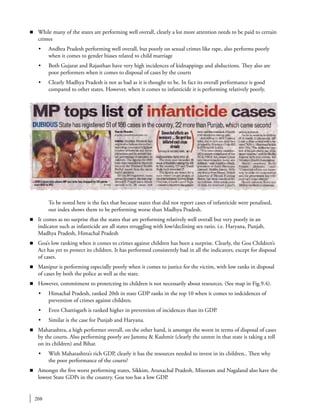
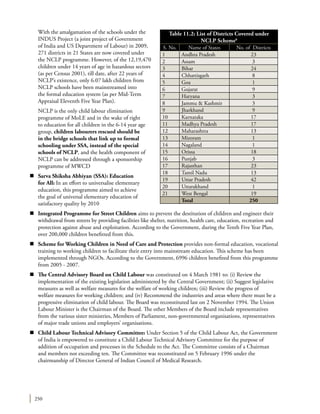
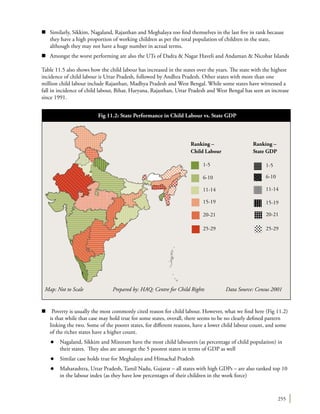
What is even more disconcerting is that because the laws dealing with child
labour are weak – a bailable offence with a minimum of three months
and a maximum of a year’s imprisonment OR/AND a fine of Rs. 10,000
extending to Rs. 20,000 – the implementation of the law remains tardy.
Taking recourse to the choice given, in almost all cases the employers are let
off with a fine.
The Government is yet to implement the CRC Committee’s
recommendation that the 1986 Child Labour Act be amended so that
government schools and training centres are no longer exempt from
prohibitions on employing children; and coverage is expanded to
include agriculture and other informal sectors or that the Factories Act
be amended to cover all factories or workshops employing child labour
and the Beedi Act be amended so that exemptions for household–based
production are eliminated.
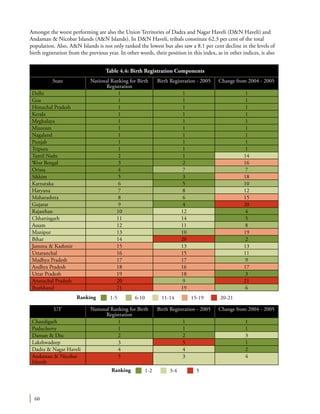
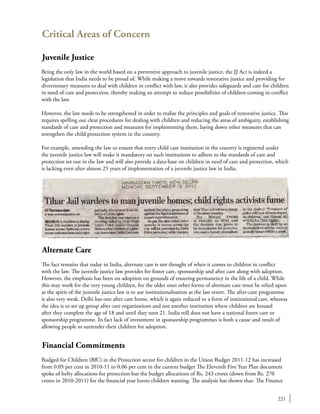
CRC Committee’s recommendation to India to withdraw its declaration on Article 32
of the Convention seems to be falling on deaf ears. In fact, in the light of enactment of the law guaranteeing
free and compulsory education to all children aged 6–14 years, the child labour law, policy and schemes are left
with no meaning and should not be required at all. As the current child labour law allows regulation of child
labour in some sectors, it is violative of the fundamental right to education guaranteed under Article 21A of the
Constitution of India.
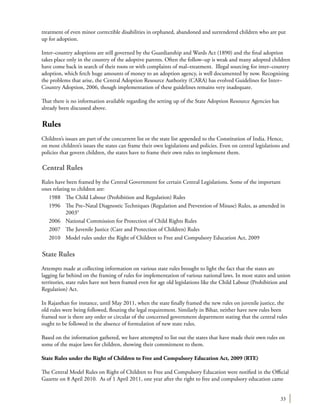
State Rules under Juvenile Justice (Care and Protection of Children) Act
In 2007 the Ministry of Women and Child Development notified the Juvenile Justice (Care and Protection
of Children) Rules, 2007 as the central model rules on juvenile justice. Under Rule 96 of these central model
rules, the states are required to frame their own rules conforming to the 2007 central model rules or else the
central model rules apply mutatis mutandis. The exact status of formulation of juvenile justice rules in the states
Committee recommends withdrawal of declaration on Article 32
The Committee encourages the State party to withdraw its declaration with respect to article 32 of the
Convention, as it is unnecessary in light of the efforts the State party is making to address child labour.
28 January 2000
CRC/C/15/Add.115
In light of the State party’s numerous measures to implement progressively article 32 of the
Convention, the Committee has serious doubt at the necessity of this declaration....In line with
its previous recommendations [Ibid., para. 66], and in light of the 1993 Vienna Declaration and
Programme of Action, the Committee urges the State party to withdraw the declaration made to article
32 of the Convention.
CRC/C/15/Add.228
30 January 2004](https://image.slidesharecdn.com/india-child-rights-index-151015094255-lva1-app6891/85/India-Child-Rights-Index-43-320.jpg)


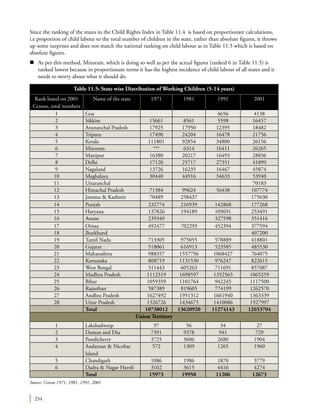
![212
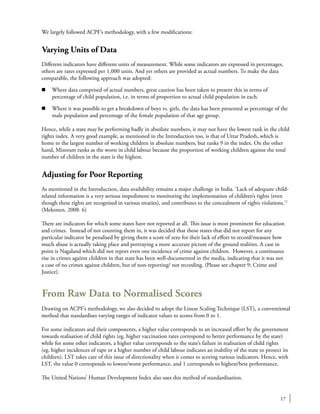
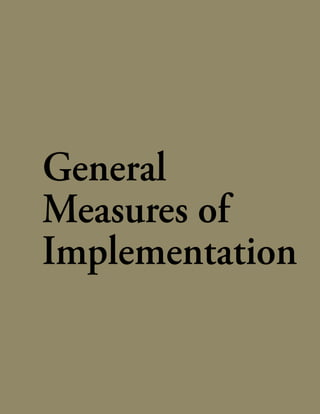
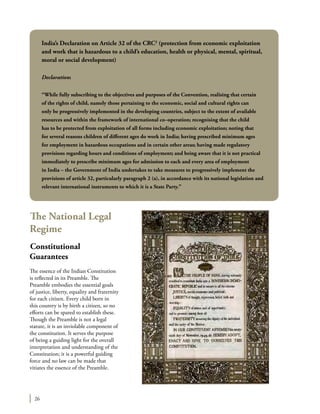
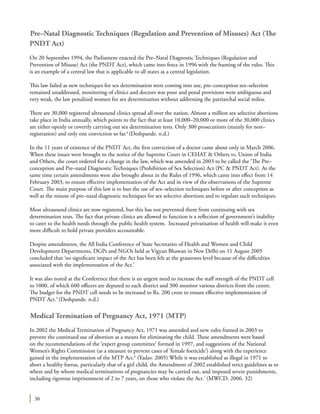
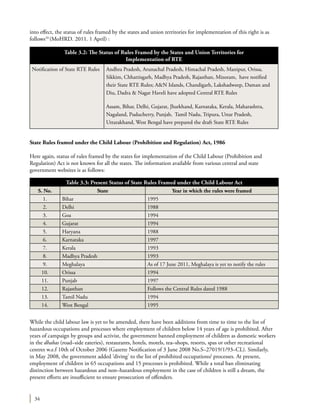
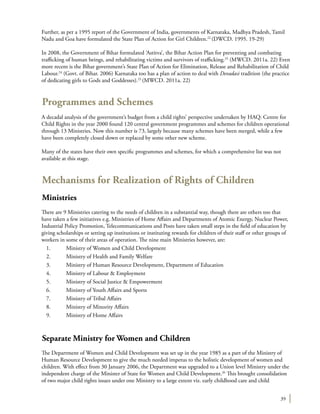
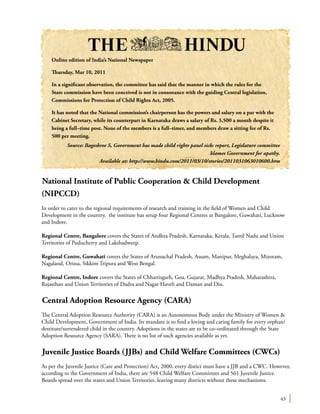
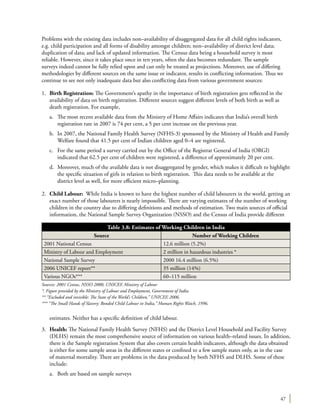
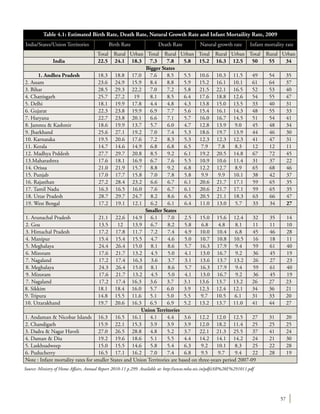
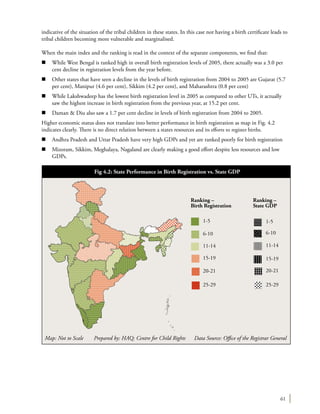
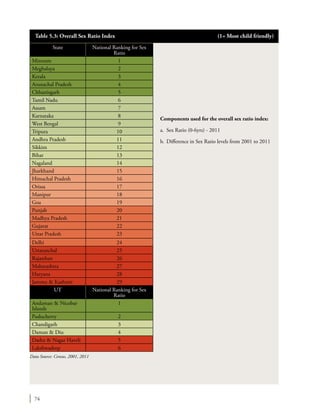
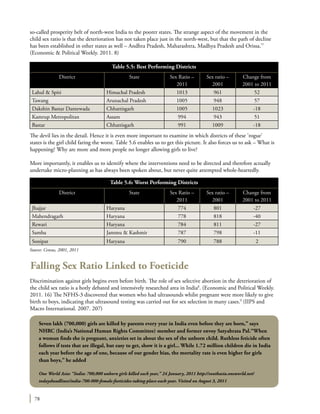
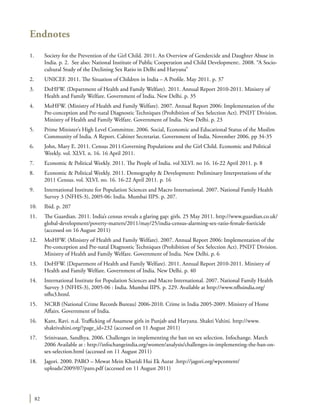
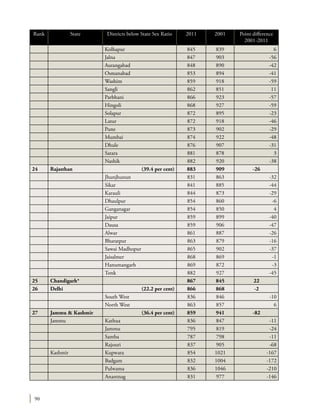
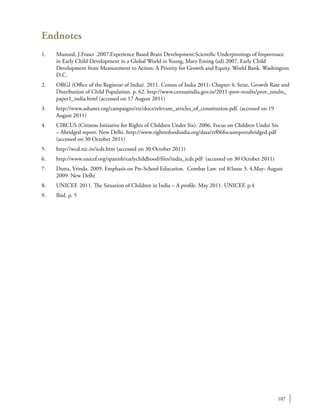
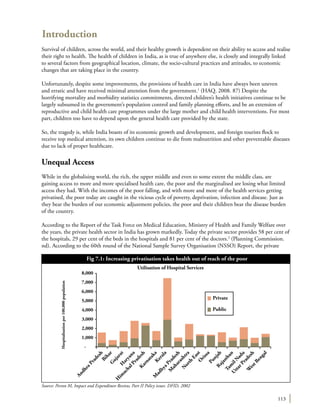
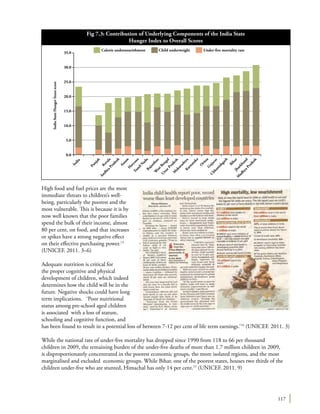
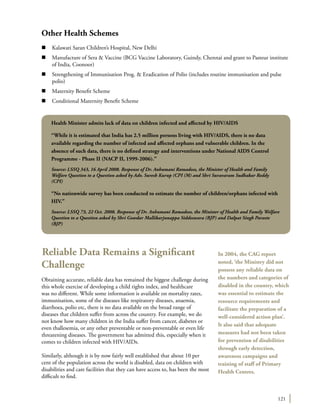
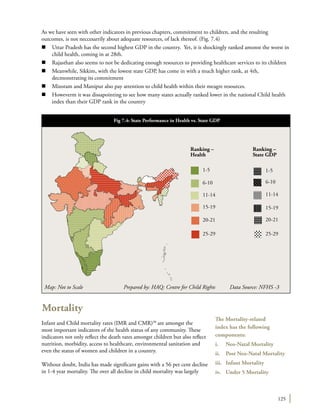
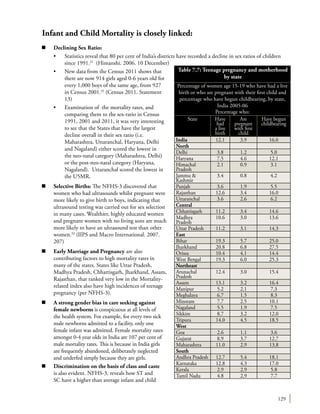
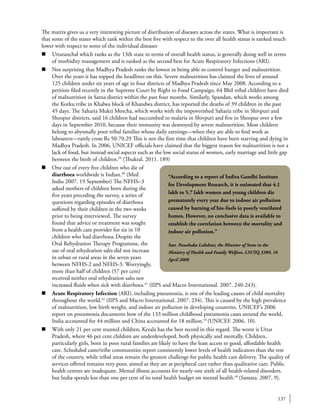
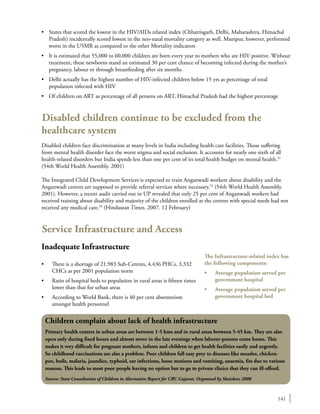
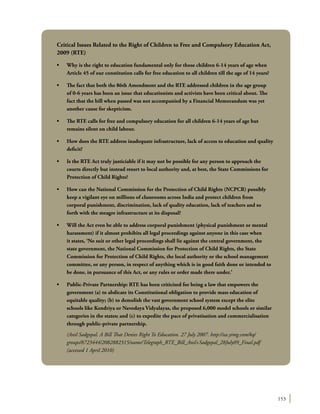
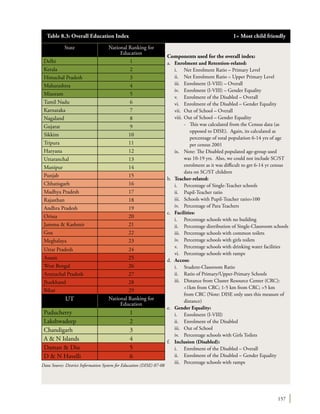
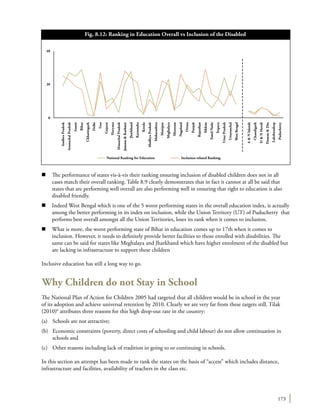
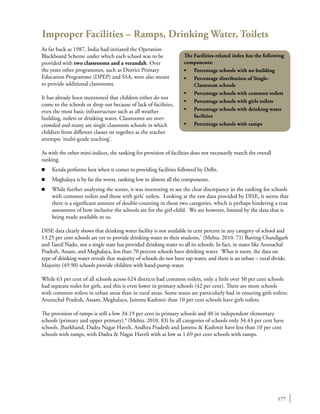
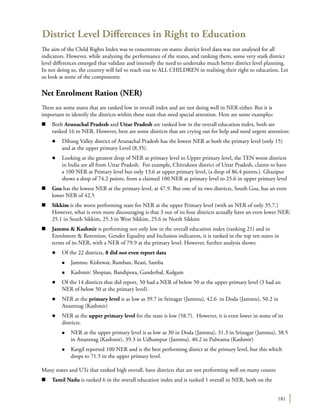
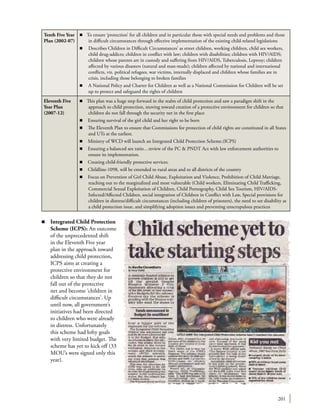
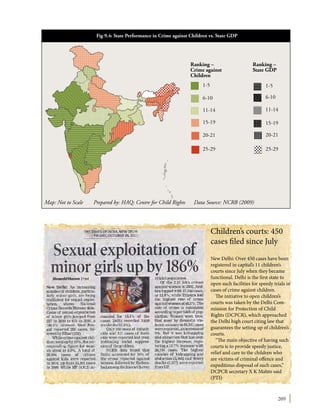
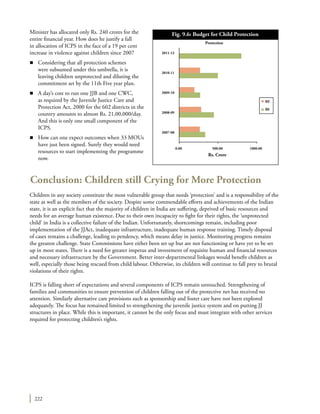
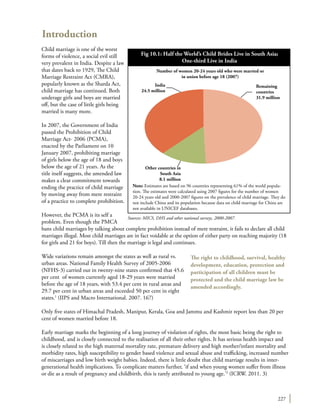
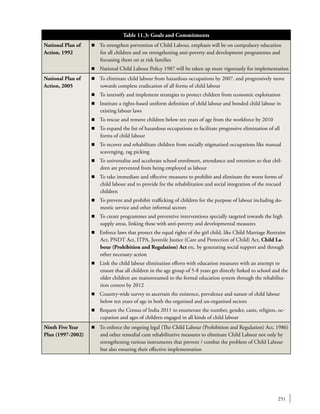
When Protectors Turn Abusers
Our experience at HAQ: Centre for Child Rights
shows us every day that protectors have turned abusers
themselves. Children face violence in families, in schools
and in the institutions set up to give refuge to street
children. Children with disabilities, girl children and
orphans are often exposed as perpetrating violence against
their wards.
Besides incest, some of the most unfortunate
manifestations of
child abuse that one
finds in the country
today are the ones
where children suffer
at the hands their
own protectors. This
includes:
• Female foeticide
and infanticide
• Child marriage
• Domestic
violence
• Custodial rape
• Institutional
Violence
As we know, many of these do not get recorded and enumerated as the perpetrators are invariably those meant
to protect children. Traditionally, the Indian society is a fairly conservative society, where children continue
to be treated as extensions of their parents. Thus, what the parents or caregivers do for them or to them is
often perceived as beyond any questioning. Only in recent times, studies have thrown light on the need
to protect children from abuse even at home, breaking the myth of home as the safest haven. As professor
Savitri Goonesekere states, “the child’s right to family privacy and the focus on parental responsibility in
the Convention [UNCRC] means that in some senses the family is beyond scrutiny. The child’s right to
survival, development, protection and participation are identified with the family’s interest in the child on the
assumption that the family will fulfill its responsibilities to the children. Nevertheless, the Convention’s concept
of ‘protection’ permits state intervention to safeguard a child in circumstances where the family is dysfunctional
or is not fulfilling its responsibilities…This concept of state intervention is the very source of the child’s
protection rights.”8
(Goonesekere. 1998. 252)
Child Sexual Abuse
Sexual abuse in the NCRB can be found under rape and
incest, but it is only in the context of girls. The NCRB
unfortunately does not provide data on sexual abuse of
boys. It is frequently assumed that sexual abuse occurs
While all forms of child abuse cut across
caste and class barriers, discrimination on
grounds of gender and caste undoubtedly
rule the crime and abuse roster.](https://image.slidesharecdn.com/india-child-rights-index-151015094255-lva1-app6891/85/India-Child-Rights-Index-220-320.jpg)

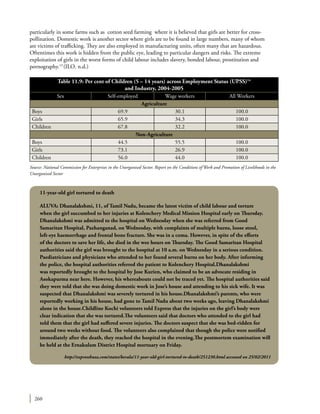

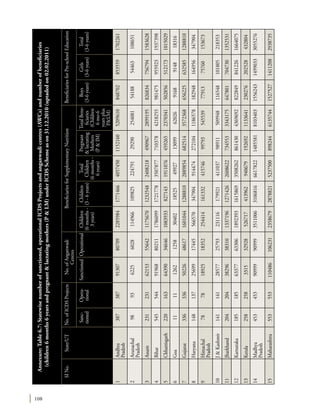
The document presents the India Child Rights Index, developed by Haq: Centre for Child Rights, aimed at assessing and ranking the performance of states and union territories in fulfilling children's rights across various sectors. It highlights the methodology used, including indicators related to birth registration, health, education, and child labor, while emphasizing the need for credible and comprehensive data. The index aims to identify areas requiring attention to promote inclusive development for children in India.


![Child labour presentation[1]](https://cdn.slidesharecdn.com/ss_thumbnails/childlabourpresentation1-150424065128-conversion-gate02-thumbnail.jpg?width=640&height=640&fit=bounds)


