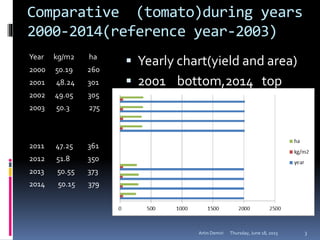
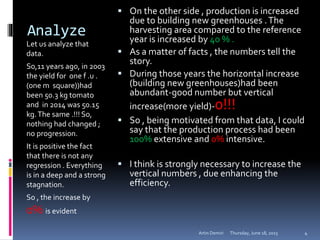
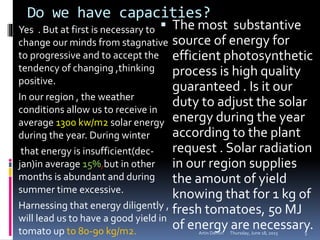
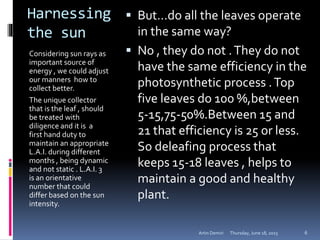
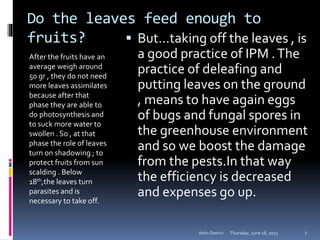
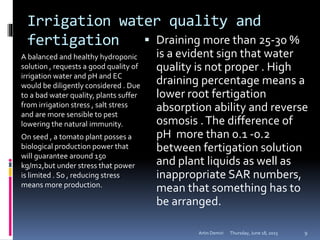
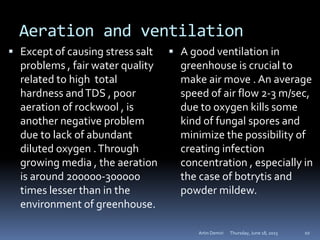
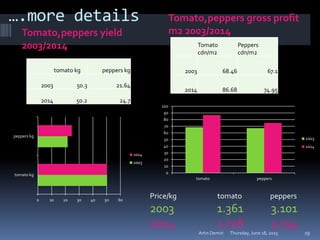
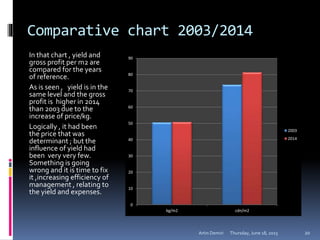
INCREASING VEGETABLE
GREENHOUSE EFFICIENCY
Ontario
prospect
Thursday, June 18, 2015Artin Demiri 1
Let us ask ourselves....
 ..is it necessary?
 To answer to that question at
first it is necessary to know
our abilities to progress ; our
capacities and skills,
intellectual level and
scientific experience.
 In that context most
important step is if we have
a positive desire to do that
and do we accept the
tendency to make changes
on our mentality and
practice?
 ….are we able and is it
possible?
 The passion without
having a real base is not
enough….and to put two
ends of the rope
together , the necessity
and passion ,we have to
analyze the actual
situation , to know
where we had been and
where to go in the
future.
Thursday, June 18, 2015Artin Demiri 2
Comparative (tomato)during years
2000-2014(reference year-2003)
Year kg/m2 ha
2000 50.19 260
2001 48.24 301
2002 49.05 305
2003 50.3 275
2011 47.25 361
2012 51.8 350
2013 50.55 373
2014 50.15 379
 Yearly chart(yield and area)
 2001 bottom,2014 top
Thursday, June 18, 2015Artin Demiri 3
Analyze
Let us analyze that
data.
So,11 years ago, in 2003
the yield for one f .u .
(one m square))had
been 50.3 kg tomato
and in 2014 was 50.15
kg.The same .!!! So,
nothing had changed ;
no progression.
It is positive the fact
that there is not any
regression . Everything
is in a deep and a strong
stagnation.
So , the increase by
0% is evident
 On the other side , production is increased
due to building new greenhouses .The
harvesting area compared to the reference
year is increased by 40 % .
 As a matter of facts , the numbers tell the
story.
 During those years the horizontal increase
(building new greenhouses)had been
abundant-good number but vertical
increase(more yield)-0!!!
 So , being motivated from that data, I could
say that the production process had been
100% extensive and 0% intensive.
 I think is strongly necessary to increase the
vertical numbers , due enhancing the
efficiency.
Thursday, June 18, 2015Artin Demiri 4
Do we have capacities?
Yes . But at first is necessary to
change our minds from stagnative
to progressive and to accept the
tendency of changing ,thinking
positive.
In our region , the weather
conditions allow us to receive in
average 1300 kw/m2 solar energy
during the year. During winter
that energy is insufficient(dec-
jan)in average 15%,but in other
months is abundant and during
summer time excessive.
Harnessing that energy diligently ,
will lead us to have a good yield in
tomato up to 80-90 kg/m2.
 The most substantive
source of energy for
efficient photosynthetic
process is high quality
guaranteed . Is it our
duty to adjust the solar
energy during the year
according to the plant
request . Solar radiation
in our region supplies
the amount of yield
knowing that for 1 kg of
fresh tomatoes, 50 MJ
of energy are necessary.Thursday, June 18, 2015Artin Demiri 5
Harnessing
the sun
Considering sun rays as
important source of
energy , we could adjust
our manners how to
collect better.
The unique collector
that is the leaf , should
be treated with
diligence and it is a
first hand duty to
maintain an appropriate
L.A.I. during different
months , being dynamic
and not static . L.A.I. 3
is an orientative
number that could
differ based on the sun
intensity.
 But…do all the leaves operate
in the same way?
 No , they do not .They do not
have the same efficiency in the
photosynthetic process .Top
five leaves do 100 %,between
5-15,75-50%.Between 15 and
21 that efficiency is 25 or less.
So deleafing process that
keeps 15-18 leaves , helps to
maintain a good and healthy
plant.
Thursday, June 18, 2015Artin Demiri 6
Do the leaves feed enough to
fruits?
After the fruits have an
average weigh around
50 gr , they do not need
more leaves assimilates
because after that
phase they are able to
do photosynthesis and
to suck more water to
swollen . So , at that
phase the role of leaves
turn on shadowing ; to
protect fruits from sun
scalding . Below
18th,the leaves turn
parasites and is
necessary to take off.
 But…taking off the leaves , is
a good practice of IPM .The
practice of deleafing and
putting leaves on the ground
, means to have again eggs
of bugs and fungal spores in
the greenhouse environment
and so we boost the damage
from the pests.In that way
the efficiency is decreased
and expenses go up.
Thursday, June 18, 2015Artin Demiri 7
Drain water and leaves on
the ground
Drain water is a source of increasing humidity
on the ground and together with high
temperature on the pipe area , influence
negatively to boost more the population of
whiteflies , powder mildew , spider mites etc.
It is a very huge and expensive mistake!
Thursday, June 18, 2015Artin Demiri 8
Irrigation water quality and
fertigation
A balanced and healthy hydroponic
solution , requests a good quality of
irrigation water and pH and EC
would be diligently considered . Due
to a bad water quality, plants suffer
from irrigation stress , salt stress
and are more sensible to pest
lowering the natural immunity.
On seed , a tomato plant posses a
biological production power that
will guarantee around 150
kg/m2,but under stress that power
is limited . So , reducing stress
means more production.
 Draining more than 25-30 %
is a evident sign that water
quality is not proper . High
draining percentage means a
lower root fertigation
absorption ability and reverse
osmosis .The difference of
pH more than 0.1 -0.2
between fertigation solution
and plant liquids as well as
inappropriate SAR numbers,
mean that something has to
be arranged.
Thursday, June 18, 2015Artin Demiri 9
Aeration and ventilation
 Except of causing stress salt
problems , fair water quality
related to high total
hardness andTDS , poor
aeration of rockwool , is
another negative problem
due to lack of abundant
diluted oxygen .Through
growing media , the aeration
is around 200000-300000
times lesser than in the
environment of greenhouse.
 A good ventilation in
greenhouse is crucial to
make air move . An average
speed of air flow 2-3 m/sec,
due to oxygen kills some
kind of fungal spores and
minimize the possibility of
creating infection
concentration , especially in
the case of botrytis and
powder mildew.
Thursday, June 18, 2015Artin Demiri 10
The synergy of growing factors
All the growth factor act
in the same time , so
finding an optimum is
very crucial.That
optimum needs to be
flexible variating in time
and according growth
phases of plant . Finding
optimum will help to
seed up the rate of
blooming and settings
fruit .The amount of light
in ideal conditions for
tomato plant to set
flowers is 1000 lux ,every
where in planet ,but the
problem is are we able to
speed up that process ,to
induce plants to set more
flowers?
 Reducing stress , means to
create to plants possibilities
to put more vigor to
reproduction organs , to
produce more flowers and
more fruits per unit of length .
So , depend of those
conditions , it is possible a set
of flowers each 7,5-9,5 days
Thursday, June 18, 2015Artin Demiri 11
Integrating
tools
 All the technical tools than
we use , have not any value
if the level of labor and
management is not proper
to fit agrotechnique .Labor
management is important
tool to arrange all the plant
requests and to create a
balance and harmony
during all the growing
season.
 As a first step , a clear and
comprehensive
instruction is considered
to be very important .The
instruction have to be the
same and to be
transferred without any
loss from the owner to
the workers.
 Let me explain
that…giving an hierarchy
production chart and the
effect of proper
instruction in every step.
Thursday, June 18, 2015Artin Demiri 12
Production
hierarchy
The instruction of the
owner should be
transferred 100% to the
workers level . If the
instruction are not clear
and professional to all the
workers , a lot of mistakes
and misunderstandings
will have negative impacts
over the growth process .
E.g…. if a supervisor is not
able to give all the
instruction s for 40
workers, a half percent
less the instruction of the
owner is lost 20%;so the
efficiency will be lowered
by 20% or more.
 workers
Thursday, June 18, 2015Artin Demiri 13
owner
gro
wer
Ass
gr
s
p
Labor
 Labor is expensive and
according to specific
data for operative
expenses in 2014 ,16
cdn/m2 are spent and
knowing that operative
expenses per m2 were
61 cdn, that part is
26%.That is only
unskill part of gross
payroll.
 It should have been
approximately 4 cdn less
/m2 and in that way not
only expenses are
increased but the
production is dicreased ,
because from that
mismanagement , crop
work is not done at time
causing delays according
to the plant phases.
Thursday, June 18, 2015Artin Demiri 14
Negative impact
 Based on my opinion and
data,labor management
has had a negative
impact during the years
causing a huge impasse
on the yield.
 To have a better picture
of that impact let us
consider again the
reference year 2003.Yield
in greenhouse tomatoes
was 50.3 kg/m2.
 …and in 2014,50.2
kg/m2.What is the
reason that have caused
that “snail progression”?
 From my analyze , I have
found out that that the
level of technology used
is high , of growers and
consultants is scientific
and high expertise but
the supervising level is
too low .The educational
professional level is
moderate based in
empirical experience.
Thursday, June 18, 2015Artin Demiri 15
Scientific experience
Not having enough
level of expertise and
professional education
is a huge negative
impact to progress.
During those years ,
due to lack of that
scientific experience,
from 2003,the profit in
greenhouse industry is
guaranteed only from
price and building new
greenhouses.
Let us look over the
numbers……
 2003 greenhouse tomato
 Yield 50.3 kg/m2
 Gross profit 68.5 cdn/m2
 Price 1.361 cdn/kg
 Harvested area 275 ha(605 ac)
 2014
 Yield 50.2 kg/m2
 Gross profit 86.7 cdn/m2
 Price 1.728 cdn/kg
 Harvested area 379 ha(936 ac)
 …the numbers tell the story!!!
Thursday, June 18, 2015Artin Demiri 16
Comparative data
Gross profit difference
2014-2003 is 18.2
cdn/m2..
There are three
components that
influence gross profit
1. Yield
2. Total production
3. Price per kg
In our comparative
case the influence of
yield is 0 meanwhile all
the quantity of
production is result of
increasing harvested
area and increase of
gross profit/m2 is result
of farm gate value.
 As a final conclusion ,
increase of gross profit m2 is
result price increase and in
general gross profit is price
dependent.
 So , doing a specific
calculation we could find out
that compared with the year
of reference , influence of
price over gross profit had
been 24% and of harvested
area 76%.
Thursday, June 18, 2015Artin Demiri 17
Other greenhouse data
Let us see
the general
production
and farm
gate value
between
2003
and
2014
Ontario Acres
Average total
production
Prod TomatoPeppers CucumbersArea Kg/m2
Kg Kg Kg acre
2003 138346000 13200000 62210000 1148 46
Area/ha 260 144 61 465
2014 190041000 89077000 141222134 2550 40.7
Area/ha 380 360 294 1034
Farm
gate Cdn Cdn Cdn Cdn/m2
2003 188274000 40935000 81700000 1148 66.92
2014328358000 270268000 241105000 2550 81.37
Thursday, June 18, 2015Artin Demiri 18
….more details
Tomato,peppers yield
2003/2014
Tomato,peppers gross profit
m2 2003/2014
tomato kg peppers kg
2003 50.3 21.64
2014 50.2 24.7
Tomato
cdn/m2
Peppers
cdn/m2
2003 68.46 67.1
2014 86.68 74.95
Thursday, June 18, 2015Artin Demiri 19
0 10 20 30 40 50 60
tomato kg
peppers kg
2014
2003
0
10
20
30
40
50
60
70
80
90
100
tomato peppers
2003
2014
Price/kg tomato peppers
2003 1.361 3.101
2014 1.728 3.034
Comparative chart 2003/2014
In that chart , yield and
gross profit per m2 are
compared for the years
of reference.
As is seen , yield is in the
same level and the gross
profit is higher in 2014
than 2003 due to the
increase of price/kg.
Logically , it had been
the price that was
determinant ; but the
influence of yield had
been very very few.
Something is going
wrong and it is time to fix
it ,increasing efficiency of
management , relating to
the yield and expenses.
Thursday, June 18, 2015Artin Demiri 20
0
0.2
0.4
0.6
0.8
1
1.2
0
10
20
30
40
50
60
70
80
90
kg/m2 cdn/m2
2003
2014
Let us increase the
efficiency……
 …to have better and guaranteed yields and to
be more competitive and more independent
to the price fluctuations.
 Let us manage all the possibilities and
manipulate all the tools that we have.
 Doing our best with the purpose of
increasing efficiency putting the scientific
experience , means more profit…..let’s go
ahead to realize our target and to increase
gross margin up to 40% from 25% actual.
Thursday, June 18, 2015Artin Demiri 21

Increasing vegetable greenhouse

  • 1.
  • 2.
    Let us askourselves....  ..is it necessary?  To answer to that question at first it is necessary to know our abilities to progress ; our capacities and skills, intellectual level and scientific experience.  In that context most important step is if we have a positive desire to do that and do we accept the tendency to make changes on our mentality and practice?  ….are we able and is it possible?  The passion without having a real base is not enough….and to put two ends of the rope together , the necessity and passion ,we have to analyze the actual situation , to know where we had been and where to go in the future. Thursday, June 18, 2015Artin Demiri 2
  • 3.
    Comparative (tomato)during years 2000-2014(referenceyear-2003) Year kg/m2 ha 2000 50.19 260 2001 48.24 301 2002 49.05 305 2003 50.3 275 2011 47.25 361 2012 51.8 350 2013 50.55 373 2014 50.15 379  Yearly chart(yield and area)  2001 bottom,2014 top Thursday, June 18, 2015Artin Demiri 3
  • 4.
    Analyze Let us analyzethat data. So,11 years ago, in 2003 the yield for one f .u . (one m square))had been 50.3 kg tomato and in 2014 was 50.15 kg.The same .!!! So, nothing had changed ; no progression. It is positive the fact that there is not any regression . Everything is in a deep and a strong stagnation. So , the increase by 0% is evident  On the other side , production is increased due to building new greenhouses .The harvesting area compared to the reference year is increased by 40 % .  As a matter of facts , the numbers tell the story.  During those years the horizontal increase (building new greenhouses)had been abundant-good number but vertical increase(more yield)-0!!!  So , being motivated from that data, I could say that the production process had been 100% extensive and 0% intensive.  I think is strongly necessary to increase the vertical numbers , due enhancing the efficiency. Thursday, June 18, 2015Artin Demiri 4
  • 5.
    Do we havecapacities? Yes . But at first is necessary to change our minds from stagnative to progressive and to accept the tendency of changing ,thinking positive. In our region , the weather conditions allow us to receive in average 1300 kw/m2 solar energy during the year. During winter that energy is insufficient(dec- jan)in average 15%,but in other months is abundant and during summer time excessive. Harnessing that energy diligently , will lead us to have a good yield in tomato up to 80-90 kg/m2.  The most substantive source of energy for efficient photosynthetic process is high quality guaranteed . Is it our duty to adjust the solar energy during the year according to the plant request . Solar radiation in our region supplies the amount of yield knowing that for 1 kg of fresh tomatoes, 50 MJ of energy are necessary.Thursday, June 18, 2015Artin Demiri 5
  • 6.
    Harnessing the sun Considering sunrays as important source of energy , we could adjust our manners how to collect better. The unique collector that is the leaf , should be treated with diligence and it is a first hand duty to maintain an appropriate L.A.I. during different months , being dynamic and not static . L.A.I. 3 is an orientative number that could differ based on the sun intensity.  But…do all the leaves operate in the same way?  No , they do not .They do not have the same efficiency in the photosynthetic process .Top five leaves do 100 %,between 5-15,75-50%.Between 15 and 21 that efficiency is 25 or less. So deleafing process that keeps 15-18 leaves , helps to maintain a good and healthy plant. Thursday, June 18, 2015Artin Demiri 6
  • 7.
    Do the leavesfeed enough to fruits? After the fruits have an average weigh around 50 gr , they do not need more leaves assimilates because after that phase they are able to do photosynthesis and to suck more water to swollen . So , at that phase the role of leaves turn on shadowing ; to protect fruits from sun scalding . Below 18th,the leaves turn parasites and is necessary to take off.  But…taking off the leaves , is a good practice of IPM .The practice of deleafing and putting leaves on the ground , means to have again eggs of bugs and fungal spores in the greenhouse environment and so we boost the damage from the pests.In that way the efficiency is decreased and expenses go up. Thursday, June 18, 2015Artin Demiri 7
  • 8.
    Drain water andleaves on the ground Drain water is a source of increasing humidity on the ground and together with high temperature on the pipe area , influence negatively to boost more the population of whiteflies , powder mildew , spider mites etc. It is a very huge and expensive mistake! Thursday, June 18, 2015Artin Demiri 8
  • 9.
    Irrigation water qualityand fertigation A balanced and healthy hydroponic solution , requests a good quality of irrigation water and pH and EC would be diligently considered . Due to a bad water quality, plants suffer from irrigation stress , salt stress and are more sensible to pest lowering the natural immunity. On seed , a tomato plant posses a biological production power that will guarantee around 150 kg/m2,but under stress that power is limited . So , reducing stress means more production.  Draining more than 25-30 % is a evident sign that water quality is not proper . High draining percentage means a lower root fertigation absorption ability and reverse osmosis .The difference of pH more than 0.1 -0.2 between fertigation solution and plant liquids as well as inappropriate SAR numbers, mean that something has to be arranged. Thursday, June 18, 2015Artin Demiri 9
  • 10.
    Aeration and ventilation Except of causing stress salt problems , fair water quality related to high total hardness andTDS , poor aeration of rockwool , is another negative problem due to lack of abundant diluted oxygen .Through growing media , the aeration is around 200000-300000 times lesser than in the environment of greenhouse.  A good ventilation in greenhouse is crucial to make air move . An average speed of air flow 2-3 m/sec, due to oxygen kills some kind of fungal spores and minimize the possibility of creating infection concentration , especially in the case of botrytis and powder mildew. Thursday, June 18, 2015Artin Demiri 10
  • 11.
    The synergy ofgrowing factors All the growth factor act in the same time , so finding an optimum is very crucial.That optimum needs to be flexible variating in time and according growth phases of plant . Finding optimum will help to seed up the rate of blooming and settings fruit .The amount of light in ideal conditions for tomato plant to set flowers is 1000 lux ,every where in planet ,but the problem is are we able to speed up that process ,to induce plants to set more flowers?  Reducing stress , means to create to plants possibilities to put more vigor to reproduction organs , to produce more flowers and more fruits per unit of length . So , depend of those conditions , it is possible a set of flowers each 7,5-9,5 days Thursday, June 18, 2015Artin Demiri 11
  • 12.
    Integrating tools  All thetechnical tools than we use , have not any value if the level of labor and management is not proper to fit agrotechnique .Labor management is important tool to arrange all the plant requests and to create a balance and harmony during all the growing season.  As a first step , a clear and comprehensive instruction is considered to be very important .The instruction have to be the same and to be transferred without any loss from the owner to the workers.  Let me explain that…giving an hierarchy production chart and the effect of proper instruction in every step. Thursday, June 18, 2015Artin Demiri 12
  • 13.
    Production hierarchy The instruction ofthe owner should be transferred 100% to the workers level . If the instruction are not clear and professional to all the workers , a lot of mistakes and misunderstandings will have negative impacts over the growth process . E.g…. if a supervisor is not able to give all the instruction s for 40 workers, a half percent less the instruction of the owner is lost 20%;so the efficiency will be lowered by 20% or more.  workers Thursday, June 18, 2015Artin Demiri 13 owner gro wer Ass gr s p
  • 14.
    Labor  Labor isexpensive and according to specific data for operative expenses in 2014 ,16 cdn/m2 are spent and knowing that operative expenses per m2 were 61 cdn, that part is 26%.That is only unskill part of gross payroll.  It should have been approximately 4 cdn less /m2 and in that way not only expenses are increased but the production is dicreased , because from that mismanagement , crop work is not done at time causing delays according to the plant phases. Thursday, June 18, 2015Artin Demiri 14
  • 15.
    Negative impact  Basedon my opinion and data,labor management has had a negative impact during the years causing a huge impasse on the yield.  To have a better picture of that impact let us consider again the reference year 2003.Yield in greenhouse tomatoes was 50.3 kg/m2.  …and in 2014,50.2 kg/m2.What is the reason that have caused that “snail progression”?  From my analyze , I have found out that that the level of technology used is high , of growers and consultants is scientific and high expertise but the supervising level is too low .The educational professional level is moderate based in empirical experience. Thursday, June 18, 2015Artin Demiri 15
  • 16.
    Scientific experience Not havingenough level of expertise and professional education is a huge negative impact to progress. During those years , due to lack of that scientific experience, from 2003,the profit in greenhouse industry is guaranteed only from price and building new greenhouses. Let us look over the numbers……  2003 greenhouse tomato  Yield 50.3 kg/m2  Gross profit 68.5 cdn/m2  Price 1.361 cdn/kg  Harvested area 275 ha(605 ac)  2014  Yield 50.2 kg/m2  Gross profit 86.7 cdn/m2  Price 1.728 cdn/kg  Harvested area 379 ha(936 ac)  …the numbers tell the story!!! Thursday, June 18, 2015Artin Demiri 16
  • 17.
    Comparative data Gross profitdifference 2014-2003 is 18.2 cdn/m2.. There are three components that influence gross profit 1. Yield 2. Total production 3. Price per kg In our comparative case the influence of yield is 0 meanwhile all the quantity of production is result of increasing harvested area and increase of gross profit/m2 is result of farm gate value.  As a final conclusion , increase of gross profit m2 is result price increase and in general gross profit is price dependent.  So , doing a specific calculation we could find out that compared with the year of reference , influence of price over gross profit had been 24% and of harvested area 76%. Thursday, June 18, 2015Artin Demiri 17
  • 18.
    Other greenhouse data Letus see the general production and farm gate value between 2003 and 2014 Ontario Acres Average total production Prod TomatoPeppers CucumbersArea Kg/m2 Kg Kg Kg acre 2003 138346000 13200000 62210000 1148 46 Area/ha 260 144 61 465 2014 190041000 89077000 141222134 2550 40.7 Area/ha 380 360 294 1034 Farm gate Cdn Cdn Cdn Cdn/m2 2003 188274000 40935000 81700000 1148 66.92 2014328358000 270268000 241105000 2550 81.37 Thursday, June 18, 2015Artin Demiri 18
  • 19.
    ….more details Tomato,peppers yield 2003/2014 Tomato,peppersgross profit m2 2003/2014 tomato kg peppers kg 2003 50.3 21.64 2014 50.2 24.7 Tomato cdn/m2 Peppers cdn/m2 2003 68.46 67.1 2014 86.68 74.95 Thursday, June 18, 2015Artin Demiri 19 0 10 20 30 40 50 60 tomato kg peppers kg 2014 2003 0 10 20 30 40 50 60 70 80 90 100 tomato peppers 2003 2014 Price/kg tomato peppers 2003 1.361 3.101 2014 1.728 3.034
  • 20.
    Comparative chart 2003/2014 Inthat chart , yield and gross profit per m2 are compared for the years of reference. As is seen , yield is in the same level and the gross profit is higher in 2014 than 2003 due to the increase of price/kg. Logically , it had been the price that was determinant ; but the influence of yield had been very very few. Something is going wrong and it is time to fix it ,increasing efficiency of management , relating to the yield and expenses. Thursday, June 18, 2015Artin Demiri 20 0 0.2 0.4 0.6 0.8 1 1.2 0 10 20 30 40 50 60 70 80 90 kg/m2 cdn/m2 2003 2014
  • 21.
    Let us increasethe efficiency……  …to have better and guaranteed yields and to be more competitive and more independent to the price fluctuations.  Let us manage all the possibilities and manipulate all the tools that we have.  Doing our best with the purpose of increasing efficiency putting the scientific experience , means more profit…..let’s go ahead to realize our target and to increase gross margin up to 40% from 25% actual. Thursday, June 18, 2015Artin Demiri 21