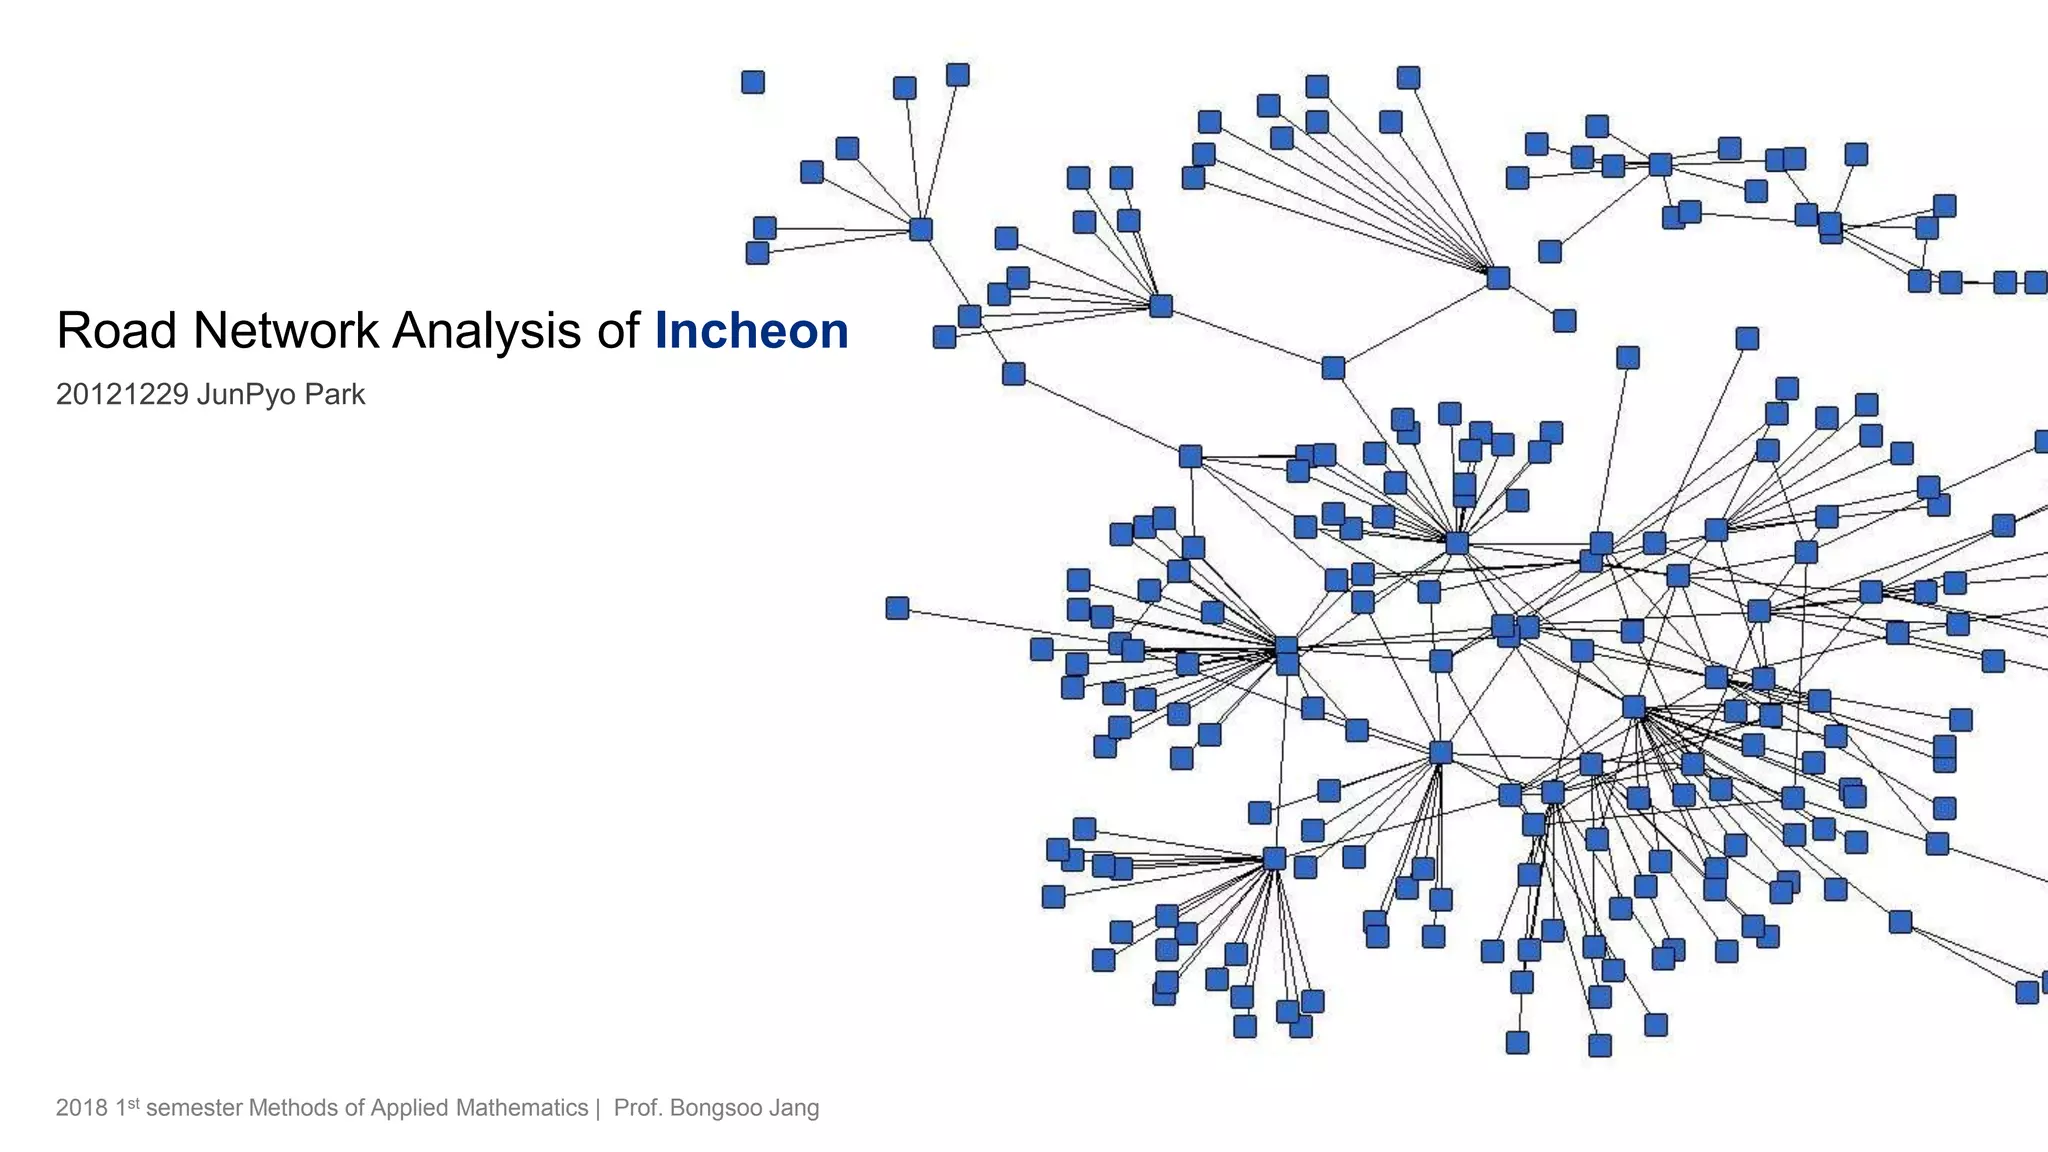
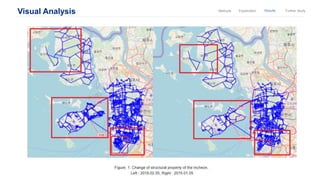
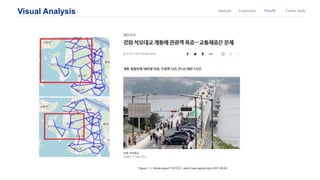
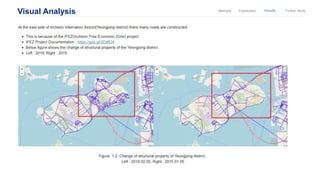
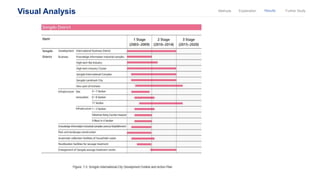
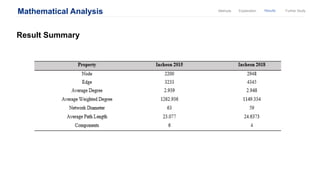
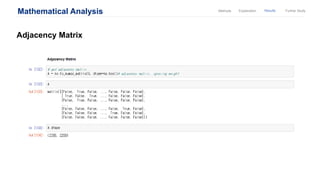
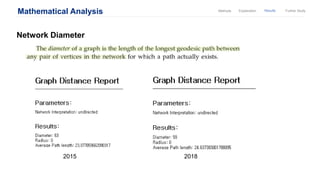
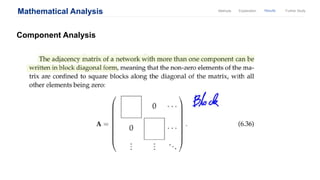
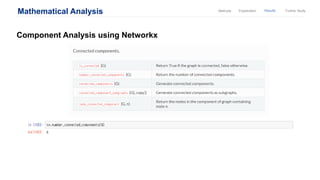
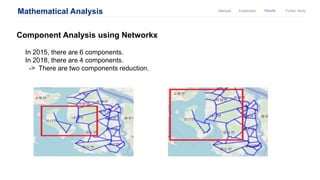
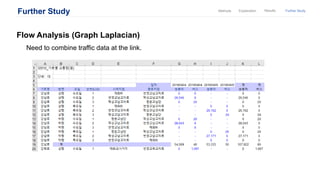
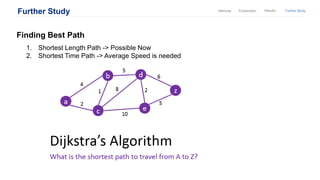
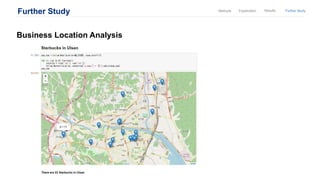
Road Network Analysis of Incheon
20121229 JunPyo Park
2018 1st semester Methods of Applied Mathematics | Prof. Bongsoo Jang
Contents
1. Methods
ResultsExplanationMethods Further Study
Road Network Analysis
Gephi
Visualization and Analysis Tool
ResultsExplanationMethods Further Study
Road Network Analysis
Folium
2. Code Explanation
Brief Description
Road Network Analysis
Exception Handling
ResultsExplanationMethods Further Study
Road Network Analysis
Calculating Road Length
-Assumption : The Earth is “sphere”
ResultsExplanationMethods Further Study
Road Network Analysis
Calculating Road Length
ResultsExplanationMethods Further Study
Road Network Analysis
Edges Data Table
ResultsExplanationMethods Further Study
3. Result Analysis
3-1. Visual Analysis
Visual Analysis ResultsExplanationMethods Further Study
3. Result Analysis
3-2. Mathematical Analysis
Mathematical Analysis ResultsExplanationMethods Further Study
Result Summary
Mathematical Analysis ResultsExplanationMethods Further Study
Adjacency Matrix
Mathematical Analysis ResultsExplanationMethods Further Study
Number of Length r Cycles
Mathematical Analysis ResultsExplanationMethods Further Study
Number of Length r Cycles_2015
Mathematical Analysis ResultsExplanationMethods Further Study
Number of Length r Cycles_2018
Mathematical Analysis ResultsExplanationMethods Further Study
Comparison
Mathematical Analysis ResultsExplanationMethods Further Study
Network Diameter
2015 2018
Mathematical Analysis ResultsExplanationMethods Further Study
Component Analysis
Mathematical Analysis ResultsExplanationMethods Further Study
Component Analysis using Networkx
Mathematical Analysis ResultsExplanationMethods Further Study
Component Analysis using Networkx
In 2015, there are 6 components.
In 2018, there are 4 components.
-> There are two components reduction.
5. Further Study
Some topics
Further Study ResultsExplanationMethods Further Study
Flow Analysis (Graph Laplacian)
Need to combine traffic data at the link.
Further Study ResultsExplanationMethods Further Study
Finding Best Path
1. Shortest Length Path -> Possible Now
2. Shortest Time Path -> Average Speed is needed
Further Study ResultsExplanationMethods Further Study
Business Location Analysis
Question?
Thank you

Incheon Road Network Analysis-Midterm Project

Editor's Notes

  • #2 Hello, I am JunPyo Park and I’ll talk about my midterm project.
  • #3 This is the contents.
  • #4 First I introduce some method I used in my project.
  • #5 This is Gephi used for Visualization and Analysis tool
  • #6 Folium is python data visualization module, we can handle interactive map easily by using this.
  • #7 Okay, this chapter, I’ll explain some part of my python code and logics
  • #8 Okay, this is exception handling code, brief figure is like this Because of ‘and’ notation here, we only select True, True for our links You can find the number is reduced from 6464 to 6421
  • #9 I calculate the length between two nodes and add it for weight of each links. In here assumption is The Earth is “sphere”, then we can apply this spherical coordinate length formula
  • #10 This is the Python code for calculating length between two nodes and I put this length into weight attribute
  • #11 You can see the weight attribute here, Gephi Edge data table
  • #12 Okay, I’ll show some results. First let’s take a look at visualization result.
  • #13 Okay this is the comparison of visualization result. 날짜 언급 Let’s take a look at one by one.
  • #14 Okay, this Bridge name is '석모대교’ , we can find an article about ‘석모대교’ which was opened since 2017-06-28
  • #15 Let’s take a look at next spot, here is Yeongjong district and there many roads are constructed.
  • #16 Here is the development outline for this project.
  • #17 And this is corresponding action plan.
  • #19 This is also a development outline
  • #20 And this is action plan for Songdo District, one can see, now is in the 3rd stage
  • #21 Okay next thing is Mathematical Analysis
  • #22 This is the brief summary of results. Node, Edge, Average Degree are increasing. However Average Weighted Degree is decreasing, we can interpret it as a “Oh there many short roads are constructed!” Okay, let’s take look at other thing one by one.
  • #23 Using Networkx’s built in function we can get adj matrix A
  • #24 I find length r cycles, using this formula
  • #25 This is the result of 2015, in here you can see all even length has same number of cycles. It is very trivial result (up down) * n
  • #26 Same for 2018
  • #27 And this is comparison result as we expected, in 2018 the number of length r cycles is larger than 2015
  • #28 Here is the definition of network diameter and result Diameter is decreasing and average path length is increasing little bit
  • #29 Component could be calculated by make the adj matrix to block_diagonal form (with edge order permutation) Then number of block is components
  • #30 Networkx support this number_connected_components function
  • #31 There are two components reduction. I don’t know where the one came from but I exactly know where the other one is came from It is obviously due to the constuction of '석모대교'
  • #32 Okay, let’s see the further study topics
  • #33 First is flow analysis We need to combine traffic data at the link for doing this. This dataset needed to be pre processed to fit our node-link dataset. Our data is undirected but this are direct data set it has direction 상행, 하행
  • #34 Next topic is finding best path. There are two kinds of best path, first is shortest length path and second is shortest time path. Applying algorithm here is same “Dijkstra’s Algorithm” Since we use ‘length’ to our link’s weight, we can do the first one, but second case, we have to know the consuming time for passing each link. To do so, we have to know the average speed for each road.
  • #35 Last one is “Business Location Analysis”, this figure shows the 23 STARBUCKS at Ulsan. If we combine traffic, population density or other data, we can do some analysis of STARBUCKS location and may find out the rule of STARBUCS’s location selection strategy.