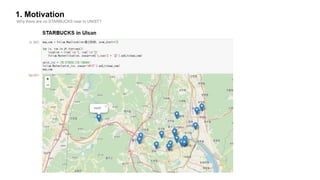
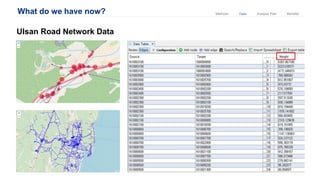
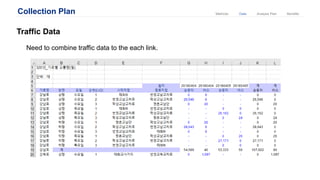
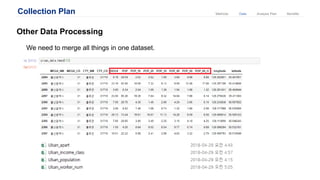
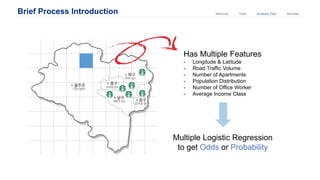
STARBUCKS Site Selection Analysis
20121229 JunPyo Park
20161349 JaeHo Kim
2018 1st semester MTH211 Statistics | Prof. JungHan Hong
Contents
1. Motivation
1. Team Profile
Team Name : The ONI
Team Vision : Endless charms that transcends nations
JunPyo Park
Majoring in Mathematical Science
Process Design
Data Analysis
Data Visualization
JaeHo Kim
Majoring in Management Engineering
Collect Data
Data Preprocessing
Deliver Insight
2. Methods
Analysis PlanDataMethods BenefitsGephi : Network Analysis Tool
Gephi
Visualization and Analysis Tool
Folium : GIS Analysis Tool
Folium
Analysis PlanDataMethods Benefits
3. Data
Data Collection Plan
What do we have now?
Ulsan Road Network Data
Analysis PlanDataMethods Benefits
Collection Plan
Traffic Data
Need to combine traffic data to the each link.
Analysis PlanDataMethods Benefits
Collection Plan
Other Data Processing
We need to merge all things in one dataset.
Analysis PlanDataMethods Benefits
4. Analysis Plan
Brief Process Introduction
Brief Process Introduction Analysis PlanDataMethods Benefits
Has Multiple Features
- Longitude & Latitude
- Road Traffic Volume
- Number of Apartments
- Population Distribution
- Number of Office Worker
- Average Income Class
Multiple Logistic Regression
to get Odds or Probability
5. Expected Benefits Analysis PlanDataMethods Benefits
Who is expected to benefit from our project?
- A CEO trying to increase the number of its franchise
- A person who needs a quantitative value of expected benefits of a
certain location
- A real estate agent trying to persuade customers using quantitative
values
- A person who is trying to invest in a certain company
Question?
Thank you

Statistics project outline team the oni

  • 1.
    STARBUCKS Site SelectionAnalysis 20121229 JunPyo Park 20161349 JaeHo Kim 2018 1st semester MTH211 Statistics | Prof. JungHan Hong
  • 2.
  • 3.
  • 4.
    1. Team Profile TeamName : The ONI Team Vision : Endless charms that transcends nations JunPyo Park Majoring in Mathematical Science Process Design Data Analysis Data Visualization JaeHo Kim Majoring in Management Engineering Collect Data Data Preprocessing Deliver Insight
  • 5.
  • 6.
    Analysis PlanDataMethods BenefitsGephi: Network Analysis Tool Gephi Visualization and Analysis Tool
  • 7.
    Folium : GISAnalysis Tool Folium Analysis PlanDataMethods Benefits
  • 8.
  • 9.
    What do wehave now? Ulsan Road Network Data Analysis PlanDataMethods Benefits
  • 10.
    Collection Plan Traffic Data Needto combine traffic data to the each link. Analysis PlanDataMethods Benefits
  • 11.
    Collection Plan Other DataProcessing We need to merge all things in one dataset. Analysis PlanDataMethods Benefits
  • 12.
    4. Analysis Plan BriefProcess Introduction
  • 13.
    Brief Process IntroductionAnalysis PlanDataMethods Benefits Has Multiple Features - Longitude & Latitude - Road Traffic Volume - Number of Apartments - Population Distribution - Number of Office Worker - Average Income Class Multiple Logistic Regression to get Odds or Probability
  • 14.
    5. Expected BenefitsAnalysis PlanDataMethods Benefits Who is expected to benefit from our project? - A CEO trying to increase the number of its franchise - A person who needs a quantitative value of expected benefits of a certain location - A real estate agent trying to persuade customers using quantitative values - A person who is trying to invest in a certain company
  • 15.
  • 16.

Editor's Notes

  • #2 Hello this is Team The ONI and I am the presenter JunPyo Park, I’ll talk about our topic.
  • #3 This is the Contents
  • #4 Here is motivation, Why there are no STARBUCKS near to UNIST? As you can see, here is UNIST and STARBUCKS are over there, there are no STARBUCKS near to UNIST
  • #5 Okay this is Team Profile Our team name is The ONI and team vision is Endless cha….. I’m JunPyo Park ….. And He is Jae Ho Kim ….
  • #6 I’ll introduce some tools that we’ll using for this project
  • #7 This is Gephi, Network Analysis and Visualization Tool
  • #8 This is folium, it is GIS Analysis Tool We can make interactive map like this figure, easily
  • #9 Okay, now I’ll show you about Data Collection Plan
  • #10 Okay, before introducing the collection plan, I’ll show what do we have now. We now have the road network data for whole Ulsan. We have Node, Edges, and it’s length as a edge weight.
  • #11 This is collection plan, we have to combine this traffic data into our node dataset.
  • #12 And this is for other data, population, apartment, income_class, number of office worker… etc… Figure shows the number of house and population distribution for each unit area.
  • #13 Next I’ll briefly show our analysis plan
  • #14 Okay, this is Ulsan Map. We divide it into appropriate lattice like this. Then for each unit cell, it has multiple features Conducting multiple logistic regression, we can get Odds or Probability, something that could be regarded as a location score.
  • #15 Okay, this is expected benefits for our project.