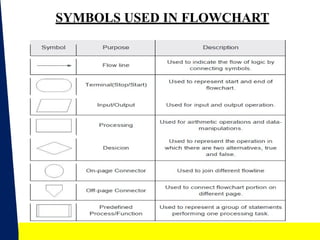
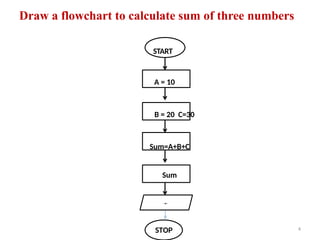
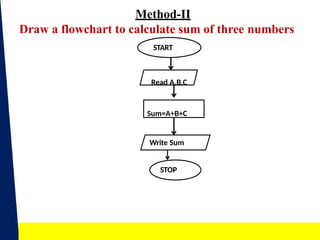
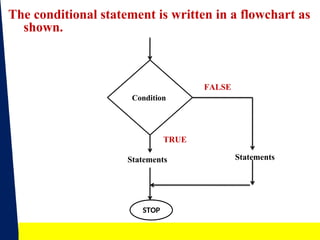
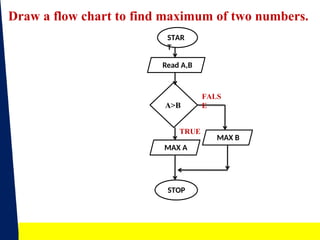
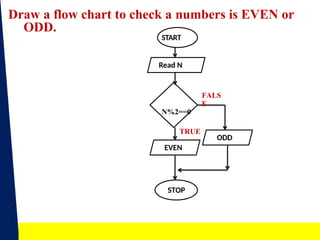
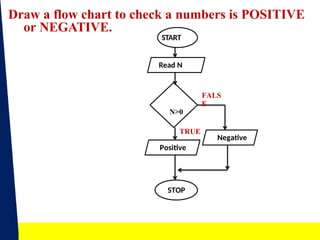
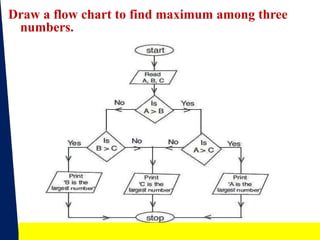
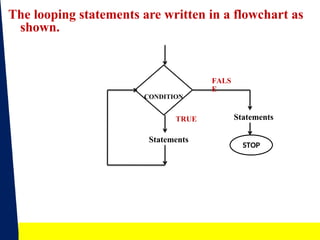
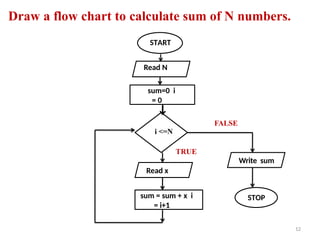
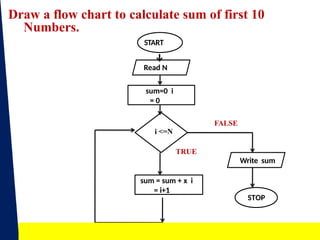
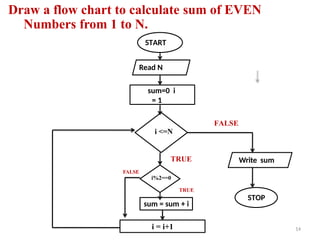
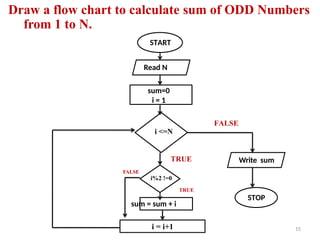
Programming For Problem Solving
“Flowchart”
1
2
INTRODUCTION
 Flowchart is a diagrammatic representation of an algorithm. Flowchart
is very helpful in writing program and explaining program to others.
 Different symbols are used for different states in flowchart, For
example: Input/output and decision making has different symbols.
 The table below describes all the symbols that are used in making
flowchart.
SYMBOLS USED IN FLOWCHART
3
Draw a flowchart to calculate sum of three numbers
4
STOP
START
A = 10
B = 20 C=30
Sum=A+B+C
Sum
Method-II
Draw a flowchart to calculate sum of three numbers
Write Sum
STOP
START
Read A,B,C
Sum=A+B+C
5
The conditional statement is written in a flowchart as
shown.
Statements Statements
STOP
6
FALSE
Condition
TRUE
Draw a flow chart to find maximum of two numbers.
A>B
Read A,B
STAR
T
MAX B
MAX A
STOP
7
TRUE
FALS
E
Draw a flow chart to check a numbers is EVEN or
ODD.
START
ODD
EVEN
STOP
8
TRUE
Read N
FALS
E
N%2==0
Draw a flow chart to check a numbers is POSITIVE
or NEGATIVE.
START
Negative
Positive
STOP
9
TRUE
Read N
FALS
E
N>0
Draw a flow chart to find maximum among three
numbers.
10
The looping statements are written in a flowchart as
shown.
Statements
Statements
STOP
11
TRUE
FALS
E
CONDITION
Draw a flow chart to calculate sum of N numbers.
STOP
START
Read N
sum=0 i
= 0
sum = sum + x i
= i+1
FALSE
i <=N
TRUE
Write sum
Read x
12
STOP
Draw a flow chart to calculate sum of first 10
Numbers.
START
Read N
sum=0 i
= 0
sum = sum + x i
= i+1
FALSE
i <=N
TRUE
Write sum
13
Draw a flow chart to calculate sum of EVEN
Numbers from 1 to N.
STOP
TRUE
START
Read N
sum=0 i
= 1
Write sum
sum = sum + i
FALSE
i <=N
FALSE
i%2==0
TRUE
i = i+1 14
Draw a flow chart to calculate sum of ODD Numbers
from 1 to N.
STOP
TRUE
START
Read N
sum=0
i = 1
Write sum
sum = sum + i
FALSE
i <=N
FALSE
i%2 !=0
TRUE
i = i+1 15
Thank You
16

In c language programming flowchart.pptx

  • 1.
    Programming For ProblemSolving “Flowchart” 1
  • 2.
    2 INTRODUCTION  Flowchart isa diagrammatic representation of an algorithm. Flowchart is very helpful in writing program and explaining program to others.  Different symbols are used for different states in flowchart, For example: Input/output and decision making has different symbols.  The table below describes all the symbols that are used in making flowchart.
  • 3.
    SYMBOLS USED INFLOWCHART 3
  • 4.
    Draw a flowchartto calculate sum of three numbers 4 STOP START A = 10 B = 20 C=30 Sum=A+B+C Sum
  • 5.
    Method-II Draw a flowchartto calculate sum of three numbers Write Sum STOP START Read A,B,C Sum=A+B+C 5
  • 6.
    The conditional statementis written in a flowchart as shown. Statements Statements STOP 6 FALSE Condition TRUE
  • 7.
    Draw a flowchart to find maximum of two numbers. A>B Read A,B STAR T MAX B MAX A STOP 7 TRUE FALS E
  • 8.
    Draw a flowchart to check a numbers is EVEN or ODD. START ODD EVEN STOP 8 TRUE Read N FALS E N%2==0
  • 9.
    Draw a flowchart to check a numbers is POSITIVE or NEGATIVE. START Negative Positive STOP 9 TRUE Read N FALS E N>0
  • 10.
    Draw a flowchart to find maximum among three numbers. 10
  • 11.
    The looping statementsare written in a flowchart as shown. Statements Statements STOP 11 TRUE FALS E CONDITION
  • 12.
    Draw a flowchart to calculate sum of N numbers. STOP START Read N sum=0 i = 0 sum = sum + x i = i+1 FALSE i <=N TRUE Write sum Read x 12
  • 13.
    STOP Draw a flowchart to calculate sum of first 10 Numbers. START Read N sum=0 i = 0 sum = sum + x i = i+1 FALSE i <=N TRUE Write sum 13
  • 14.
    Draw a flowchart to calculate sum of EVEN Numbers from 1 to N. STOP TRUE START Read N sum=0 i = 1 Write sum sum = sum + i FALSE i <=N FALSE i%2==0 TRUE i = i+1 14
  • 15.
    Draw a flowchart to calculate sum of ODD Numbers from 1 to N. STOP TRUE START Read N sum=0 i = 1 Write sum sum = sum + i FALSE i <=N FALSE i%2 !=0 TRUE i = i+1 15
  • 16.