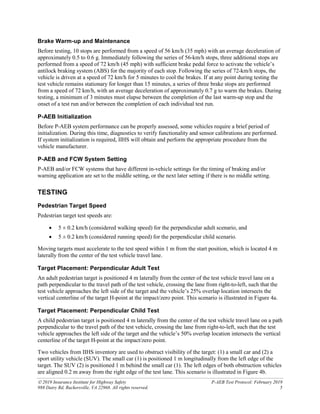
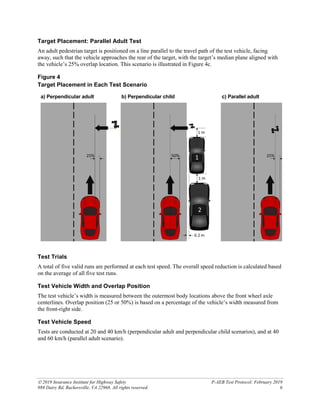
This document describes a test protocol for evaluating pedestrian autonomous emergency braking (P-AEB) systems on passenger vehicles. It outlines three test scenarios where the vehicle encounters an adult, child, or adult pedestrian. Ratings are based on the vehicle's ability to avoid or mitigate collisions with the pedestrian dummy at various speeds. The test environment, target details, vehicle preparation, testing procedures, and scoring system are defined to standardize P-AEB evaluation.
IRJET- GIS based Road Safety Audit of State Highways in ThrissurIRJET Journal
This document summarizes a study that conducted road safety audits on two state highways in Thrissur, India. The study divided the road sections into 500m segments and identified crash spots based on accident data from police stations. Road inventory data was collected using a checklist of parameters. The data was transformed and classified for analysis. Crash analysis was conducted to identify locations and severities of crashes over five years. Key findings were that sections with steep curves and poor visibility had more crashes, and some bus stops were too close to intersections. The study aims to help identify crash risks and improve road safety.
Road accidents are caused by a combination of factors related to road conditions, driver behavior, and vehicle characteristics. Poor road conditions such as roughness, rutting, cracking, and low skid resistance are contributing factors in a significant percentage of accidents. Maintaining adequate road quality through measures such as resurfacing and realignment can reduce accidents by 25-60%. Proper maintenance and repair of road defects can lower accident rates and safety costs. Monitoring road measurements like IRI and PSI that indicate roughness and conducting friction testing helps identify high-risk locations and control skid resistance.
accident report for cars
form for accident report
blue report for accident
accident reports for nc
the best study method
effective study methods
causes of accidents
factors affecting accidents
how accident data are collected
The spectacular growth of the automobile as one of the most convenient modes of travel has brought in its wake frustrating problems of parking, accidents, delay, congestion, etc. It is no longer sufficient to build roads of adequate structural strength to cater to the needs of vehicles, but it is equally important that the safe, efficient and comfortable movement of traffic and other road user is ensured on these roads. Highway intersections are nodes of road networks and accident - prone locations. They are the places where vehicles coming from different approaches and moving towards different directions interact and conflict with each other. Due to the conflicts from all users, more traffic crashes could happen at unsignalized intersection as compared with roadway segments. This study is fully based on the existing conditions of unsignalized intersection, including geometric design, sight distance, traffic control devices etc. The problems of parking, accidents and delay are also prevailing in the area under our study i.e. intersection at 26th mile. The intersection is an unsignalized one and therefore, the chances of accidents during the peak hours are very high. Since, it is a meeting point of a national highway and a state highway, the variation in the design speed of both roads also interrupts the traffic flow. Our study on the intersection at 26th mile mainly aims at improving the geometrical as well as the safety features of the intersection like accident control by signal installation, incorporation of proper sight distances, uninterrupted traffic flow without causing crashes, delay, etc.
Road way Condition Of Panthapath-Russell Square IntersectionMd.Abu Raihan Asif
The document summarizes a study of road conditions on the Panthapath-Russell Square road in Dhaka. Various manual and automatic methods were used to collect data on intersection conditions, signals, roadway, roadside features, structures, street lights, dividers and markings. The intersections experience heavy traffic controlled by police. Many issues were found such as poor signals, cracks, potholes and encroachments. Recommendations include improved signs, markings and facilities for pedestrians. Limitations include resource constraints and unreliable manual methods.
The Effect of Speed Camera Warning Sign on Vehicle Speed in School Zones musuthm
Driving too fast is one of the most prevalent factors that contribute to traffic crashes. In school zones,
staying alert and obeying the posted speed limit especially during the school period are imperative for public safety,
particularly involving children. Encouraging motorists to travel at safe speeds through the installation of yellow
transverse bars at Seri Sabak Uni School and Pintas Puding School was found to be ineffective. Drivers were
observed to have violated the 30 km/h speed limit and more seriously, driven over the speed limits of adjoining
roads. Consequently, speed camera warning signs were erected as a pre-emptive measure to curtail speeding
problems in the school zones. From impact studies carried out to measure the effectiveness of these signs, it was
found that the speed camera warning signs were also not able to change driver behavior.
This document summarizes research on roadside hazards on non-freeway roads. It defines key terms like roadside furniture, roadside obstacle, and roadside hazard. It then analyzes 236,000 accident records in Maryland from 1970-1972 to identify characteristics of single-vehicle, fixed-object accidents. Field investigations were conducted at 105 accident sites that accounted for 13.5% of such accidents. Common factors identified included narrow rights-of-way, accidents occurring on curves and with objects within 4.5 meters of the roadway, and outdated designs of objects like drainage facilities and guardrails.
This document describes a study that developed statistical models to predict traffic accident rates on rural highways in Egypt. Accident data and road/traffic characteristics were collected from 5 agricultural highways. Simple and multiple regression analysis identified that pavement width and running speed had the highest effects on accident rates for roads with undivided sections. The study aims to help decision-makers improve road safety by minimizing predicted accident rates.
Influence of Skidded Distance on the Initial Velocity of Vehicle in Chain Acc...IJMER
International Journal of Modern Engineering Research (IJMER) is Peer reviewed, online Journal. It serves as an international archival forum of scholarly research related to engineering and science education.
This document summarizes a study about traffic accidents. It discusses the causes of accidents which include road users, vehicles, road conditions, and environmental factors. Some specific causes mentioned are excessive speed, careless driving, vehicle defects, road design issues, and weather conditions. The document also outlines the process for collecting accident data through reports, location files, and diagrams. It describes how accident investigations are conducted by analyzing evidence like skid marks and road conditions. Finally, it proposes measures to reduce accident rates, such as improving road design, enforcing traffic rules, conducting medical checks of drivers, and providing better road lighting.
IRJET- Identification of Accident Black Spots: Jalgaon To BhusawalIRJET Journal
This document discusses the identification of accident black spots on National Highway 6 from Jalgaon to Bhusawal in Maharashtra, India. The researchers collected accident data from police stations along the 21 km stretch from 2014-2017. They analyzed the data to identify seven black spots with the highest number of accidents. The maximum fatal accidents occurred at Godavari College of Engineering, while the maximum injuries occurred at Jakat Naka. The researchers suggested remedial measures like installing speed breakers, traffic signals, road markings, and guard rails to reduce accidents at the identified black spots.
The document summarizes a one week trial of Intercepta, a smart radar camera, on the access road of a mine site. Over 2,963 vehicles were recorded, with 903 exceeding the speed limit. The highest speed was 124 km/h. While heavy vehicles complied, 92% of light vehicles exceeded limits. Speeding peaked around 5pm daily. The report recommends continued monitoring, identifying repeat offenders, and driver safety training to improve compliance and safety.
1) The document outlines the grading of faults on an Irish driving test report form. Faults are graded as grade 1 (minor), grade 2 (more serious) or grade 3 (dangerous/potentially dangerous).
2) It describes what constitutes a failure of the driving test, including incurring grade 3 faults, too many of the same grade 2 fault in one aspect, or a total of 9 or more grade 2 faults overall.
3) Technical checks that are assessed include being able to describe checks of tires, lights, fluids, and controls for things like brakes and steering. For larger vehicles, additional systems are checked appropriate to the vehicle type.
IRJET- Intelligent Overloading Prevention System in TrucksIRJET Journal
This document summarizes an intelligent system to prevent overloading in trucks. The system uses sensors to detect when a truck's load exceeds a preset limit. It then alerts the driver with a buzzer and light. If the overloaded truck approaches an enforcement checkpoint, a receiver detects the checkpoint's signal and activates a siren to alert authorities. Authorities can also stop an overloaded truck remotely if the driver does not stop. The system aims to reduce road damage from overloaded trucks and improve safety by automatically enforcing load limits.
This document provides an executive summary and background for the ATLAS project, which aims to develop an Advanced Traffic Light Approach System. The summary discusses:
- Common aggressive driving behaviors around traffic lights and the goal of helping drivers adopt a more efficient "turtle" approach.
- Research that identified driver needs like information on traffic light windows and reducing emissions/fuel use, but also a desire to remain in control.
- The development of a statement of requirements based on interviews and how those were weighted in a quality function deployment analysis.
- The proposed solution called ATLAS, which processes signals to provide optimal energy output for each traffic light window based on location, speed and road conditions.
- The goal
This document provides information about a road safety engineering course taught by Dr. G Narendra Goud. The course code is OE 801 CE and the title is Road Safety Engineering. It is an elective course with 3 credits. The document outlines the units that will be covered, including accident analysis, different collision types (head-on, left turn, rear-end, etc.), traffic calming schemes, accident studies and records, causes of road accidents, the 5Es of road safety, pedestrian safety issues, and diagnosis of road crash problems. Key aspects of accident analysis, data collection and black spot identification are also summarized.
IRJET- Passing Opportunity Model of Vehicles on Two Lane Undivided Highways u...IRJET Journal
The document presents a study on developing a passing opportunity model for vehicles on two-lane undivided highways under mixed traffic conditions. Data was collected through a moving car method and video recording on two highway sections. The study analyzed factors such as traffic density, opposing gap, speed of overtaking/overtaken/opposing vehicles, and type of opposing vehicle. A logit model was developed using binary logistic regression, showing that passing opportunity depends on density in the opposite direction, type and speed of opposing vehicle, opposing gap, and speed of the overtaking vehicle. The model had high accuracy in predicting drivers' passing decisions.
This document provides an overview of road safety audits for rural roads in India. It discusses the road safety situation in India, outlines the road safety audit process, and provides checklists to audit various elements of rural road design and construction. The document was submitted by three students for their Master's degree in transportation engineering at the National Institute of Technology in Hamirpur, India under the guidance of Associate Professor Dr. Sunil Sharma. It aims to help reduce accidents and improve safety on rural roads through a formal road safety audit process.
IRJET- Study of Geometric Features of Road and Accident RateIRJET Journal
1. The study analyzed the geometric features of roads, including horizontal radius, visibility, super elevation, gradient, and their relationship to accident rates.
2. Traffic data was collected on the Waghbil road, including 18,749 total vehicles counted per day. Various preventative measures were recommended based on the road's high traffic levels and features.
3. The analysis concluded that implementing bypass roads, speed limit signs, diverging signs, and road studs could help reduce accidents by promoting safer driving on roads with certain geometric characteristics.
The International Journal of Engineering & Science is aimed at providing a platform for researchers, engineers, scientists, or educators to publish their original research results, to exchange new ideas, to disseminate information in innovative designs, engineering experiences and technological skills. It is also the Journal's objective to promote engineering and technology education. All papers submitted to the Journal will be blind peer-reviewed. Only original articles will be published.
The papers for publication in The International Journal of Engineering& Science are selected through rigorous peer reviews to ensure originality, timeliness, relevance, and readability.
Study of Road Safety Audit in Municipal Area’sIRJET Journal
This document summarizes a study of road safety at an intersection near Akurdi railway station in Pune, India. Traffic and pedestrian surveys were conducted at the intersection, called Dharmraj Chowk. The studies found traffic volumes exceeding the road's design capacity and insufficient width of footpaths for pedestrians. Issues identified included improper lane markings, missing pedestrian signals and signs, and an improperly arranged traffic island. The study aims to conduct a road safety audit, identify safety deficiencies, and develop mitigating strategies to improve safety for vehicles and pedestrians at the intersection.
1.Safety Evaluation of a Highway using IRAP 1 (2).pdfpushraj5
This document summarizes an IRAP assessment of a 2.2km to 4.2km section of NH314 in Bankura district, West Bengal. The assessment found mixed star ratings of 1-5 for different road users, with most sections rated 2 stars for pedestrians and motorcyclists. Countermeasures proposed to improve safety included adding delineation, improving skid resistance, school zone signs, a separated path for bicyclists and pedestrians, and a median barrier. When modeled, these countermeasures increased the star ratings along one selected section to over 3 stars, improving safety for all road users.
IDENTIFICATION OF BLACKSPOTS IN PALA-THODUPUZHA ROADAND RECOMMENDATION OF REM...IRJET Journal
This document summarizes a study that aimed to identify accident-prone locations (blackspots) along the Pala-Thodupuzha road in Kerala, India. The researchers used speed profile data collected from test drives along the road to identify locations with high speed variability, which may indicate dangerous spots. They also analyzed accident reports from local police stations between 2019-2021. The study found several locations with many accidents and high speed variability, identifying them as blackspots. Recommendations for remedial measures are provided to improve safety.
An evaluation of jute epoxy-hybrid composite materials for automotive frontal...eSAT Journals
Abstract The present work evaluates the occupant safety and the mechanical behavior of the Jute-Epoxy-Glass hybrid composite materials and to carry out dynamic analysis of an automobile car frontal components like Bumper beam by using Jute-Epoxy-Glass Hybrid composite material by FE approach. In the present study, HYPERMESH and LS-DYNA software is employed to obtain a better composite material. Durability, NVH, Crash safety and Aesthetics are some of the important vehicle attributes that need to be meet the vehicle manufacturer. While the crash safety for NHTSA requires the G level should be less then 40G'S at the occupant seat. Initially manufacturing of 4 ply, 6 ply (Jute-Epoxy) and 5 ply (Jute-Glass-Epoxy) laminates is done and there characterization is done under Quasi static (1mm/min) and Impact High strain rate loading (100mm/min and 200mm/min) for tensile tests. The mechanical properties obtained are set for the existing bumper beam of a meshed model. For bumper beam of a car with a given velocity of 56 km/h according to the NHTSA high speed crash test. For a high speed crash speed test of bumper beam the G levels is taken into consideration so that the G levels acting upon the occupant doesn't cross 40 G'S as safer. The results obtained from high strain rate of 200mm/min tensile tests explore to bumper beam for which G level acting on the occupant is 35 G's for hybrid jute glass epoxy with 6mm thickness which is found to be best suited composite material which is safer for the occupant and also the weight reduction is also considered where conventionally used steel is 6.6 kgs and the hybrid material of Jute-Glass-Epoxy is 2.9 kgs these weight savings leads to fuel efficiency of the car. Keywords: Hybrid composites, NHTSA, Ls-Dyna, High strain rate And G levels etc…
A Longitudinal Channelizing Barricade (LCD) is a federally-designated type of traffic barricade. LCDs are designed to provide visual guidance for motorists and pedestrians. They do not provide positive protection. An LCD fills the void in safety between the hazard that concrete barrier posses to motorists versus the gaps in lines of drums that allow vehicles and pedestrians into the work zone!
This study analyzed 20 cases of vehicle accidents using engineering principles to determine the influence of pavement friction on initial vehicle velocity. Regression analysis found a strong linear correlation (R=0.997) between initial velocity and pavement friction. Higher pavement friction values resulted in lower initial velocities for vehicles in accidents. The study utilized conservation of energy principles and calculated variables like deceleration, initial velocity, and weight ratios between vehicles. Regression analysis found pavement friction to be a significant predictor of initial vehicle velocity in vehicle accidents.
Straddle carriers are commonly used at ports to transport containers but often experience accidents. To reduce accidents, ports can implement training programs to ensure only authorized operators drive the carriers. Access control systems using ID cards can restrict carrier operation to only trained operators and provide an audit trail of usage. Installing LED floodlights improves visibility and safety compared to traditional lights.
Khushmeet Khushi Resume of manufacturing industry Khushmeet Khushi
A result oriented professional working for Process and New Technology of Manufacturing industry presently associated with Manufacturing Industry as
Asst. Manager in Research & Development. Skilled in manufacturing Process of various type of cords, cables, connector, wire Harness, Remote Control devices, Switches including backward integration thereof. Acquired knowledge of New product and process development, QMS, Compliance and product certification, IPQC, Product & process Stranded, Lean Manufacturing Methodology, and problem solving methodology, VAVE, Etc.
Kalyan chart DP boss guessing matka results➑➌➋➑➒➎➑➑➊➍
8328958814Satta Matka is a number-based game. There are several markets, each with its owner responsible for releasing the lottery satta Matka market results on time. Kalyan market, Worli market, main Mumbai market, Rajdhani market, and Milan market are some of the main markets or bazaars involved in the satta Matka game. The oldest and most legitimate markets are in Kalyan and Main Mumbai. Every Satta Market has an open and close time. The satta results for these markets are published on or shortly after the open and close times. During the open result, two numbers are decoded, one of which is a three-digit number and the other a single-digit number. Similarly, three-digit and single-digit numbers are declared during the satta market's close. The last digit after adding the three digits of the open or close result is usually the single digit declared during the open and close results.KALYAN MATKA | MATKA RESULT | KALYAN MATKA TIPS | SATTA MATKA | MATKA.COM | MATKA PANA JODI TODAY | BATTA SATKA | MATKA PATTI JODI NUMBER | MATKA RESULTS | MATKA CHART | MATKA JODI | SATTA COM | FULL RATE GAME | MATKA GAME | MATKA WAPKA | ALL MATKA RESULT LIVE ONLINE | MATKA RESULT | KALYAN MATKA RESULT | DPBOSS MATKA 143 | MAINSATTA MATKA SATTA FAST RESULT KALYAN TOP MATKA RESULT KALYAN SATTA MATKA FAST RESULT MILAN RATAN RAJDHANI MAIN BAZAR MATKA FAST TIPS RESULT MATKA CHART JODI CHART PANEL CHART FREE FIX GAME SATTAMATKA ! MATKA MOBI SATTA 143 spboss.in TOP NO1 RESULT FULL RATE MATKA ONLINE GAME PLAY BY APP SPBOSSdp boss net, dp satta, dpboss dpboss, indian satta matka, kalyan matkà result today , matka boss, matka result live, matka satta result today, satamatka com, satta boss, satta matka king, sattamatkà, sattamatkà result, sattamatta com, sattmatka sattmatka, star matka, tara matka, tara satta matka, worli matka, indian matka, matka live, kalyan guessing, satta fix, kalyan final ank, dp matka, dpboss net, sata mata com, सट्टा मटका, sattamatkà 143, golden matka, satta matta matka 143, satta fast, kalyan open, satta 143, dpboss 143 guessing, dpboss satta, golden satta matka, satta bajar
Satta Matka Market is India's leading website providing the quickest sattamatka outcome, experienced in Satta Matka game. Our services include free Satta Matka Trick and Tips for Kalyan Matka and Disawar Satta King, as well as satta matka graphs, online play, tips and more. Our team of experts strive to help you recoup your losses quickly through our proposals such as Free Satta Matka Tips and Kalyan Bazar Tips. We are known as India's best Matka DpBoss portal site, here to deliver updates on all sorts of Satta Market like Kalyan Bazar, Milan, Rajdhani, Time Bazaar, Main and the most current charts. Stay tuned with us for more live updates on the Satta market
The semiochemicals market size has grown rapidly in
recent years. It will grow from $4.56 billion in 2023
to $5.37 billion in 2024 at a compound annual
growth rate (CAGR) of 17.6%. The growth in the
historic period can be attributed to market
acceptance and education, pest resistance concerns,
increased agricultural productivity demands,
chemical ecology research, growing advancements in
formulations. The semiochemicals market size is
expected to see rapid growth in the next few years. It
will grow to $9.67 billion in 2028 at a compound
annual growth rate (CAGR) of 15.9%.
2. 2019 Insurance Institute for Highway Safety P-AEB Test Protocol: February 2019
988 Dairy Rd, Ruckersville, VA 22968. All rights reserved. i
Contents
DOCUMENT REVISION HISTORY.......................................................................................................ii
SUMMARY .................................................................................................................................................1
TEST ENVIRONMENT ............................................................................................................................2
Surface and Markings................................................................................................................................2
Surroundings .............................................................................................................................................2
Ambient Conditions ..................................................................................................................................3
TARGET......................................................................................................................................................3
Pedestrian Target System for P-AEB Testing...........................................................................................3
TEST VEHICLE PREPARATION...........................................................................................................4
General ......................................................................................................................................................4
Instrumentation..........................................................................................................................................4
Brake Warm-up and Maintenance.............................................................................................................5
P-AEB Initialization..................................................................................................................................5
P-AEB and FCW System Setting..............................................................................................................5
TESTING.....................................................................................................................................................5
Pedestrian Target Speed............................................................................................................................5
Target Placement: Perpendicular Adult Test.............................................................................................5
Target Placement: Perpendicular Child Test.............................................................................................5
Target Placement: Parallel Adult Test.......................................................................................................6
Test Trials..................................................................................................................................................6
Test Vehicle Width and Overlap Position.................................................................................................6
Test Vehicle Speed....................................................................................................................................6
Test Vehicle Approach..............................................................................................................................7
Activation of Autonomous Emergency Braking.......................................................................................7
Forward Collision Warning.......................................................................................................................7
Impact Point ..............................................................................................................................................7
DATA ANALYSIS......................................................................................................................................8
Lateral and Longitudinal Positions............................................................................................................8
Longitudinal Acceleration.........................................................................................................................8
Speed.........................................................................................................................................................8
Speed Reduction........................................................................................................................................8
Yaw Rate...................................................................................................................................................8
SCORING AND RATING SYSTEM........................................................................................................8
REFERENCE............................................................................................................................................10
3. 2019 Insurance Institute for Highway Safety P-AEB Test Protocol: February 2019
988 Dairy Rd, Ruckersville, VA 22968. All rights reserved. ii
DOCUMENT REVISION HISTORY
Revisions from Version I to Version II of the protocol
• Changed test temperature range and wording to clarify target location, sun glare conditions, and
scoring.
4. 2019 Insurance Institute for Highway Safety P-AEB Test Protocol: February 2019
988 Dairy Rd, Ruckersville, VA 22968. All rights reserved. 1
SUMMARY
This protocol describes the test procedure used to evaluate pedestrian autonomous emergency braking (P-
AEB) systems on passenger vehicles similar to those that have been documented to help drivers avoid
collisions with pedestrians (Highway Loss Data Institute, 2018).
This protocol is available from the technical protocols section of the Insurance Institute for Highway
Safety (IIHS) website (http://www.iihs.org/iihs/ratings/technical-information/technical-protocols).
The procedure simulates vehicle collisions with 1) an adult pedestrian crossing a street on a path
perpendicular to the travel line of a vehicle, 2) a child pedestrian crossing a street from behind an
obstruction on a path perpendicular to the travel line of a vehicle, and 3) an adult pedestrian near the edge
of a road on a path parallel to the travel path of a vehicle.
Ratings are based on a test vehicle’s ability to avoid or mitigate pedestrian dummy collisions at 20 and 40
km/h (perpendicular path scenarios), and 40 and 60 km/h (parallel path scenario). A summary of these test
scenarios is included in Table 1.
Table 1
P-AEB Test Scenarios
Parameter
Scenario
Perpendicular adult
(CPNA-25)
Perpendicular child
(CPNC-50)
Parallel adult
(CPLA-25)
Test vehicle speed 20, 40 km/h 20, 40 km/h 40, 60 km/h
Pedestrian target speed 5 km/h 5 km/h 0 km/h
Target direction Crossing (R-to-L) Crossing (R-to-L) Facing away
Target path (relative to
test vehicle)
Perpendicular Perpendicular Parallel
Pedestrian dummy size Adult Child Adult
Dummy articulation
(fixed rate)
Yes Yes No
Overlap 25% 50% 25%
Obstructed No Yes No
Number of valid runs 5 5 5
Test diagram
5. 2019 Insurance Institute for Highway Safety P-AEB Test Protocol: February 2019
988 Dairy Rd, Ruckersville, VA 22968. All rights reserved. 2
TEST ENVIRONMENT
Surface and Markings
Tests are conducted on a dry asphalt surface without visible moisture. The surface is straight and flat,
with a 1% lateral slope for water management. The asphalt must be in good condition, free of potholes,
bumps, and/or cracks that could cause the test vehicle to pitch or roll excessively. Testing is conducted in
the right lane of a two-lane roadway. The roadway is marked with continuous solid white lane markers on
the outsides and dashed white lane markers in the center. The lane widths are 3.66 m (12 ft), and the
dashed lines are 3.05 m (10 ft) in length, separated by 9.14 m (30 ft). The width of the lines is 0.1 m (4
in). These dimensions are illustrated in Figure 1.
Figure 1
Lane Markings
Surroundings
During testing, no other vehicles, obstructions, or objects (except those prescribed in a test scenario) are
permitted within a distance of 3 m (9.8 ft) on either side of the test lane or 25 m (82.0 ft) longitudinal
distance from the test target. Overhead signs, bridges, gantries, or other significant structures within the
lane must be more than 5 m (16.4 ft) above the ground. Open space requirements are illustrated in Figure
2.
Figure 2
Open Space Around Target
3.66 m
3.05 m 9.14 m
6. 2019 Insurance Institute for Highway Safety P-AEB Test Protocol: February 2019
988 Dairy Rd, Ruckersville, VA 22968. All rights reserved. 3
Ambient Conditions
Testing is not conducted during periods of inclement weather. This includes, but is not limited to, rain,
snow, hail, fog, smoke, and/or ash. The ambient air temperature must be between −6.7°C (20°F) and
37.8°C (100°F) during testing. Peak wind speeds must be below 10 m/s (22.4 mph) to minimize target
and test vehicle disturbance. Ambient illumination must be at least 2,000 lux as measured on a plane
parallel to the asphalt surface in the vicinity of the target. To prevent sun glare issues with camera-based
vehicle sensors, the sun position must be ≥15 degrees above the horizon if the test vehicle is driving into
the sun.
During testing, track-area ambient temperature, light level, and wind speed and direction are measured
and recorded at 1-minute intervals.
TARGET
Pedestrian Target System for P-AEB Testing
IIHS uses 4active (4a) pedestrian test equipment for this test (see http://www.4activesystems.at/en/).
Static and articulating pedestrian dummies are shown in Figure 3. Pedestrian outer jackets must be free
from rips, tears, deformation, and significant markings, which could affect test results.
Figure 3
Pedestrian Targets
4activePA (child and adult articulating pedestrians) 4activePS (adult static pedestrian)
7. 2019 Insurance Institute for Highway Safety P-AEB Test Protocol: February 2019
988 Dairy Rd, Ruckersville, VA 22968. All rights reserved. 4
TEST VEHICLE PREPARATION
General
Tests are conducted using a new vehicle in the “as received” condition, with accumulated mileage
between 200 and 5,000 miles as indicated on the odometer. Prior to beginning preparation and testing,
IIHS ensures that:
1. The tires are new, original equipment tires inflated to the manufacturer’s recommended cold
inflation pressure. If more than one recommendation is provided, the tires are inflated to the lightly
loaded condition.
2. The fuel tank is filled to at least 90% of capacity with the appropriate fuel and maintained to at
least 75% capacity throughout the testing.
3. All other fluid reservoirs are filled to at least their minimum indicated levels.
Instrumentation
An instrumented test vehicle includes a driver and all required equipment during testing. Where possible,
the equipment is placed on the passenger side of the vehicle. The vehicle test weight should not exceed
vehicle curb weight by more than 200 kg (441 lb).
Test vehicles are equipped with an Oxford Scientific RT-Range inertial and GPS navigation system to
measure and record speed, longitudinal and lateral acceleration, longitudinal and lateral position, yaw
rate, and impact time. These data are sampled and recorded at a frequency of 100 Hz.
A Racelogic Video VBOX Pro is used to overlay data obtained from the Oxford RT-Range onto video
recorded at 30 FPS. One camera is positioned with a driver perspective facing out of the front windshield.
Other cameras are used to verify impact and record forward collision warnings (FCW).
Table 2 lists the equipment used in the test vehicle.
Table 2
Test Vehicle Instrumentation
Measurement Equipment
Speed Oxford RT-Range
Longitudinal and lateral acceleration Oxford RT-Range
Longitudinal and lateral position Oxford RT-Range
Yaw rate Oxford RT-Range
Impact time Oxford RT-Range
Forward collision warning Racelogic VBOX
IIHS uses a 4activeSB surfboard system for dynamic pedestrian tests to control and record dummy speed
and position.
8. 2019 Insurance Institute for Highway Safety P-AEB Test Protocol: February 2019
988 Dairy Rd, Ruckersville, VA 22968. All rights reserved. 5
Brake Warm-up and Maintenance
Before testing, 10 stops are performed from a speed of 56 km/h (35 mph) with an average deceleration of
approximately 0.5 to 0.6 g. Immediately following the series of 56-km/h stops, three additional stops are
performed from a speed of 72 km/h (45 mph) with sufficient brake pedal force to activate the vehicle’s
antilock braking system (ABS) for the majority of each stop. Following the series of 72-km/h stops, the
vehicle is driven at a speed of 72 km/h for 5 minutes to cool the brakes. If at any point during testing the
test vehicle remains stationary for longer than 15 minutes, a series of three brake stops are performed
from a speed of 72 km/h, with an average deceleration of approximately 0.7 g to warm the brakes. During
testing, a minimum of 3 minutes must elapse between the completion of the last warm-up stop and the
onset of a test run and/or between the completion of each individual test run.
P-AEB Initialization
Before P-AEB system performance can be properly assessed, some vehicles require a brief period of
initialization. During this time, diagnostics to verify functionality and sensor calibrations are performed.
If system initialization is required, IIHS will obtain and perform the appropriate procedure from the
vehicle manufacturer.
P-AEB and FCW System Setting
P-AEB and/or FCW systems that have different in-vehicle settings for the timing of braking and/or
warning application are set to the middle setting, or the next later setting if there is no middle setting.
TESTING
Pedestrian Target Speed
Pedestrian target test speeds are:
• 5 ± 0.2 km/h (considered walking speed) for the perpendicular adult scenario, and
• 5 ± 0.2 km/h (considered running speed) for the perpendicular child scenario.
Moving targets must accelerate to the test speed within 1 m from the start position, which is located 4 m
laterally from the center of the test vehicle travel lane.
Target Placement: Perpendicular Adult Test
An adult pedestrian target is positioned 4 m laterally from the center of the test vehicle travel lane on a
path perpendicular to the travel path of the test vehicle, crossing the lane from right-to-left, such that the
test vehicle approaches the left side of the target and the vehicle’s 25% overlap location intersects the
vertical centerline of the target H-point at the impact/zero point. This scenario is illustrated in Figure 4a.
Target Placement: Perpendicular Child Test
A child pedestrian target is positioned 4 m laterally from the center of the test vehicle travel lane on a path
perpendicular to the travel path of the test vehicle, crossing the lane from right-to-left, such that the test
vehicle approaches the left side of the target and the vehicle’s 50% overlap location intersects the vertical
centerline of the target H-point at the impact/zero point.
Two vehicles from IIHS inventory are used to obstruct visibility of the target: (1) a small car and (2) a
sport utility vehicle (SUV). The small car (1) is positioned 1 m longitudinally from the left edge of the
target. The SUV (2) is positioned 1 m behind the small car (1). The left edges of both obstruction vehicles
are aligned 0.2 m away from the right edge of the test lane. This scenario is illustrated in Figure 4b.
9. 2019 Insurance Institute for Highway Safety P-AEB Test Protocol: February 2019
988 Dairy Rd, Ruckersville, VA 22968. All rights reserved. 6
Target Placement: Parallel Adult Test
An adult pedestrian target is positioned on a line parallel to the travel path of the test vehicle, facing
away, such that the vehicle approaches the rear of the target, with the target’s median plane aligned with
the vehicle’s 25% overlap location. This scenario is illustrated in Figure 4c.
Figure 4
Target Placement in Each Test Scenario
a) Perpendicular adult b) Perpendicular child c) Parallel adult
Test Trials
A total of five valid runs are performed at each test speed. The overall speed reduction is calculated based
on the average of all five test runs.
Test Vehicle Width and Overlap Position
The test vehicle’s width is measured between the outermost body locations above the front wheel axle
centerlines. Overlap position (25 or 50%) is based on a percentage of the vehicle’s width measured from
the front-right side.
Test Vehicle Speed
Tests are conducted at 20 and 40 km/h (perpendicular adult and perpendicular child scenarios), and at 40
and 60 km/h (parallel adult scenario).
10. 2019 Insurance Institute for Highway Safety P-AEB Test Protocol: February 2019
988 Dairy Rd, Ruckersville, VA 22968. All rights reserved. 7
Test Vehicle Approach
At the start of each test, the test vehicle begins moving between 150 and 200 m from the target and
gradually accelerates toward the target. For 20-, 40-, and 60-km/h tests, the approach phase begins 25, 50,
and 75 m (corresponding to approximately 4.5 s time-to-collision (TTC)) from the target, respectively.
The approach phase ends when the test vehicle impacts the target, or the test vehicle stops before making
impact with the target. During the approach phase, the driver is required to:
• modulate the throttle using smooth inputs to maintain the nominal test speed,
• use the least amount of steering input necessary to maintain the test vehicle in the center of the
lane,
• avoid the use of abrupt steering inputs or corrections, and
• not touch the brake pedal.
For the test to be considered valid, the following criteria must be met during the approach phase until
impact with the target or activation of autonomous braking:
• vehicle speed must remain within ±1.0 km/h of the nominal test speed,
• yaw rate must remain within the range of ±1 °/s,
• lateral distance between the centerline of the test vehicle and the centerline of the lane must not
exceed ±0.1 m, and
• pedestrian speed must remain within the range of 5.0±1.0 km/h (except static target tests).
Activation of Autonomous Emergency Braking
The point at which the vehicle longitudinal deceleration reaches 0.5 m/s2
is considered the start of
autonomous emergency braking.
Forward Collision Warning
Audible and visible forward collision warnings are monitored and recorded in a video file. Onset timing
of whichever warning occurs first is recorded and used for scoring in some scenarios.
Impact Point
The impact point is measured using the Oxford system and is defined when and where the test vehicle
first contacts the pedestrian target. A camera or tape switch can be used to verify impact. Prior to each test
scenario, a zero point is established with the test vehicle and target aligned and touching at the impact
location.
11. 2019 Insurance Institute for Highway Safety P-AEB Test Protocol: February 2019
988 Dairy Rd, Ruckersville, VA 22968. All rights reserved. 8
DATA ANALYSIS
Lateral and Longitudinal Positions
Lateral and longitudinal positions are measured in meters, and raw data are used to evaluate the vehicle
position.
Longitudinal Acceleration
Longitudinal acceleration is measured with an accelerometer in m/s2
. Raw data are digitally filtered with a
12-pole phaseless Butterworth filter with a cutoff frequency of 6 Hz.
Speed
Speed is measured in km/h. Raw data are used to evaluate speed.
Speed Reduction
Speed reduction is calculated by subtracting the test vehicle speed at the time of impact from the test
vehicle speed prior to the activation of autonomous emergency braking. If the test vehicle does not
contact the target, the impact speed is zero. The test vehicle speed prior to the activation of autonomous
emergency braking is defined as the average speed calculated for 0.1 s immediately before autonomous
emergency braking begins.
Yaw Rate
The yaw rate is measured in degrees per second. Raw data are digitally filtered with a 12-pole phaseless
Butterworth filter with a cutoff frequency of 6 Hz.
SCORING AND RATING SYSTEM
Points are awarded per Table 3 based on the average speed reduction of five test runs at each speed in
each test scenario. Decimal values of average speed reduction are truncated before awarding points. One
additional point is awarded for vehicles with an average FCW timing greater than or equal to 2.1 s TTC in
the five 60-km/h parallel runs. The average FCW TTC value is rounded to tenths of a second. Partial
credit is not given for FCW.
Table 3
Points Awarded for
Average Speed Reduction
Speed reduction range
(km/h) Points
0 to 8 0.0
9 to 18 0.5
19 to 28 1.0
29 to 38 1.5
39 to 48 2.0
49 to 58 2.5
59 to 61 3.0
12. 2019 Insurance Institute for Highway Safety P-AEB Test Protocol: February 2019
988 Dairy Rd, Ruckersville, VA 22968. All rights reserved. 9
The points awarded are summed for both scenarios, and then two weighting factors are applied: 70% to
the perpendicular points subtotal and 30% to the parallel points subtotal. The product of each weighting
operation is rounded to tenths of a point. The total score is the sum of the two weighted subtotals. An
example score using the maximum possible points is shown in Table 4. The final rating scale is shown in
Table 5.
Table 4
Scoring Protocol
Maximum Points Example
Perpendicular Scenarios
Adult test speed
reduction points
Child test speed
reduction points
Points
subtotal
Weighted
subtotal (70%)
20 km/h 40 km/h 20 km/h 40 km/h
1.0 2.0 1.0 2.0 6.0 4.2
Parallel Scenario
Adult test speed reduction points
Points
subtotal
Weighted
subtotal (30%)
40 km/h 60 km/h 60 km/h FCW ≥ 2.1s
2.0 3.0 1.0 6.0 1.8
Overall Score
Perpendicular weighted subtotal Parallel weighted subtotal Total score
4.2 1.8 6.0
Table 5
Final Rating Scale
Total score range Rating Rating icon
Total score < 1 No credit
1 ≤ total score < 3 Basic
3 ≤ total score < 5 Advanced
Total score ≥ 5 Superior
13. 2019 Insurance Institute for Highway Safety P-AEB Test Protocol: February 2019
988 Dairy Rd, Ruckersville, VA 22968. All rights reserved. 10
REFERENCE
Highway Loss Data Institute. (2018). Effect of Subaru EyeSight on pedestrian-related bodily injury
liability claim frequency. HLDI Bulletin, 34(39). Arlington, VA.