Download to read offline

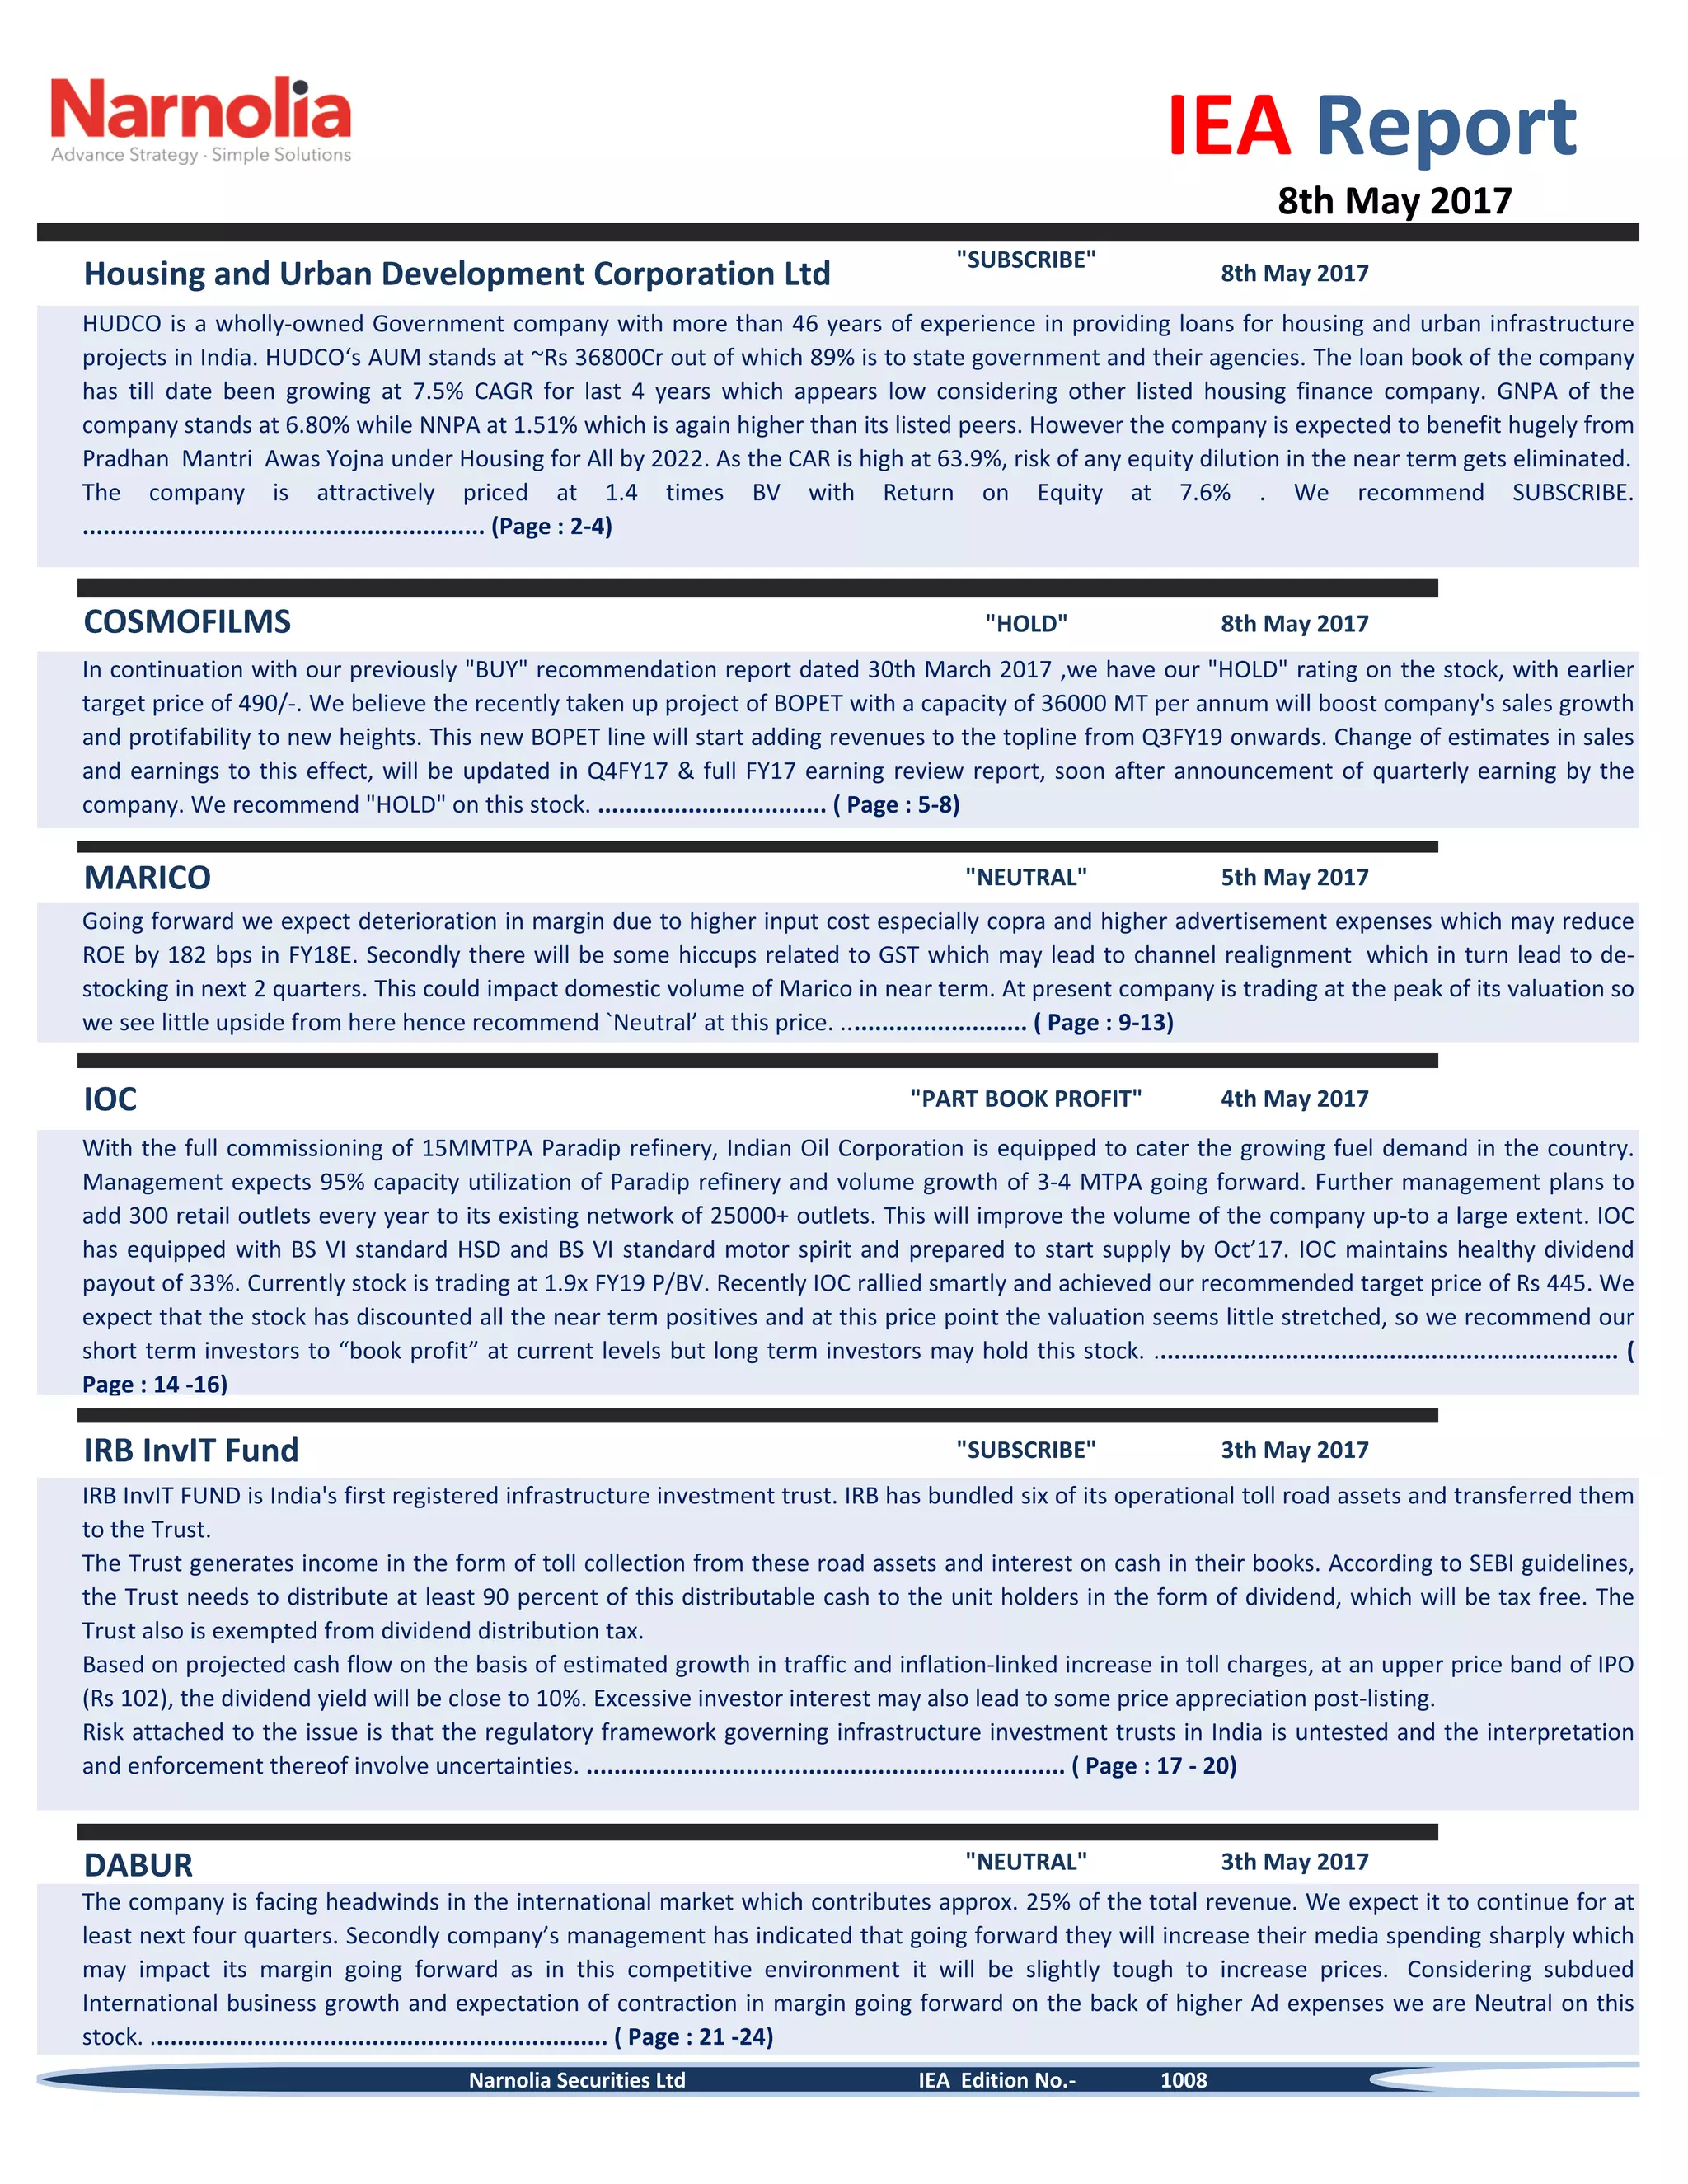
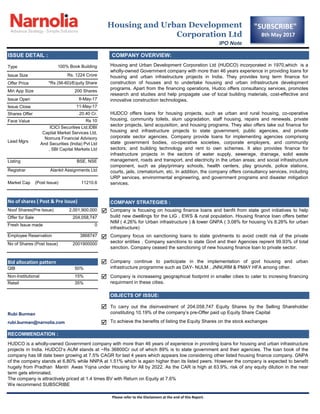
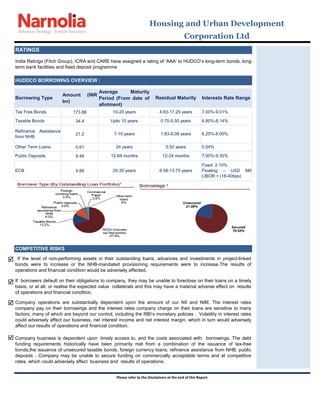
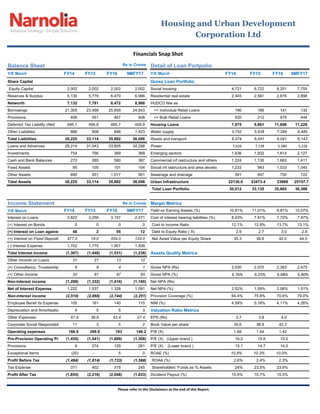
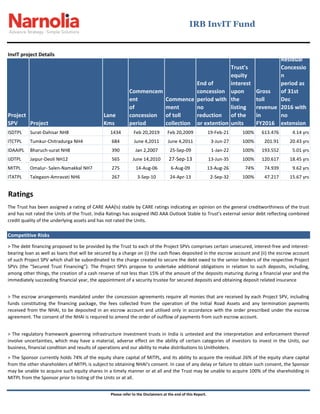
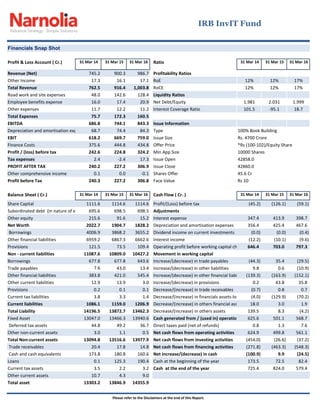
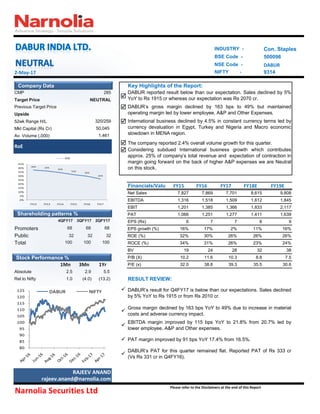
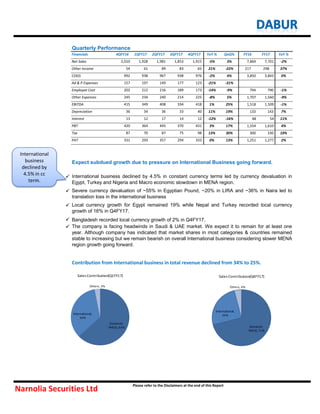

1. HUDCO is a wholly-owned Indian government company with over 46 years of experience providing loans for housing and urban infrastructure projects. 2. The company's loan book has been growing at a CAGR of 7.5% over the last 4 years, and it is expected to benefit from initiatives like the Pradhan Mantri Awas Yojna aimed at increasing housing. 3. HUDCO is attractively priced at 1.4 times its book value, with a return on equity of 7.6%. The high capital adequacy ratio of 63.9% eliminates the risk of equity dilution in the near term.