Download to read offline


![Chapter 2 | A global pathway to net-zero CO₂ emissions in 2050 53
2
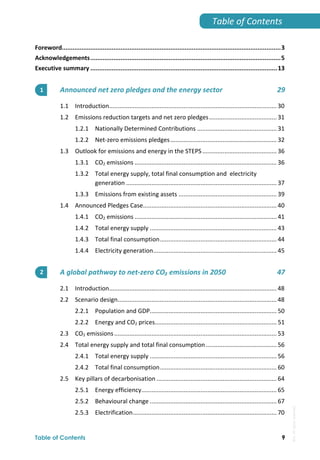
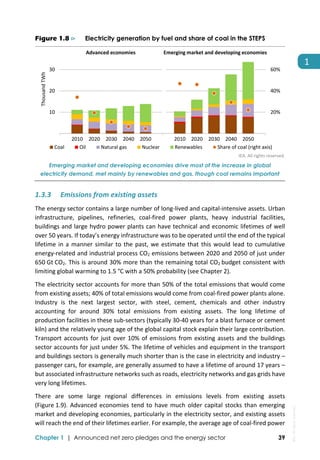
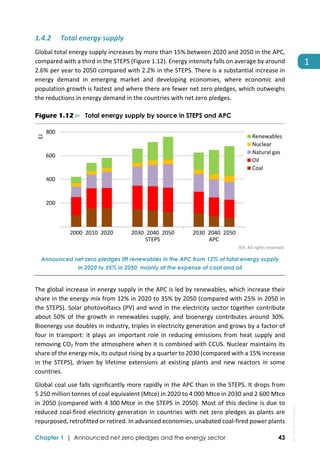
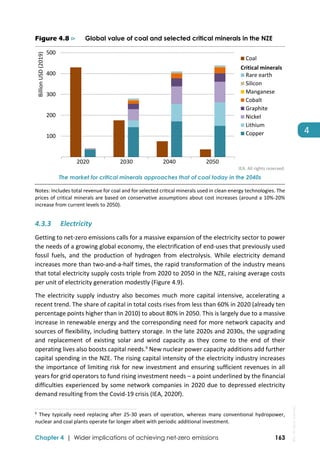
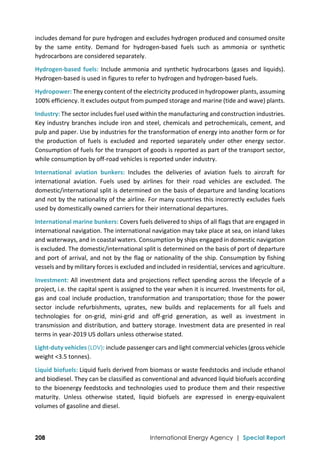
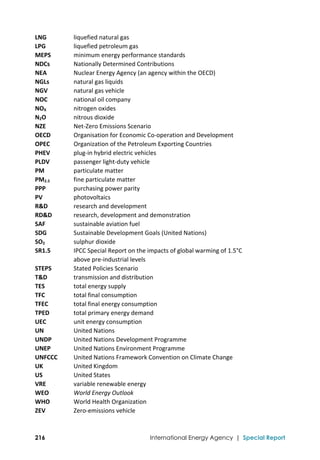
Table 2.2 ⊳ CO2 prices for electricity, industry and energy production in the NZE
USD (2019) per tonne of CO2 2025 2030 2040 2050
Advanced economies 75 130 205 250
Selected emerging market and
developing economies*
45 90 160 200
Other emerging market and
developing economies
3 15 35 55
* Includes China, Russia, Brazil and South Africa.
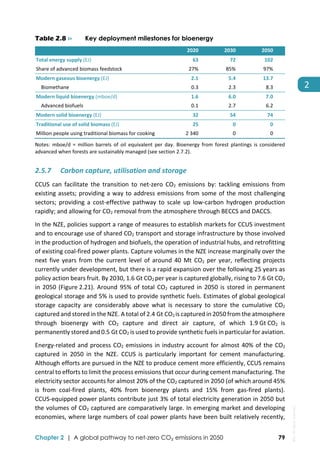
2.3 CO2 emissions
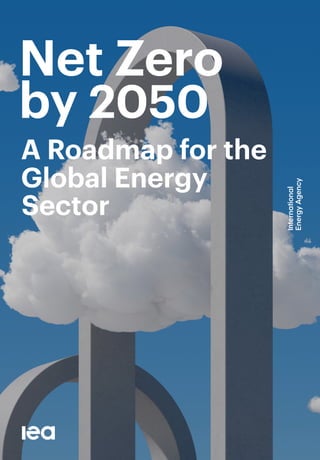
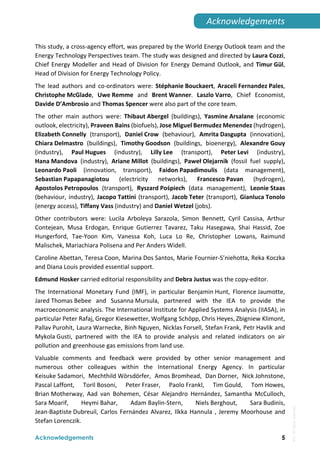
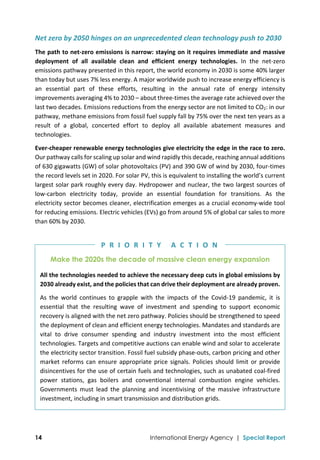
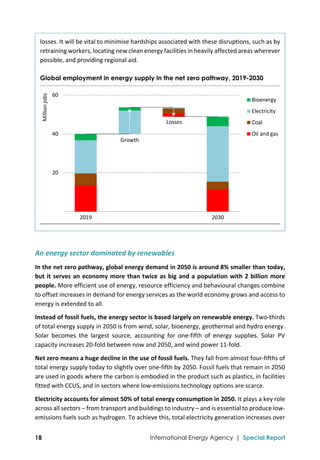
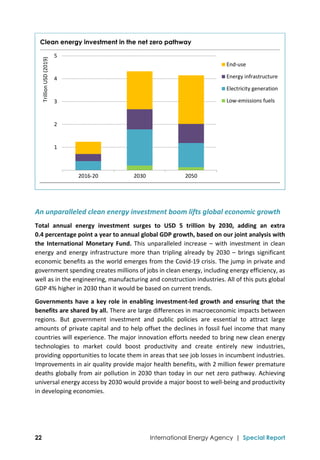
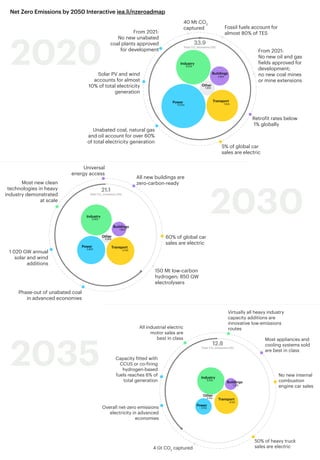
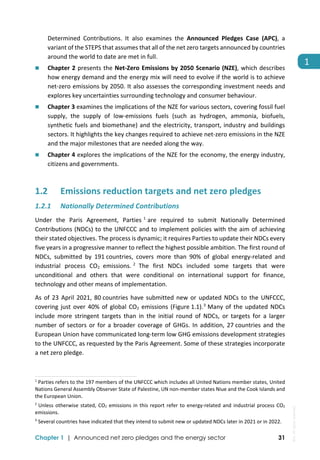
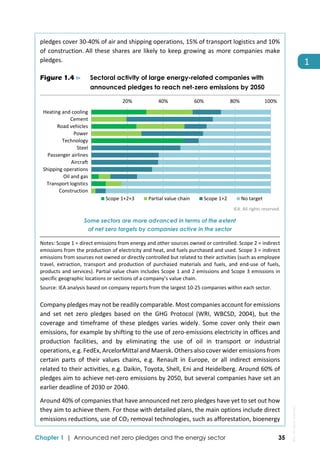
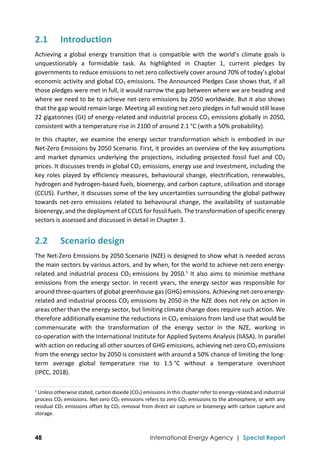
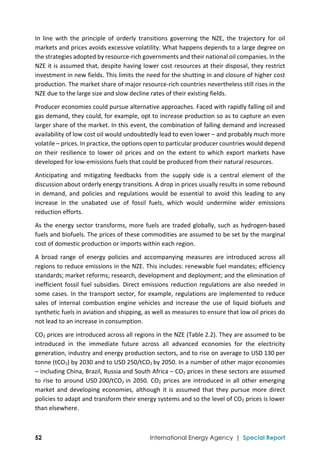
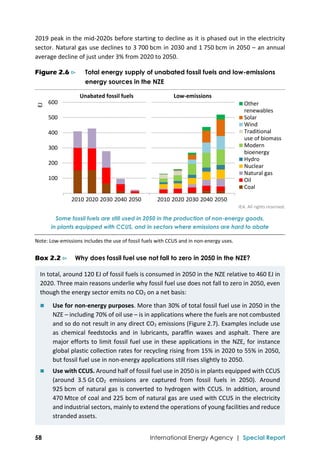
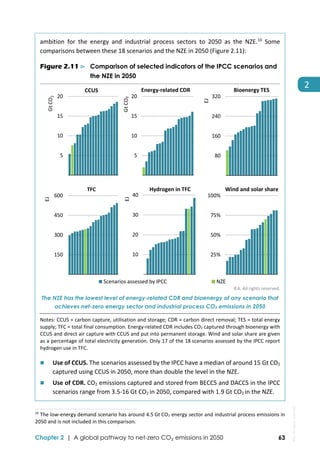
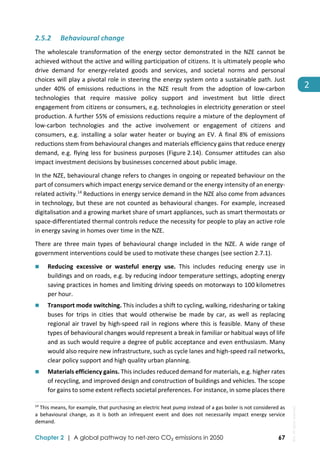
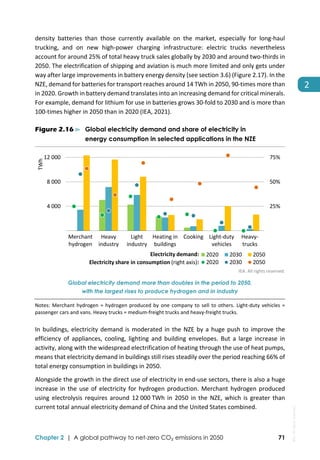
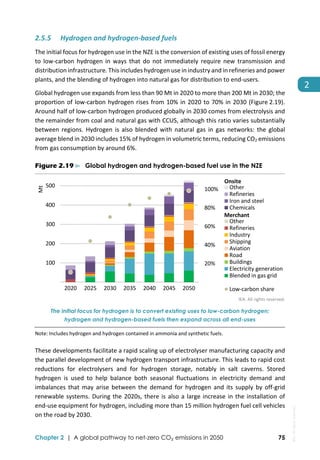
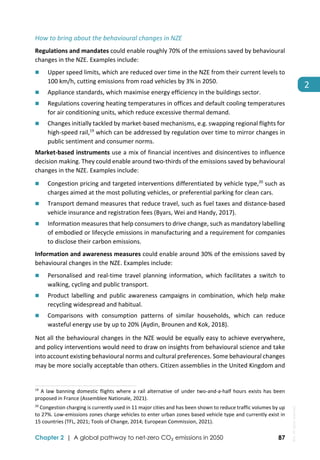
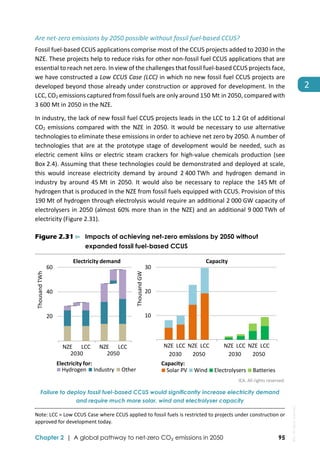
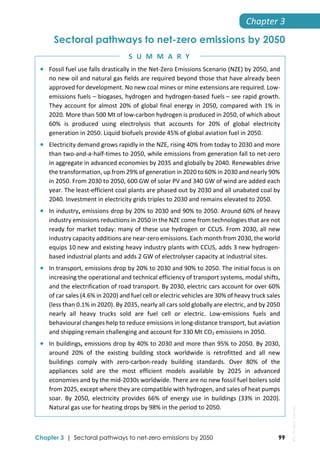
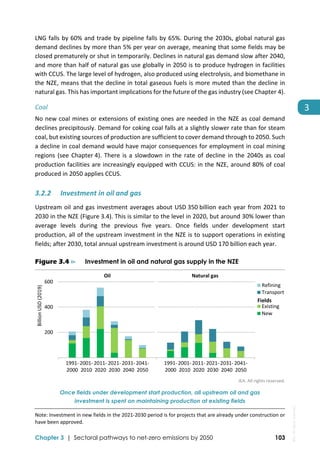
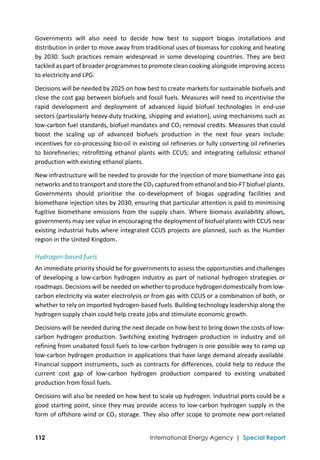
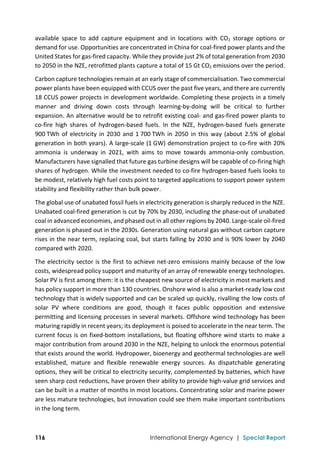
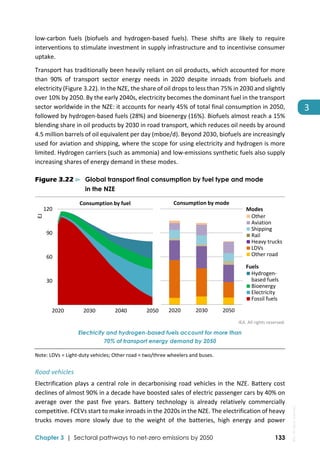
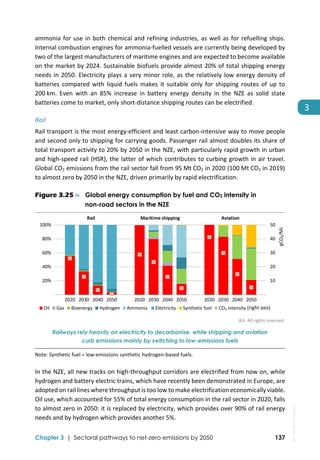
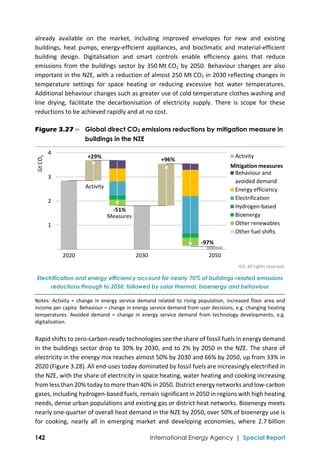
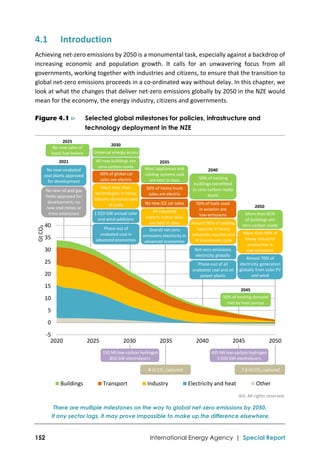
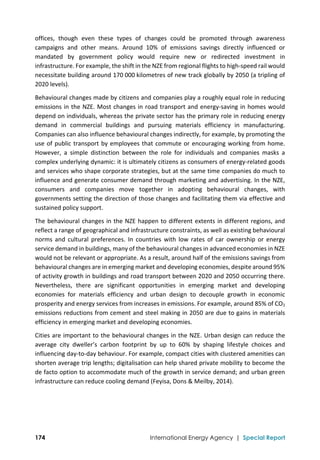
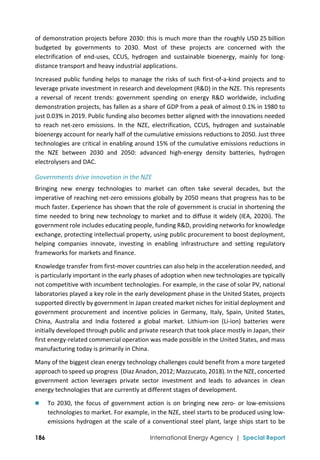
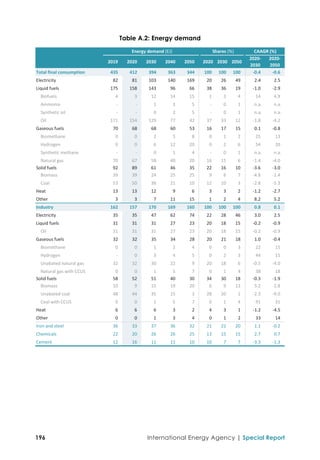
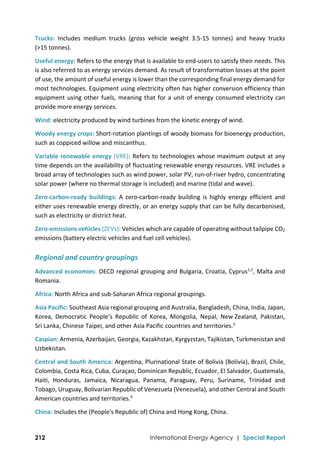
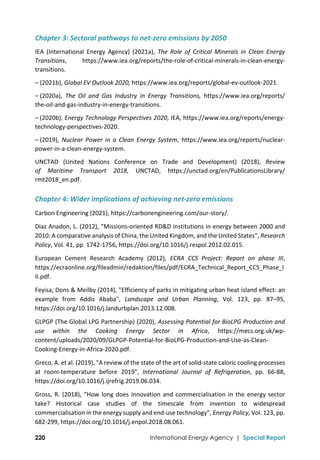
Global energy‐related and industrial process CO2 emissions in the NZE fall to around
21 Gt CO2 in 2030 and to net‐zero in 2050 (Figure 2.2).3
CO2 emissions in advanced economies
as a whole fall to net zero by around 2045 and these countries collectively remove around
0.2 Gt CO2 from the atmosphere in 2050. Emissions in several individual emerging market
and developing economies also fall to net zero well before 2050, but in aggregate there are
around 0.2 Gt CO2 of remaining emissions in this group of countries in 2050. These are offset
by CO2 removal in advanced economies to provide net‐zero CO2 emissions at the global level.
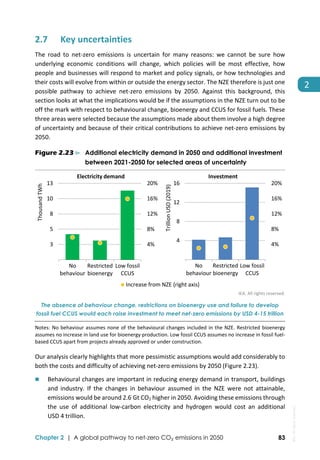
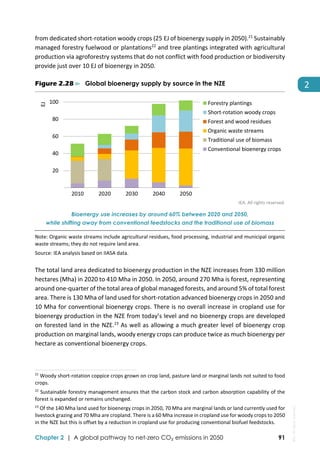
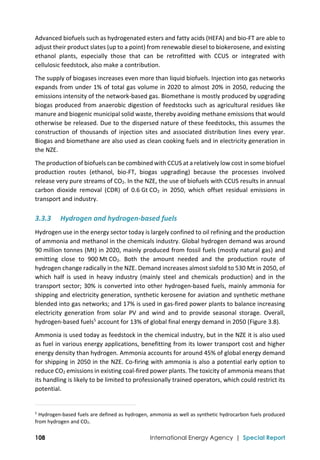
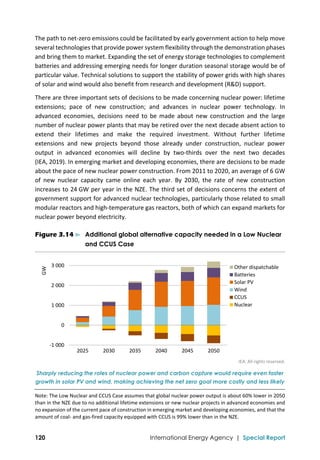
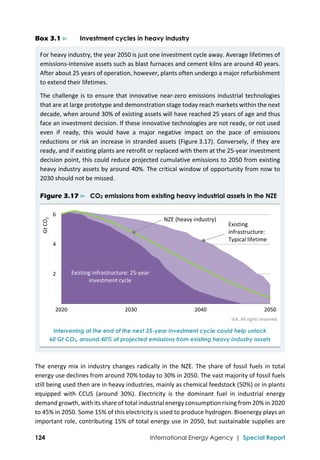
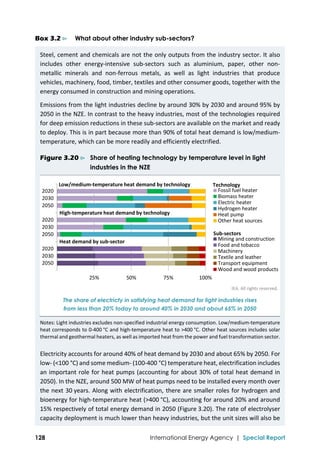
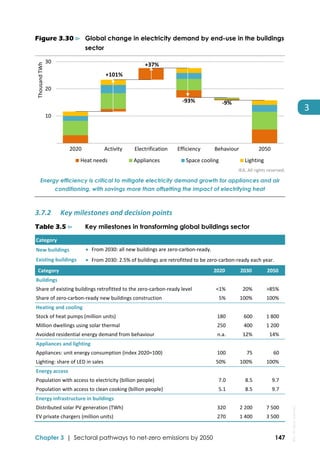
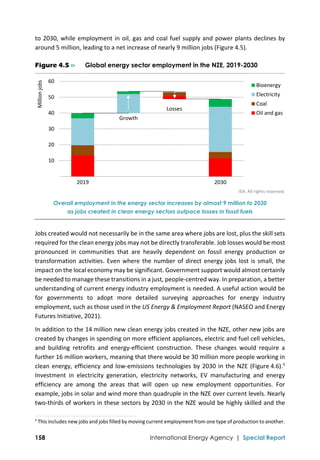
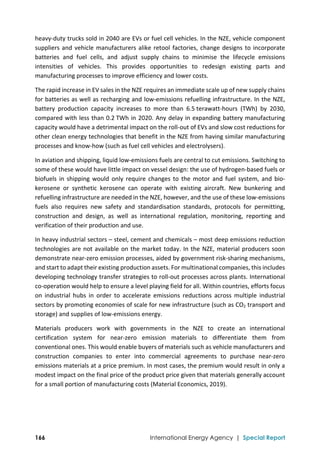
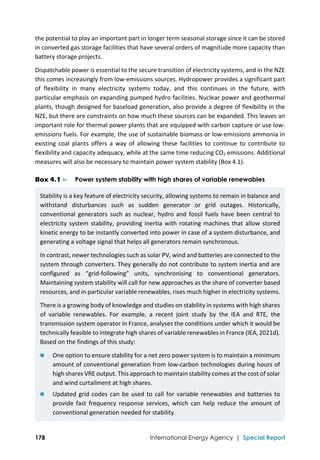
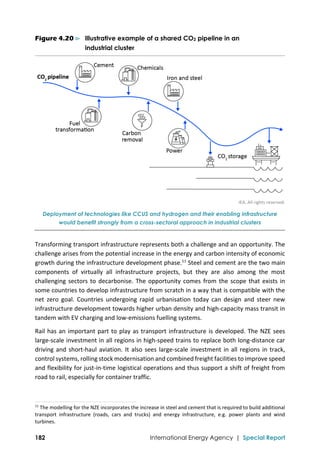
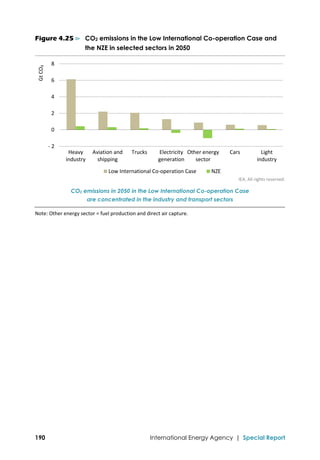
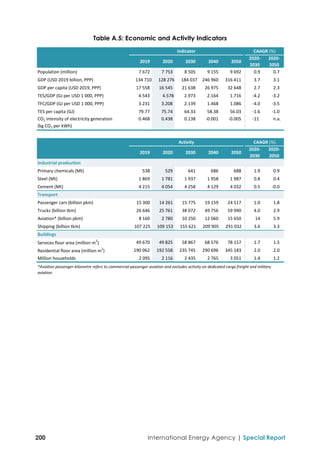
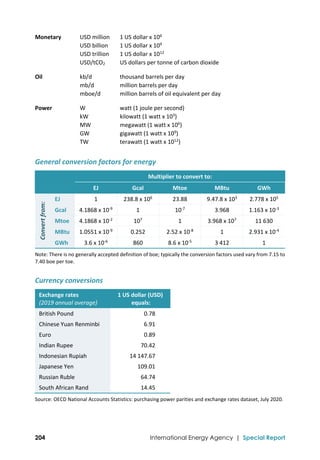
Figure 2.2 ⊳ Global net CO2 emissions in the NZE
IEA. All rights reserved.
CO2 emissions fall to net zero in advanced economies around 2045 and globally by 2050.
Per capita emissions globally are similar by the early-2040s.
Note: Includes CO2 emissions from international aviation and shipping.
3
In the period to 2030, CO2 emissions in the NZE fall at a broadly similar rate to the P2 illustrative pathway in
the IPCC SR 1.5 (IPCC, 2018). The P2 scenario is described as “a scenario with … shifts towards sustainable and
healthy consumption patterns, low‐carbon technology innovation, and well‐managed land systems with
limited societal acceptability for BECCS [bioenergy with carbon capture and storage]”. After 2030, emissions
in the NZE fall at a much faster pace than in the P2 scenario, which has 5.6 Gt CO2 of residual energy sector
and industrial process CO2 emissions remaining in 2050.
‐10
0
10
20
30
40
2010 2020 2030 2040 2050
Gt CO₂
Advanced economies Emerging market and developing economies
CO₂ emissions
‐3
0
3
6
9
12
2010 2020 2030 2040 2050
tCO₂ per capita
Per capita CO₂ emissions
IEA.
All
rights
reserved.](https://image.slidesharecdn.com/netzeroby2050-aroadmapfortheglobalenergysector-210524144348/85/IEA-Flagship-report-Net-Zero-by-2050-54-320.jpg)
![54 International Energy Agency | Special Report
Several emerging market and developing economies with a very large potential for producing
renewables‐based electricity and bioenergy are also a key source of carbon dioxide removal
(CDR). This includes making use of renewable electricity sources to produce large quantities
of biofuels with CCUS, some of which is exported, and to carry out direct air capture with
carbon capture and storage (DACCS).
Per capita CO2 emissions in advanced economies drop from around 8 tCO2 per person in 2020
to around 3.5 tCO2 in 2030, a level close to the average in emerging market and developing
economies in 2020. Per capita emissions also fall in emerging market and developing
economies, but from a much lower starting point. By the early 2040s, per capita emissions in
both regions are broadly similar at around 0.5 tCO2 per person.
Cumulative global energy‐related and industrial process CO2 emissions between 2020 and
2050 amount to just over 460 Gt in the NZE. Assuming parallel action to address CO2
emissions from agriculture, forestry and other land use (AFOLU) over the period to 2050
would result in around 40 Gt CO2 from AFOLU (see section 2.7.2). This means that total CO2
emissions from all sources – some 500 Gt CO2 – are in line with the CO2 budgets included in
the IPCC SR1.5, which indicated that the total CO2 budget from 2020 consistent with
providing a 50% chance of limiting warming to 1.5 °C is 500 Gt CO2 (IPCC, 2018).
4
As well as
reducing CO2 emissions to net‐zero, the NZE seeks to reduce non‐CO2 emissions from the
energy sector. Methane emissions from fossil fuel production and use, for example, fall from
115 million tonnes (Mt) methane in 2020 (3.5 Gt CO2‐equivalent [CO2‐eq])5
to 30 Mt in 2030
and 10 Mt in 2050.
The fastest and largest reductions in global emissions in the NZE are initially seen in the
electricity sector (Figure 2.3). Electricity generation was the largest source of emissions in
2020, but emissions drop by nearly 60% in the period to 2030, mainly due to major reductions
from coal‐fired power plants, and the electricity sector becomes a small net negative source
of emissions around 2040. Emissions from the buildings sector fall by 40% between 2020 and
2030 thanks to a shift away from the use of fossil fuel boilers, and retrofitting the existing
building stock to improve its energy performance. Emissions from industry and transport
both fall by around 20% over this period, and their pace of emissions reductions accelerates
during the 2030s as the roll‐out of low‐emissions fuels and other emissions reduction options
is scaled up. Nonetheless, there are a number of areas in transport and industry in which it
is difficult to eliminate emissions entirely – such as aviation and heavy industry – and both
sectors have a small level of residual emissions in 2050. These residual emissions are offset
with applications of BECCS and DACCS.
4
This budget is based on Table 2.2 of the IPCC SR1.5 (IPCC, 2018). It assumes 0.53 °C additional warming from
the 2006‐2015 period to give a remaining CO2 budget from 2018 of 580 Gt CO2. There were around 80 Gt CO2
emissions emitted from 2018 to 2020.
5
Non‐CO2 gases are converted to CO2‐equivalents based on the 100‐year global warming potentials reported
by the IPCC 5th Assessment Report (IPCC, 2014). One tonne of methane is equivalent to 30 tonnes of CO2.](https://image.slidesharecdn.com/netzeroby2050-aroadmapfortheglobalenergysector-210524144348/85/IEA-Flagship-report-Net-Zero-by-2050-55-320.jpg)
![Chapter 2 | A global pathway to net-zero CO₂ emissions in 2050 59
2
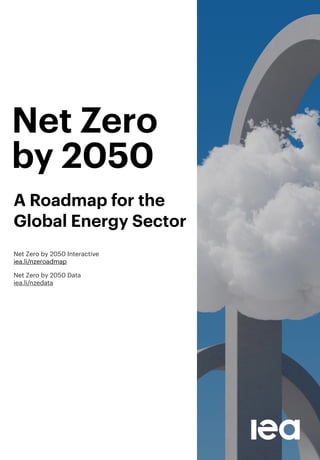
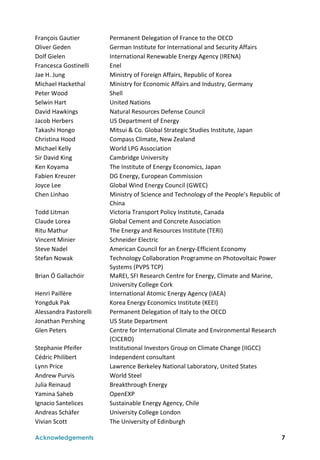
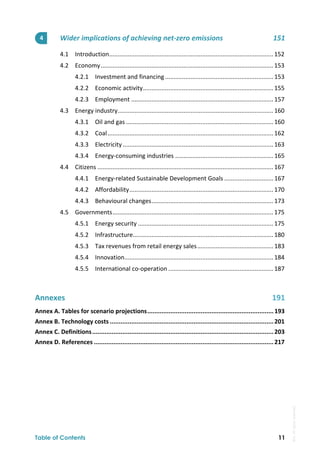
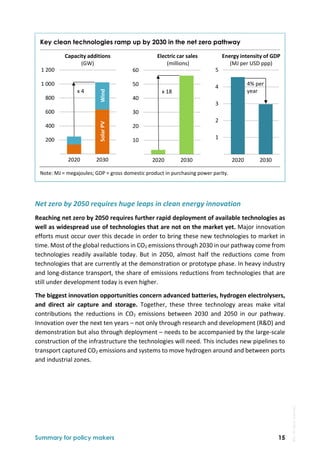
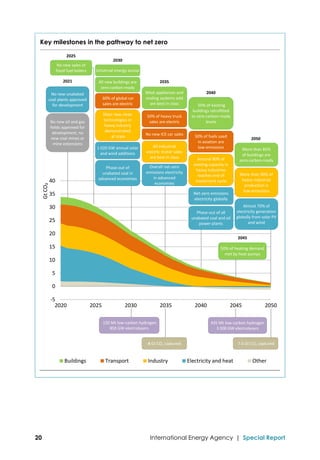
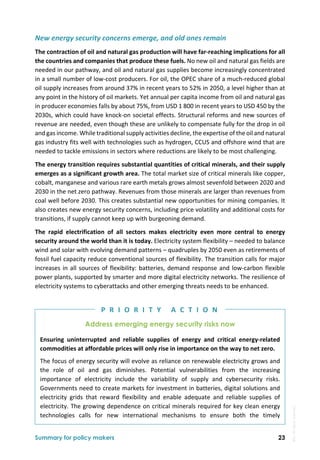
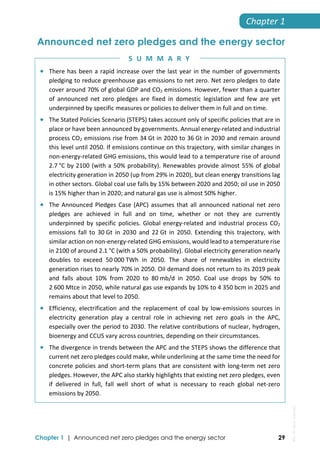
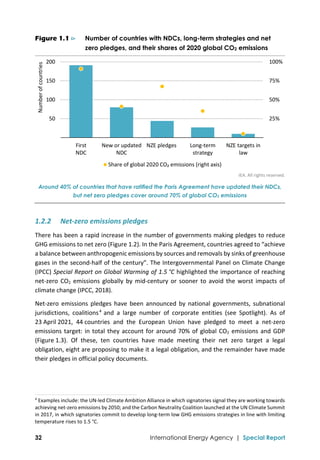
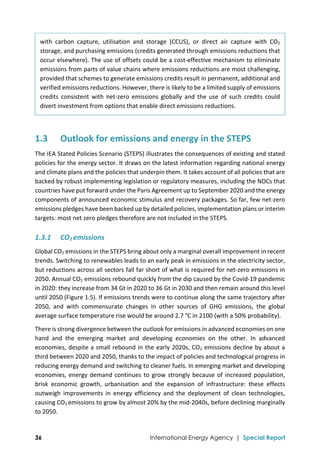
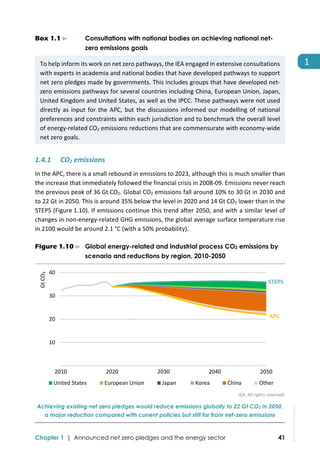
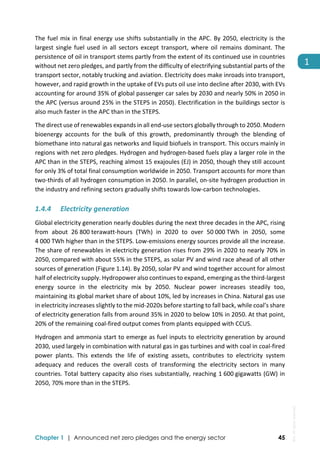
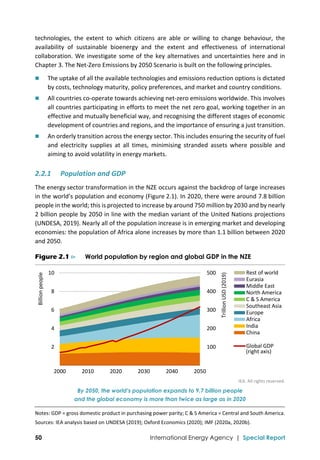
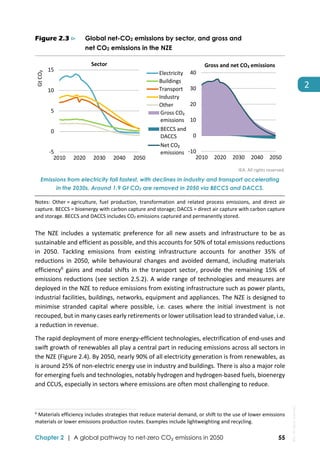
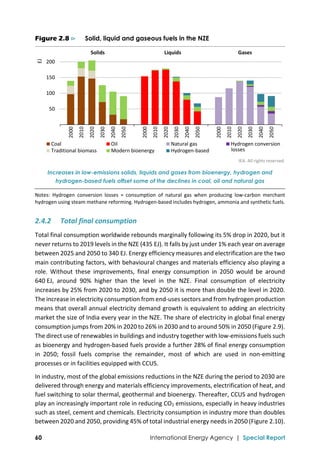
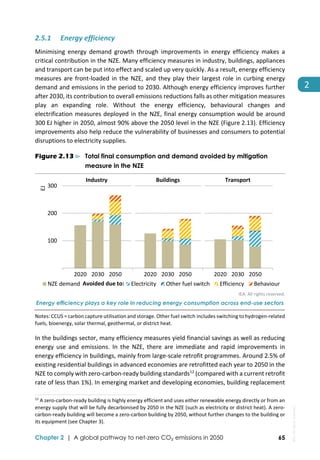
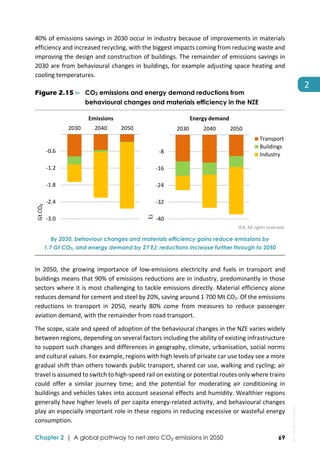
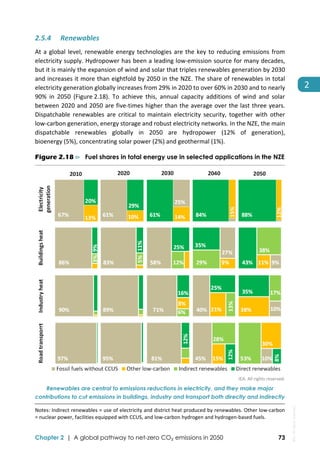
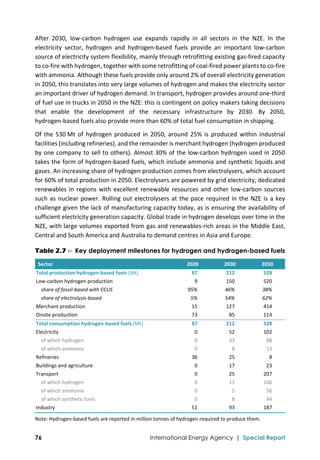
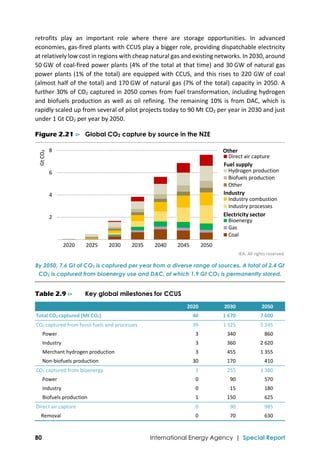
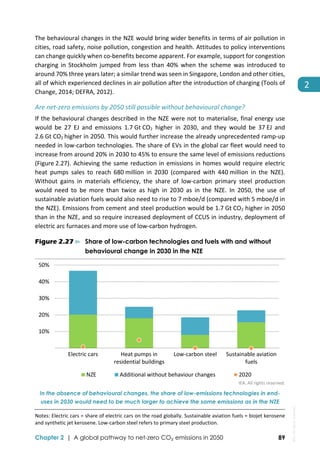
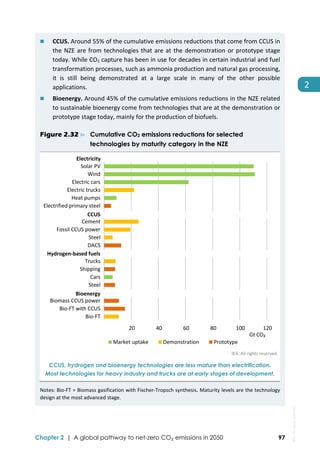
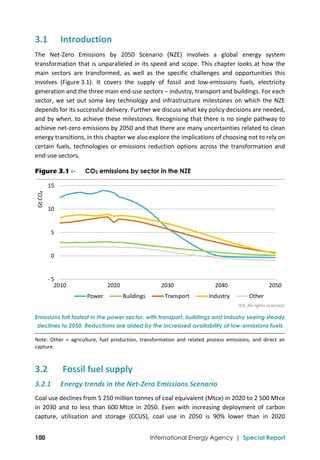
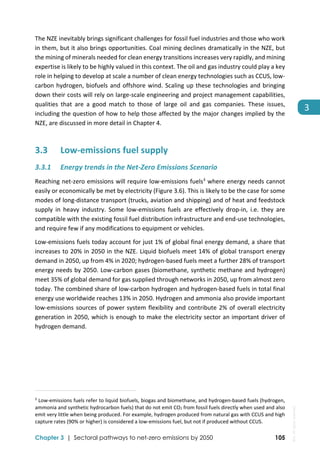
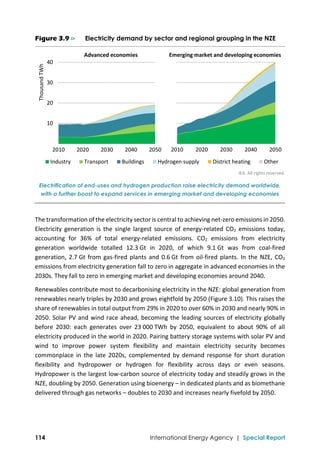
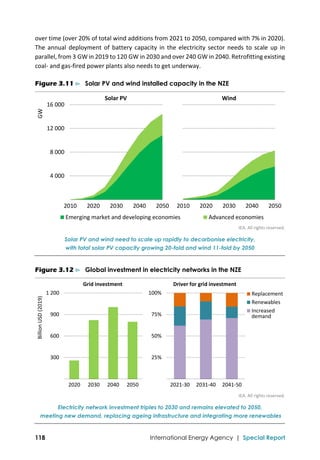
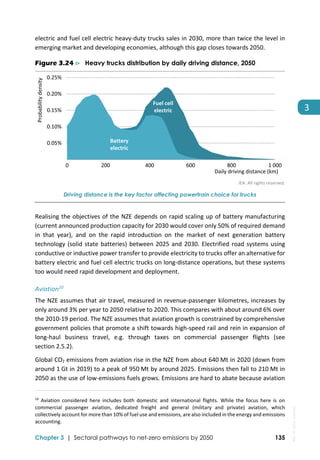
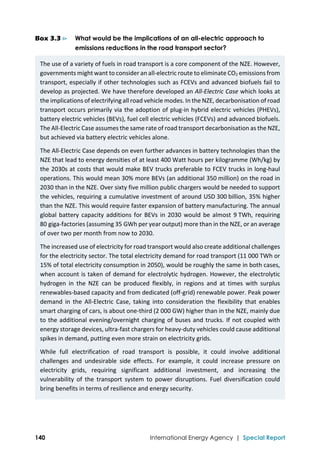
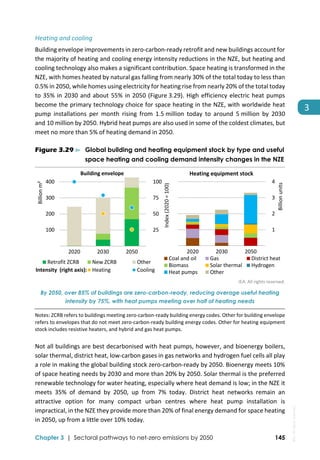
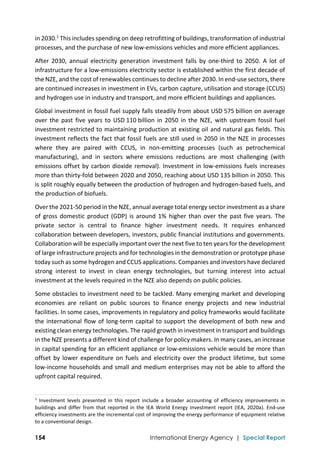
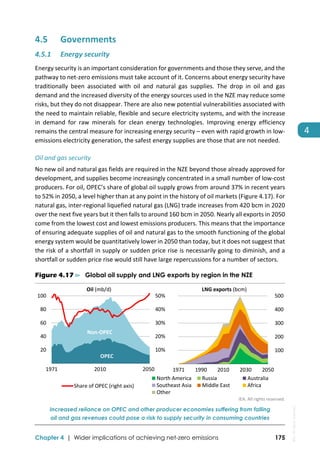
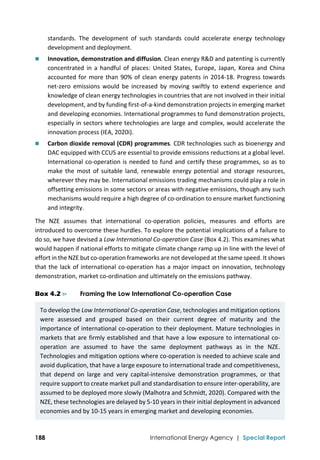
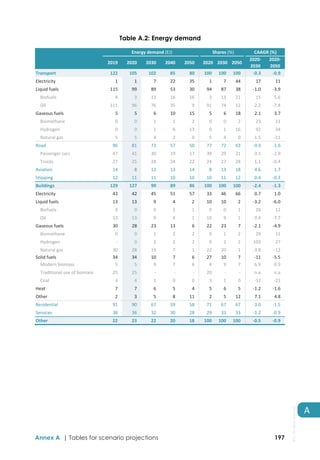
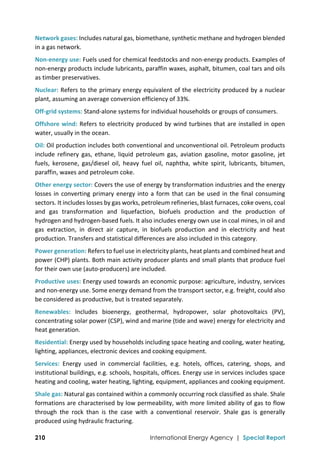
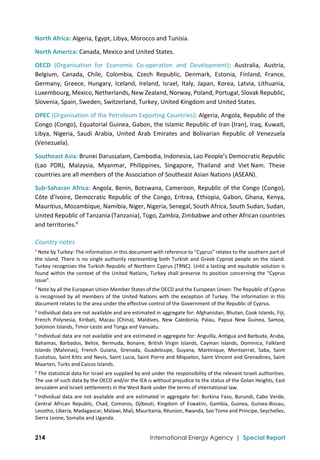
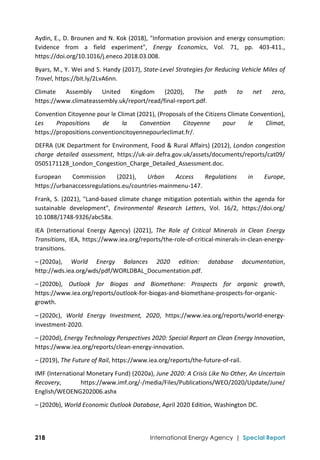
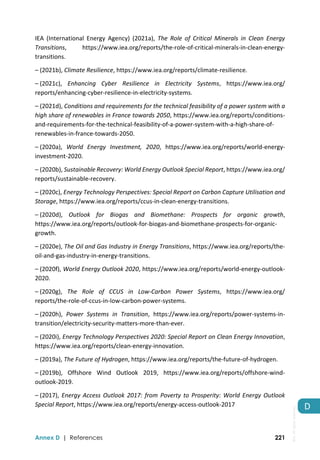
Use in sectors where technology options are scarce. The remaining 20% of fossil
fuel use in 2050 in the NZE is in sectors where the complete elimination of emissions
is particularly challenging. Mostly this is oil, as it continues to fuel aviation in
particular. A small amount of unabated coal and natural gas are used in industry and
in the production of energy. The unabated use of fossil fuel results in around
1.7 Gt CO2 emissions in 2050, which are fully offset by BECCS and DACCS.
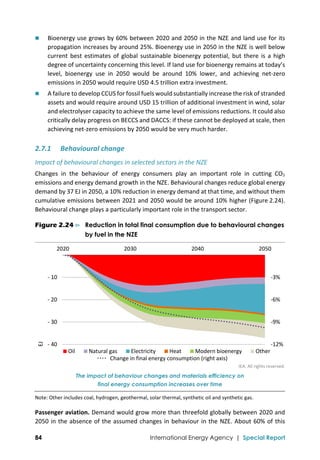
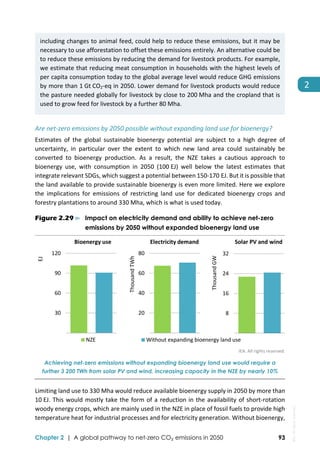
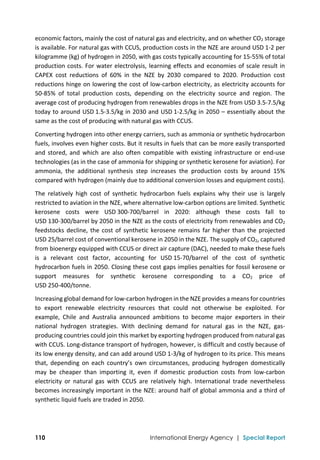
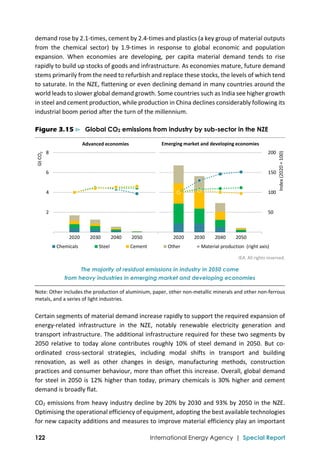
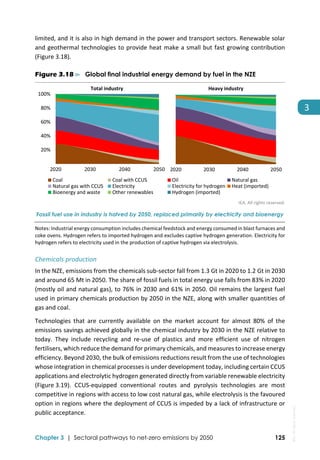
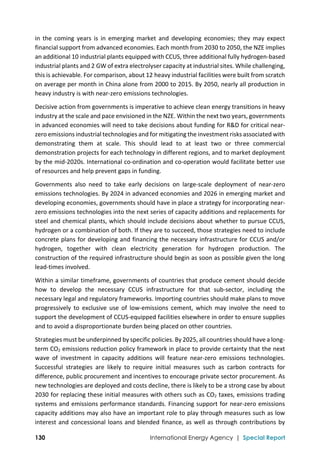
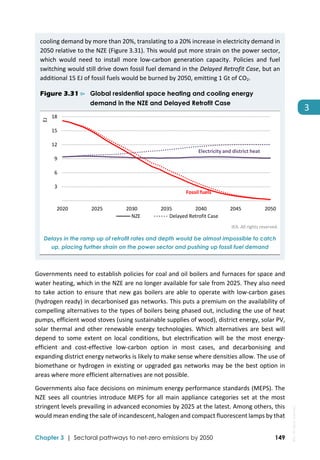
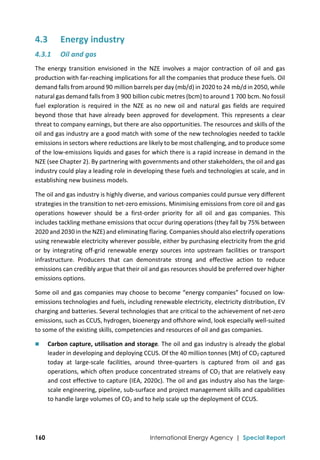
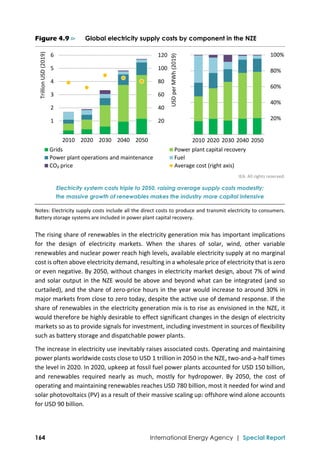
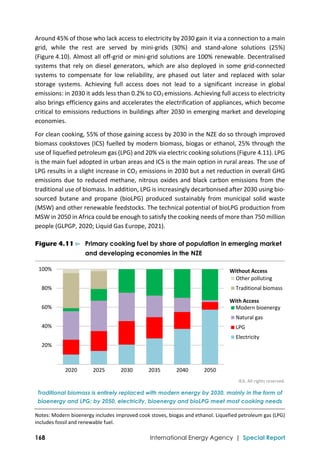
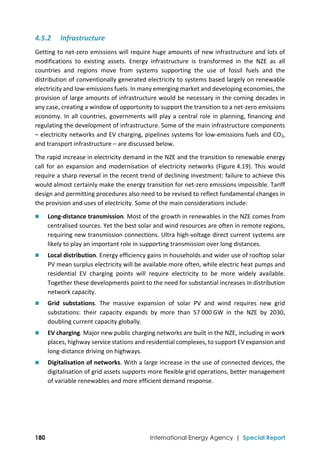
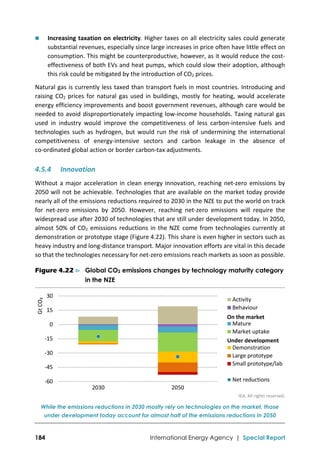
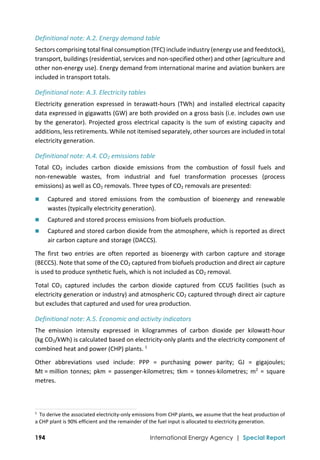
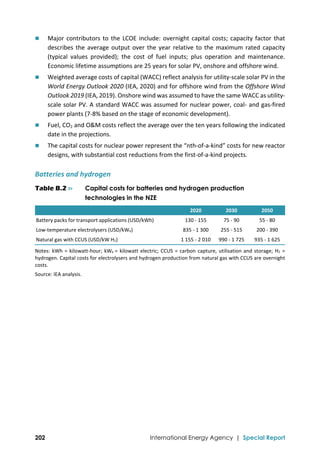
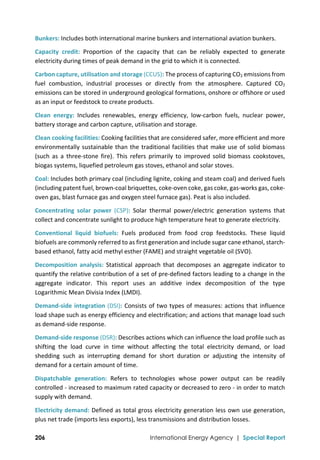
Figure 2.7 ⊳ Fossil fuel use and share by sector in 2050 in the NZE
IEA. All rights reserved.
More than 30% of fossil fuel use in 2050 is not combusted and so does
not result in direct CO2 emissions, around 50% is paired with CCUS
Notes: Non‐combustion includes use for non‐emitting, non‐energy purposes such as petrochemical
feedstocks, lubricants and asphalt. Energy production includes fuel use for direct air capture.
Solid, liquid and gaseous fuels continue to play an important role in the NZE, which sees large
increases in bioenergy and hydrogen (Figure 2.8). Around 40% of bioenergy used today is for
the traditional use of biomass in cooking: this is rapidly phased out in the NZE. Modern forms
of solid biomass, which can be used to reduce emissions in both the electricity and industry
sectors, rise from 32 EJ in 2020 to 55 EJ in 2030 and 75 EJ in 2050, offsetting a large portion
of a drop in coal demand. The use of low‐emissions liquid fuels, such as ammonia, synthetic
fuels and liquid biofuels, increases from 3.5 EJ (1.6 million barrels of oil equivalent per day
[mboe/d]) in 2020 to just above 25 EJ (12.5 mboe/d) in 2050. The supply of low‐emissions
gases, such as hydrogen, synthetic methane, biogas and biomethane rises from 2 EJ in 2020
to 17 EJ in 2030 and 50 EJ in 2050. The increase in gaseous hydrogen production between
2020 and 2030 in the NZE is twice as fast as the fastest ten‐year increase in shale gas
production in the United States.
20%
40%
60%
80%
100%
10
20
30
40
50
Non‐
combustion
Energy
production
Industry
Power
Transport
Buildings
EJ
with CCUS
without CCUS
with CCUS
without CCUS
with CCUS
without CCUS
Share of sector
Coal
Natural gas
Oil
total (right axis)
IEA.
All
rights
reserved.](https://image.slidesharecdn.com/netzeroby2050-aroadmapfortheglobalenergysector-210524144348/85/IEA-Flagship-report-Net-Zero-by-2050-60-320.jpg)

![132 International Energy Agency | Special Report
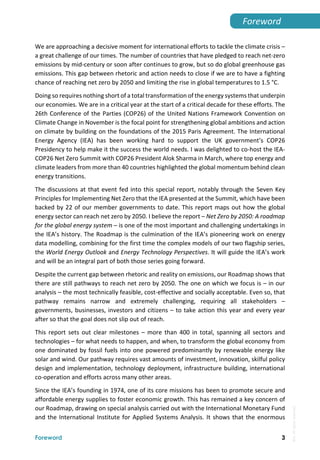
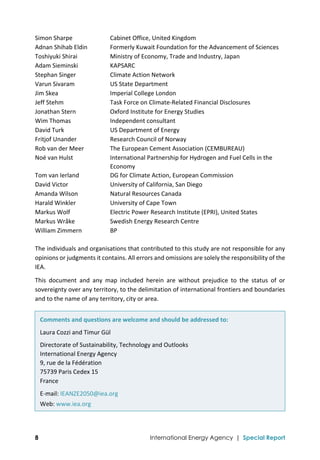
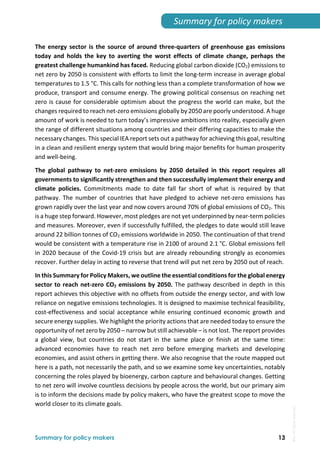
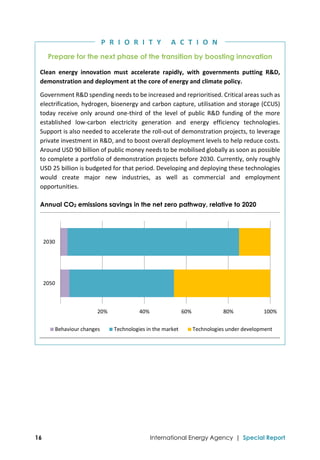
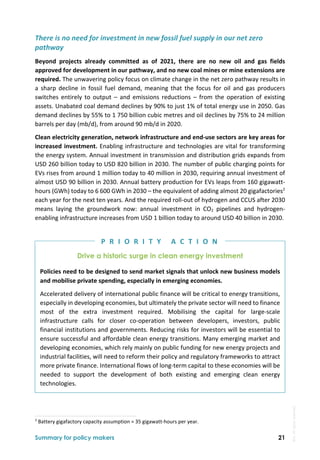
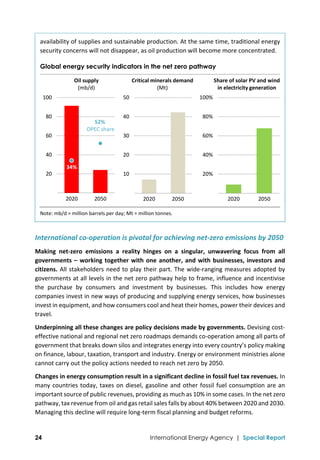
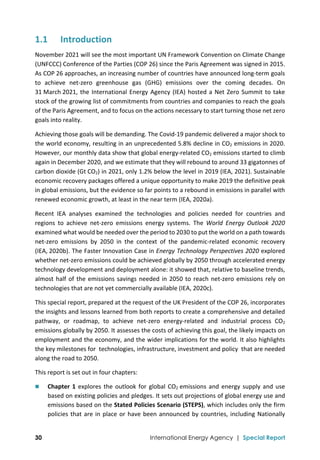
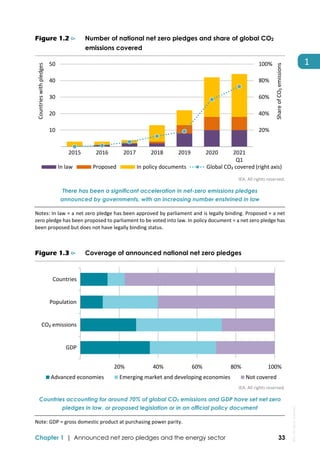
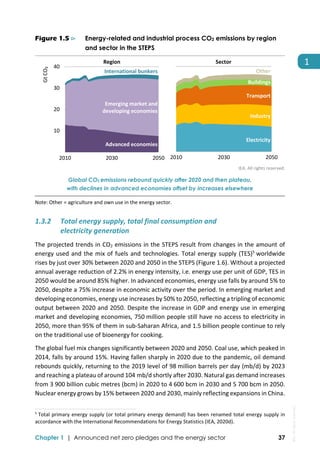
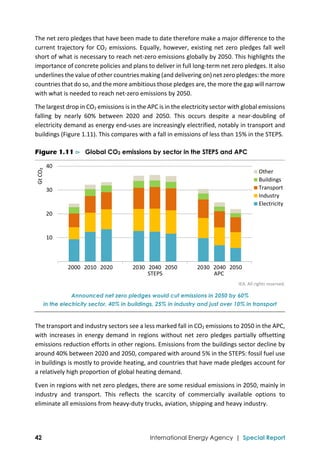
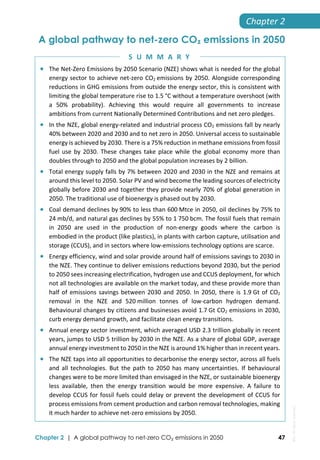
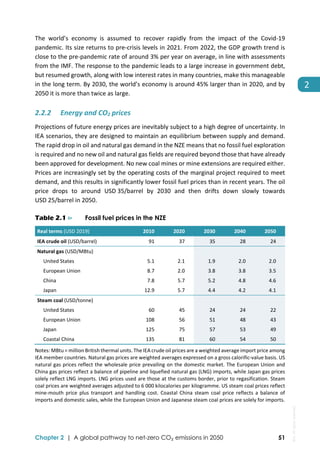
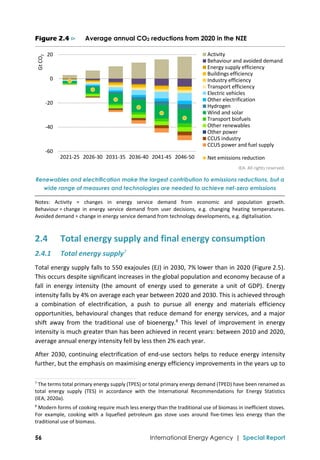
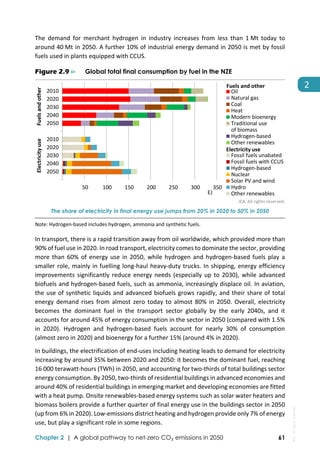
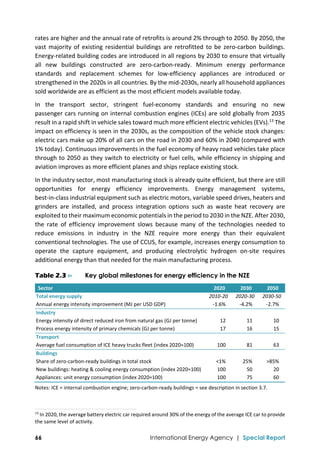
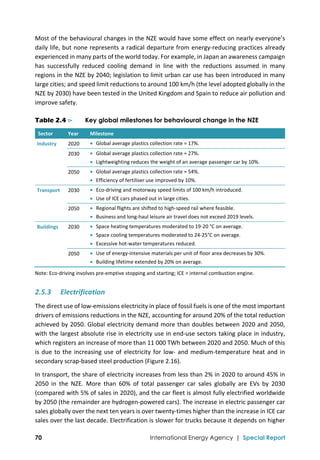
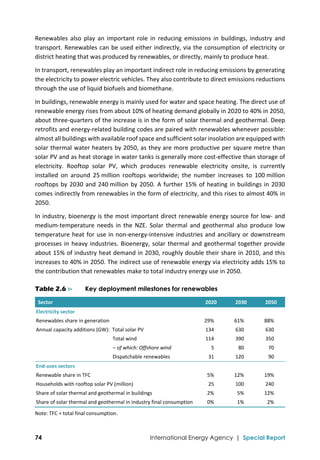
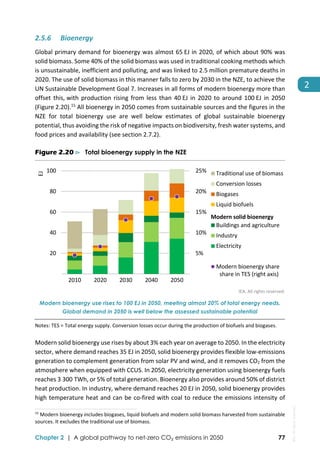
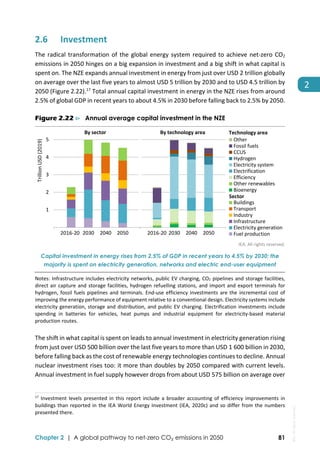
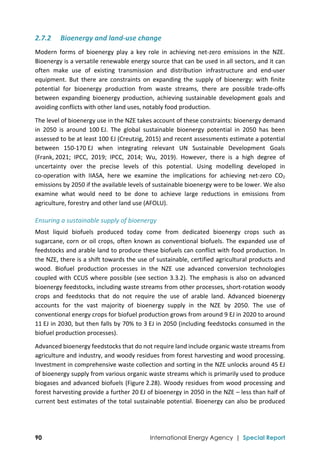
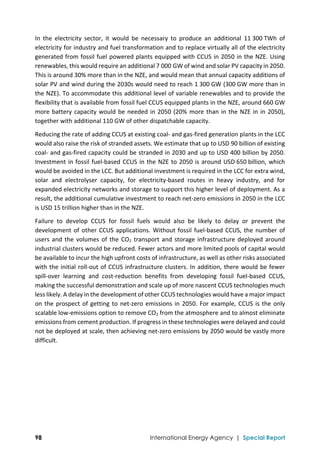
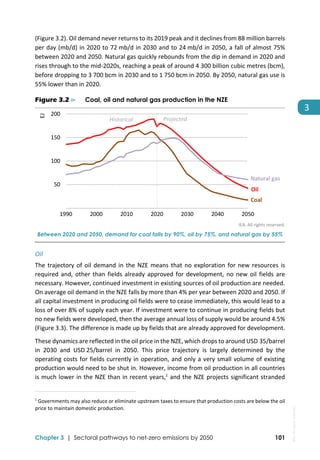
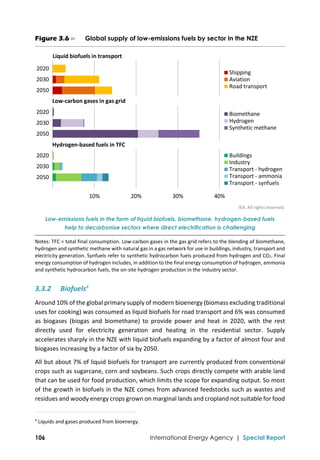
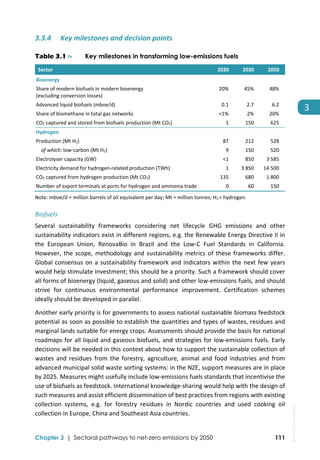
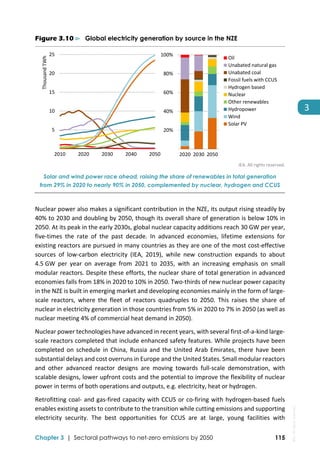
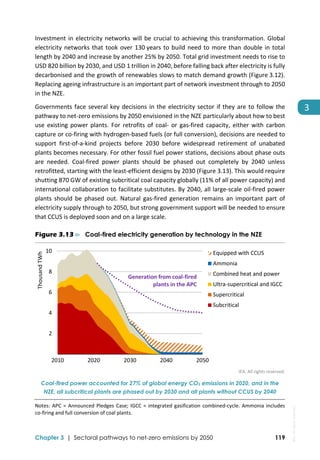
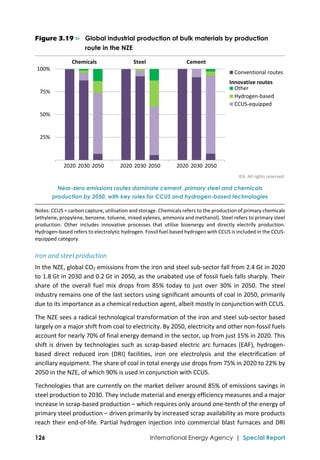
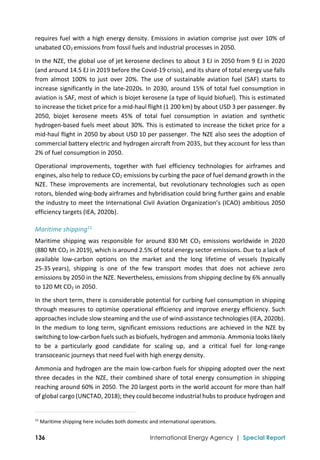
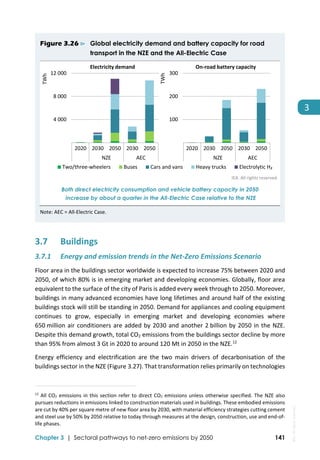
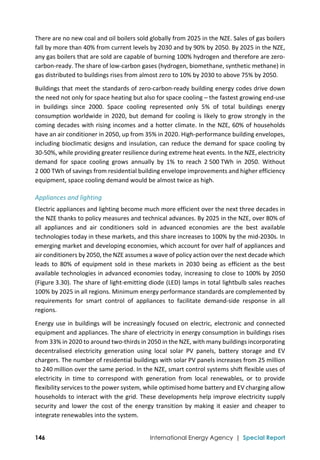
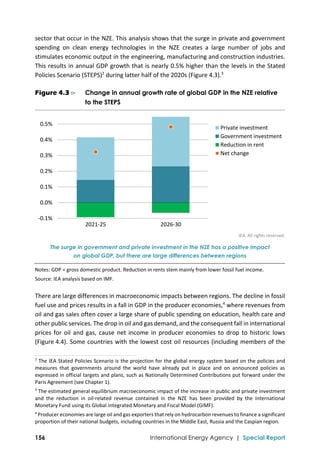
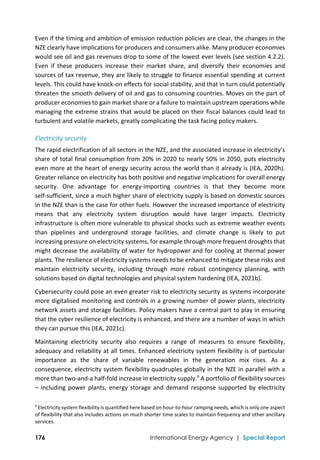
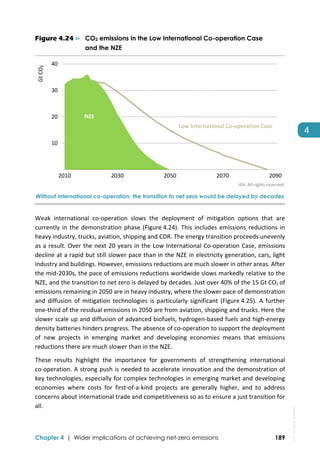
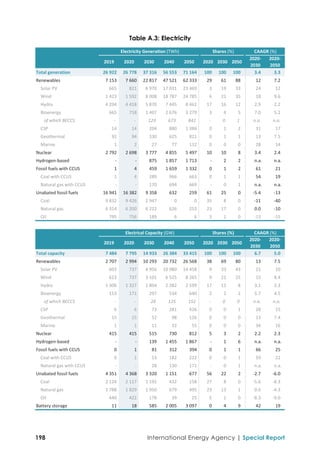
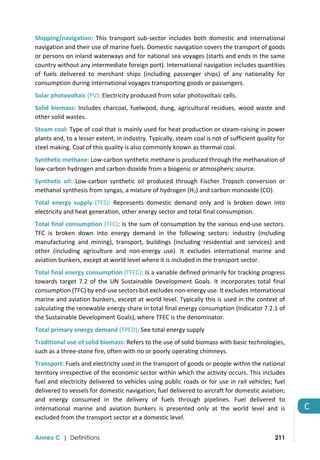
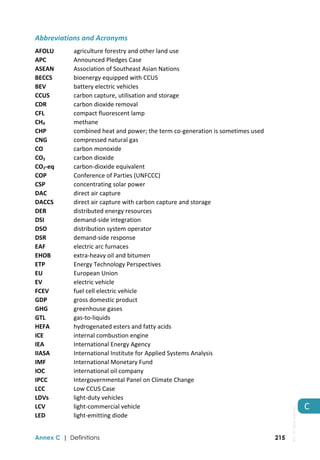
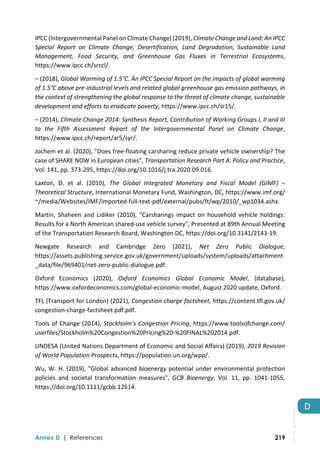
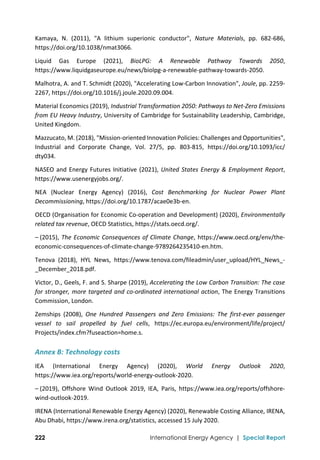
The transport modes do not decarbonise at the same rate because technology maturity
varies markedly between them (Figure 3.21). CO2 emissions from two/three‐wheelers almost
cease by 2040, followed by cars, vans and rail in the late 2040s. Emissions from heavy trucks,
shipping and aviation fall by an annual average of 6% between 2020 and 2050, but still
collectively amount to more than 0.5 Gt CO2 in 2050. This reflects projected activity growth
and that many of the technologies needed to reduce CO2 emissions in long distance transport
are currently under development and do not start to make substantial inroads into the
market in the coming decade.
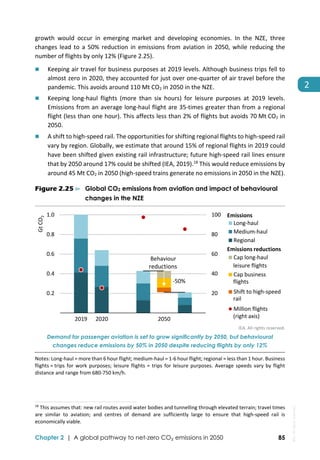
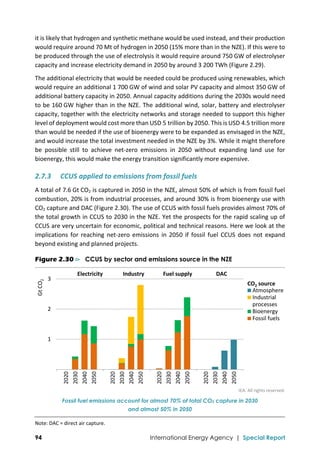
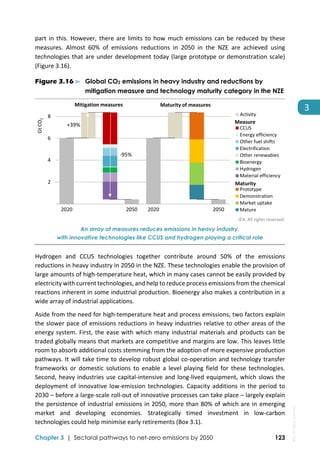
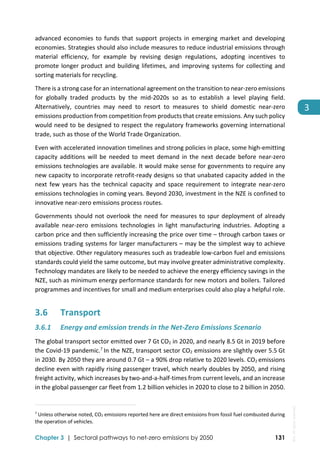
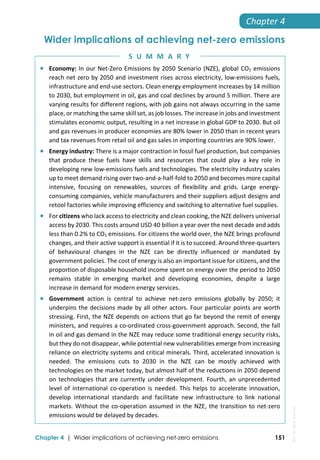
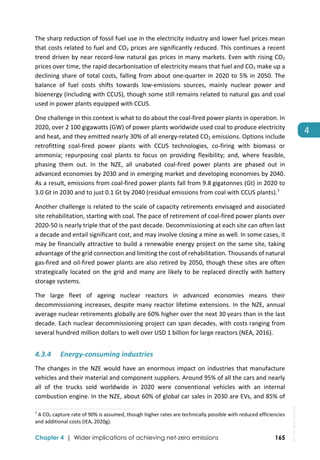
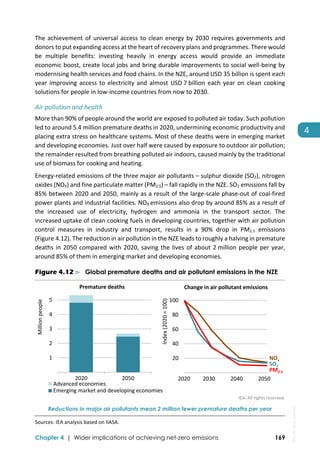
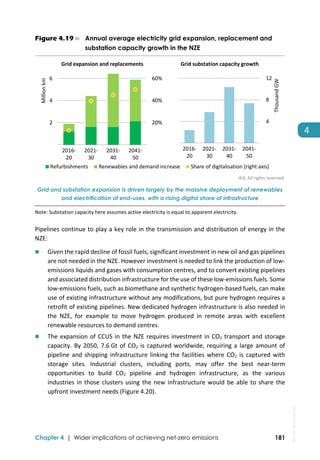
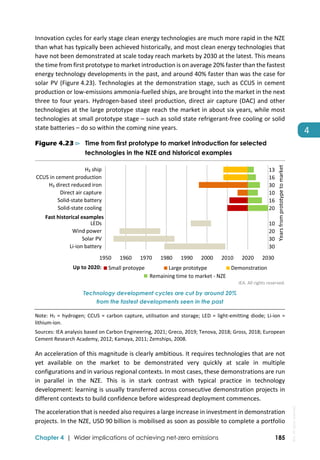
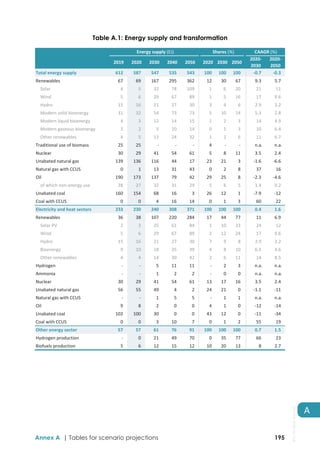
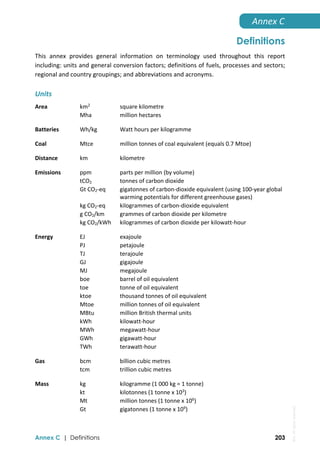
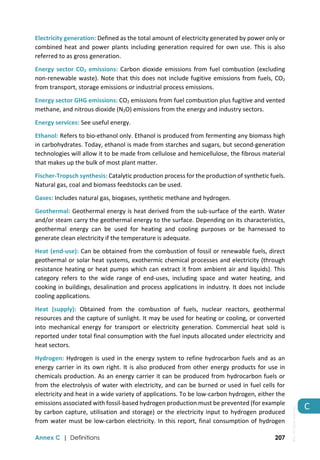
Figure 3.21 ⊳ Global CO2 transport emissions by mode and share of emissions
reductions to 2050 by technology maturity in the NZE
IEA. All rights reserved.
Passenger cars can make use of low-emissions technologies on the market, but major
advances are needed for heavy trucks, shipping and aviation to reduce their emissions
Notes: Other road = two/three wheelers and buses. Shipping and aviation include both domestic and
international operations. See Box 2.4 for details on the maturity categories.
Decarbonisation of the transport sector in the NZE relies on policies to promote modal shifts
and more efficient operations across passenger transport modes (see sections
2.5.7 and 4.4.3),8
as well as improvements in energy efficiency. It also depends on two major
technology transitions: shifts towards electric mobility (electric vehicles [EVs] and fuel cell
electric vehicles [FCEVs])9
and shifts towards higher fuel blending ratios and direct use of
8
Examples of efficient operations include: seamless integration of various modes (inter‐modality) and
“Mobility as a Service” in passenger transport; logistics measures in road freight, e.g. backhauling, night‐time
deliveries, real‐time routing; slow steaming in shipping; and air traffic management, e.g. landing and take‐off
scheduling in aviation.
9
EVs include battery electric vehicles, plug‐in hybrid electric‐gasoline vehicles and plug‐in hybrid electric‐diesel
vehicles. FCEVs contain a battery and electric motor and are capable of operating without tailpipe emissions.
1
2
3
4
2010 2020 2030 2040 2050
Gt CO
2
Light‐duty vehicles Heavy trucks
Other road Shipping
Aviation Rail
CO₂ emissions by mode
25%
50%
75%
100%
Heavy
trucks
Shipping Aviation
Mature Market uptake
Demonstration Prototype
Technology maturity by mode](https://image.slidesharecdn.com/netzeroby2050-aroadmapfortheglobalenergysector-210524144348/85/IEA-Flagship-report-Net-Zero-by-2050-133-320.jpg)


![Chapter 4 | Wider implications of achieving net-zero emissions 157
4
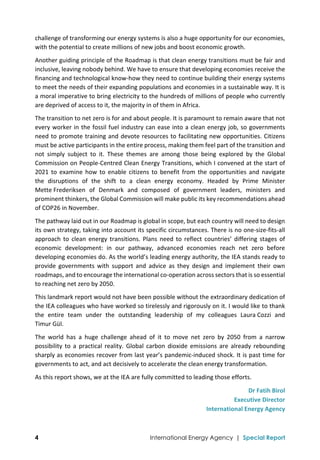
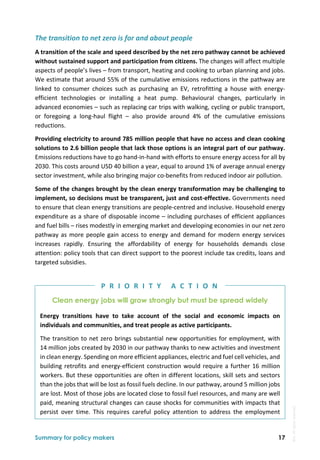
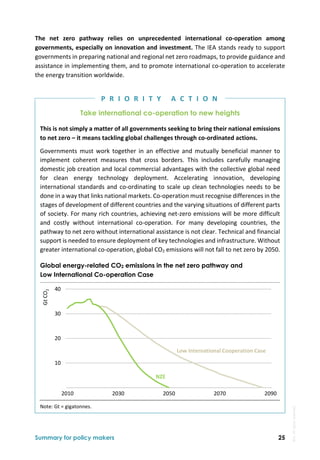
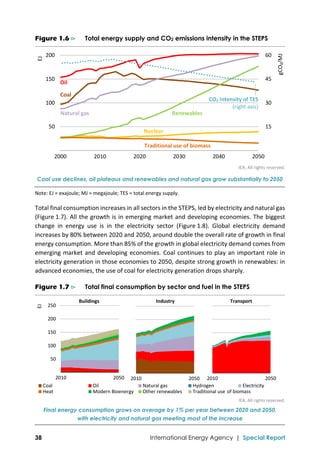
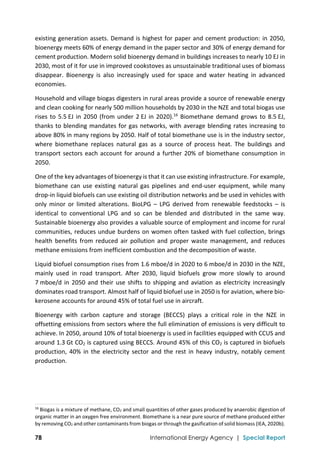
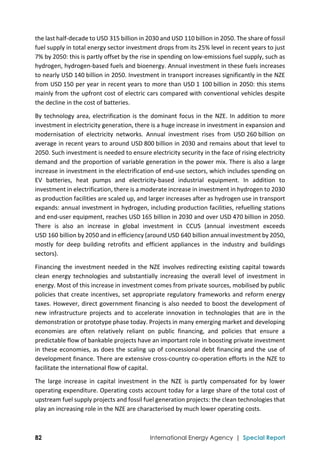
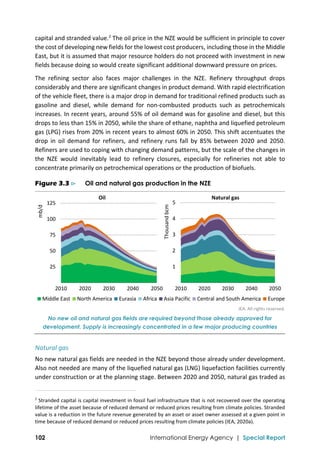
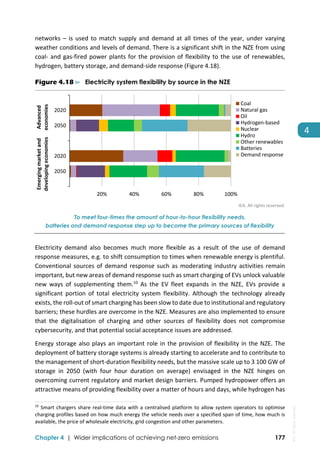
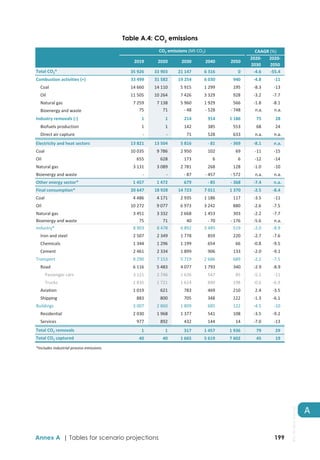
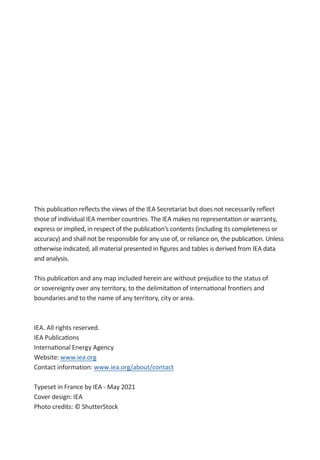
Organization of the Petroleum Exporting Countries [OPEC]) gain market share in these
circumstances, but even they would see large falls in revenues. Structural reforms would be
needed to address the societal challenges, including those to accelerate the process of
reforming inefficient fossil fuel subsidies and to speed up moves to use hydrocarbon
resources to produce low‐emissions fuels, e.g. hydrogen and hydrogen‐based fuels (see
section 4.3.1).
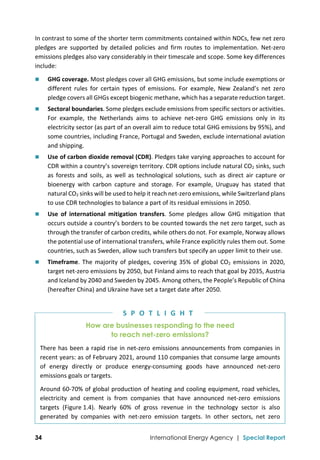
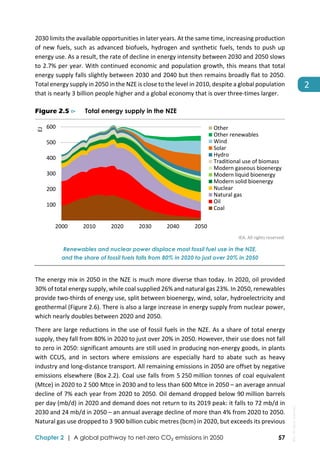
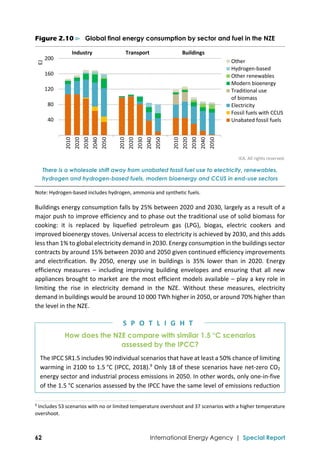
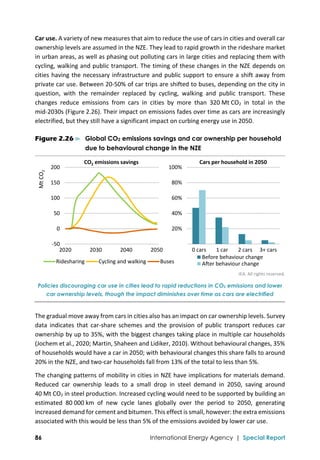
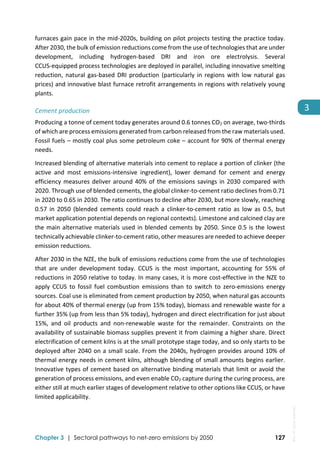
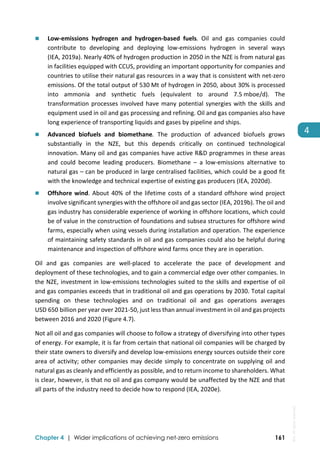
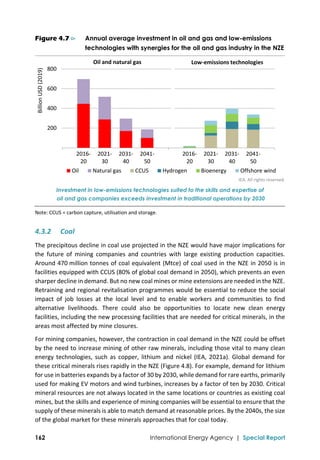
Figure 4.4 ⊳ Income from oil and gas sales in producer economies in the NZE
IEA. All rights reserved.
Structural reforms and new sources of revenue are needed in producer economies,
but these are unlikely to compensate fully for a large drop in oil and gas income
The macroeconomic effects of the NZE are very uncertain. They depend on a host of factors
including: how government expenditure is financed; benefits from improvements to health;
changes in consumer bills; broad impact of changes in consumer behaviour; and potential
for productivity spill‐overs from accelerated energy innovation. Nonetheless, impacts are
likely to be lower than assessments of the cost of climate change damages (OECD, 2015). It
is also likely that a co‐ordinated, orderly transition can be executed without major global
systemic financial impacts, but this will require close attention from governments, financial
regulators and the corporate sector.
4.2.3 Employment
Employment in the energy sector shifts markedly in the NZE in response to changes in
investment and spending on energy. We estimate that today roughly 40 million people
around the world work directly in the oil, gas, coal, renewables, bioenergy and energy
network industries (IEA, 2020b). In the NZE, clean energy employment increases by 14 million
0.4
0.8
1.2
1.6
2.0
200
400
600
800
1 000
1971‐
80
1981‐
90
1991‐
00
2001‐
10
2011‐
20
2021‐
30
2031‐
40
2041‐
50
Thousand USD per capita
Billion USD (2019)
Oil Natural gas Per capita income (right axis)
IEA.
All
rights
reserved.](https://image.slidesharecdn.com/netzeroby2050-aroadmapfortheglobalenergysector-210524144348/85/IEA-Flagship-report-Net-Zero-by-2050-158-320.jpg)


This document summarizes a report by the International Energy Agency (IEA) that outlines a pathway for the global energy sector to reach net zero emissions by 2050. The report involved extensive modeling and analysis from IEA teams. It sets out over 400 milestones across all sectors and technologies that must be achieved to transform the global energy system from one dominated by fossil fuels to one powered predominantly by renewable energy like solar and wind. The pathway is challenging but aims to be technically feasible, cost-effective, and socially acceptable. It provides an important guide for governments, businesses, investors and citizens to take urgent climate action this decade.


