ICU MULTIVIEW
•
1 like•545 views

An overview of our ability to view multiple targets and/or data sources on the same map for comparison.
Report
Share
Report
Share
Download to read offline

Recommended
Icu multiview 1.1
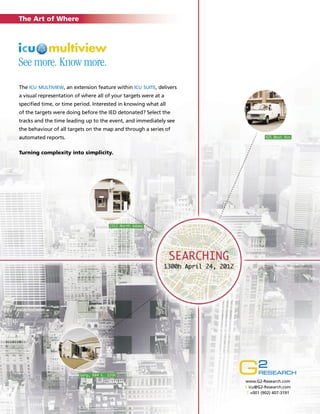
icu multiview is a feature within the icu suite that provides a visual representation of the locations and movements of multiple targets over a specified time period. It displays the concurrent travel and destinations of all requested targets on a single map with color-coding to distinguish between stationary and moving targets. Users can select targets and a time range, such as before an IED detonation, to immediately see the behavior of all targets. icu multiview simplifies complexity by consolidating location analysis of multiple targets on one map and through automated reports.
Data visualization 1
Data visualization is becoming more important for communicating information. Early adopters like USA Today used infographics to showcase data in print newspapers. As the web developed, interactive data graphics allowed real-time visualization of data from sensors, like flood gauges during Hurricane Sandy. Modern tools have made data visualization more sophisticated and accessible, allowing anyone to explore and analyze complex datasets through easy-to-use visualizations and tell stories with numbers. Dozens of free online tools now exist for creating data visualizations without expertise in coding or expensive software.
Ar and google project glass presentation
This document discusses the history and future of augmented reality (AR). It defines AR as combining real and virtual elements. The history of AR is traced from early head-mounted displays in the 1960s used for medical and military applications, to later uses in mobile devices, games, and Google's Project Glass which aims to overlay information directly into the user's field of vision. The document also covers different methods of virtual object tracking in AR applications and how AR may continue to be applied going forward.
CARTO BUILDER: from visualization to geospatial analysis
The document discusses Carto Builder, a web-based drag-and-drop tool for geospatial analysis. It provides an overview of Carto's history and the design principles of Builder. Key features of the new Builder version include improved distribution of the sidebar, editing, and map panels, as well as new capabilities for publishing maps, advanced legends, live filtering widgets, and geospatial analyses. The goal is to make location intelligence intuitive and accessible to all users.
Opening Day
Information design is the practice of preparing information so that people can use it efficiently and effectively. It involves using visual representations like infographics to explain complex information quickly and clearly. Infographics have been used since the 1800s to communicate data through charts and graphs, and are still widely used today in fields like journalism, education, and science to help people understand and share conceptual information.
AWE Tel Aviv Startup Pitch: Omri Stein with ReSight
A Startup Pitch from the Main Stage at AWE Tel Aviv 2018 - the World's #1 XR Conference & Expo in Tel Aviv, Israel, November 5, 2018.
http://AugmentedWorldExpo.com
Augmented reality
Augmented reality (AR) is a technology that superimposes computer-generated images onto a user's view of the real world. AR has a variety of applications including mobile AR browsers, entertainment, education, and industry. Some examples of AR applications are mobile maps with location data, interactive books, manufacturing design tools, and video games. While AR provides opportunities for improved learning and interaction, some argue it could increase aggression in young people by normalizing violence through certain video game applications.
From open geographical data to tangible maps: improving the accessibility of ...
Visual maps must be transcribed into (interactive) raised-line maps to be accessible for visually impaired people. However, these tactile maps suffer from several shortcomings: they are long and expensive to produce, they cannot display a large amount of information, and they are not dynamically modifiable. A number of methods have been developed to automate the production of raised-line maps, but there is not yet any tactile map editor on the market. Tangible interactions proved to be an efficient way to help a visually impaired user manipulate spatial representations. Contrary to raised-line maps, tangible maps can be autonomously constructed and edited. In this paper, we present the scenarios and the main expected contributions of the AccessiMap project, which is based on the availability of many sources of open spatial data: 1/ facilitating the production of interactive tactile maps with the development of an open-source web-based editor; 2/ investigating the use of tangible interfaces for the autonomous construction and exploration of a map by a visually impaired user.
Recommended
Icu multiview 1.1
icu multiview is a feature within the icu suite that provides a visual representation of the locations and movements of multiple targets over a specified time period. It displays the concurrent travel and destinations of all requested targets on a single map with color-coding to distinguish between stationary and moving targets. Users can select targets and a time range, such as before an IED detonation, to immediately see the behavior of all targets. icu multiview simplifies complexity by consolidating location analysis of multiple targets on one map and through automated reports.
Data visualization 1
Data visualization is becoming more important for communicating information. Early adopters like USA Today used infographics to showcase data in print newspapers. As the web developed, interactive data graphics allowed real-time visualization of data from sensors, like flood gauges during Hurricane Sandy. Modern tools have made data visualization more sophisticated and accessible, allowing anyone to explore and analyze complex datasets through easy-to-use visualizations and tell stories with numbers. Dozens of free online tools now exist for creating data visualizations without expertise in coding or expensive software.
Ar and google project glass presentation
This document discusses the history and future of augmented reality (AR). It defines AR as combining real and virtual elements. The history of AR is traced from early head-mounted displays in the 1960s used for medical and military applications, to later uses in mobile devices, games, and Google's Project Glass which aims to overlay information directly into the user's field of vision. The document also covers different methods of virtual object tracking in AR applications and how AR may continue to be applied going forward.
CARTO BUILDER: from visualization to geospatial analysis
The document discusses Carto Builder, a web-based drag-and-drop tool for geospatial analysis. It provides an overview of Carto's history and the design principles of Builder. Key features of the new Builder version include improved distribution of the sidebar, editing, and map panels, as well as new capabilities for publishing maps, advanced legends, live filtering widgets, and geospatial analyses. The goal is to make location intelligence intuitive and accessible to all users.
Opening Day
Information design is the practice of preparing information so that people can use it efficiently and effectively. It involves using visual representations like infographics to explain complex information quickly and clearly. Infographics have been used since the 1800s to communicate data through charts and graphs, and are still widely used today in fields like journalism, education, and science to help people understand and share conceptual information.
AWE Tel Aviv Startup Pitch: Omri Stein with ReSight
A Startup Pitch from the Main Stage at AWE Tel Aviv 2018 - the World's #1 XR Conference & Expo in Tel Aviv, Israel, November 5, 2018.
http://AugmentedWorldExpo.com
Augmented reality
Augmented reality (AR) is a technology that superimposes computer-generated images onto a user's view of the real world. AR has a variety of applications including mobile AR browsers, entertainment, education, and industry. Some examples of AR applications are mobile maps with location data, interactive books, manufacturing design tools, and video games. While AR provides opportunities for improved learning and interaction, some argue it could increase aggression in young people by normalizing violence through certain video game applications.
From open geographical data to tangible maps: improving the accessibility of ...
Visual maps must be transcribed into (interactive) raised-line maps to be accessible for visually impaired people. However, these tactile maps suffer from several shortcomings: they are long and expensive to produce, they cannot display a large amount of information, and they are not dynamically modifiable. A number of methods have been developed to automate the production of raised-line maps, but there is not yet any tactile map editor on the market. Tangible interactions proved to be an efficient way to help a visually impaired user manipulate spatial representations. Contrary to raised-line maps, tangible maps can be autonomously constructed and edited. In this paper, we present the scenarios and the main expected contributions of the AccessiMap project, which is based on the availability of many sources of open spatial data: 1/ facilitating the production of interactive tactile maps with the development of an open-source web-based editor; 2/ investigating the use of tangible interfaces for the autonomous construction and exploration of a map by a visually impaired user.
RilwanKujenyaBDSDDVBAC-Thesis-HYDRAAR_larger
1) HYDRAAR is an augmented reality app designed to aid emergency professionals by visualizing important information directly in their field of view.
2) The app has different modes like Walking Mode, Glance Mode, and Full Map View to display tags, locations, and other data.
3) It is intended to assist with navigation, object detection, monitoring devices, connectivity between users, and remotely controlling devices like doors and cameras. This would allow emergency responders to make effective rescue decisions.
ICU TRACKSMITH
This document describes an intelligent tracking software called icu tracksmith that can analyze location data from multiple sources to identify travel patterns and destinations of surveillance targets. It visualizes location patterns and frequencies to determine an overall pattern of life. The software instantly generates comprehensive itinerary reports and maps to show a target's daily or full travel sequence. It is designed to make location-based surveillance more effective for law enforcement and security agencies.
Gi sdoc
Mobile Systems Research Labs has developed GIS and C4I software solutions including Map and Earth 3D modules. Map is a 2D tactical visualization module that can display vector, raster and object data layers for situational awareness. Earth 3D is a 3D tactical visualization module that can precisely display objects like vehicles and terrain in 3D along with time playback of historical data for post-mission analysis. Both modules were used to help Polish authorities respond to flooding in 2010 by creating forecasts and recommendations.
VizDyn and spatial utility Dec 2014
VizDyn is a 3D globe created by Mission Logic that allows users to visualize and analyze geospatial data. It can display thousands of data points in real-time, ingest files from other platforms like ESRI and Google Earth, and analyze streaming data like vessel locations or weather patterns. VizDyn also includes tools for sensor placement optimization, coverage analysis, and identifying satellite imagery availability. It aims to enable engineers and scientists to better understand and work with geospatial content.
ICU Enterprise
The document describes a web-based software called icu enterprise that analyzes location data from multiple sources to identify patterns of life. It can now be deployed centrally for an entire organization on their secure network server. The icu enterprise provides enhanced capabilities like new reporting functionality and interface upgrades while supporting multiple simultaneous users analyzing the same data. It saves organizations significant time and costs in their analysis and can pay for itself within weeks.
ICU TRACKNET
icu tracknet is a software that analyzes geo-location data from multiple targets to identify relationships between targets and uncover criminal networks. It can identify who meets who, where, when, and for how long by surfacing common meeting locations and offset meeting times that may indicate dead-drop activity. The software prioritizes targets, finds meeting locations, and provides an immediate understanding of all relationships within a network to help investigators and analysts acquire targets faster and improve mission success.
ICU CELLULAR
The document describes a cell ping companion called icu cellular. It defines cell surveillance, cell ping data, and icu cellular. Icu cellular is a solution that collects email data from carriers about a target's location, processes it, and plots the target's movement on a map automatically. It can live track up to 5 targets simultaneously, export data in an open format, and instantly view or filter a target's historical travel. Icu cellular organizes cell ping data to monitor target movement without having to decipher individual emails.
L IVE T ILES I N M AINFRAME
This paper proposes the usage of Live Tiles Usabili
ty Experience in Mainframes. The UI
experience was brought into the mainframe CICS maps
. The map related parameters and
attributes are used for achieving the live tiles di
splay and enhancing the user experience. The
dynamic tiles UI is provided with location based in
terfacing on the CICS map. The concept of
Temporary storage Queue (TSQ) is implemented in ord
er to display the information and the
concept of cursor positioning is also used to make
the application user friendly. This paper also
addresses how Live Tiles will improve the user inte
rface in Mainframes. Live tile is implemented
using COBOL, DB2, CICS in mainframe
Sample - Extending IBM i2 Analysis with G2 Research
This document demonstrates how tracking data from GPS tags and other sources can be analyzed in ICU Workbench and integrated into IBM i2 Analyst's Notebook to assist an investigation. ICU Workbench identified unusual patterns in a person of interest's movements. When this data was exported to i2, it revealed connections between individuals that helped uncover a relationship involving bribery between a criminal gang and a court official. Analyzing tracking data in this integrated way provided valuable intelligence that helped resolve the case.
ICU WORKBENCH - The Art of Where
The document summarizes an ICU Workbench location analysis solution. It rapidly analyzes geo-temporal data from surveillance to identify patterns of life, destinations visited, and connections between targets. This saves analysts significant time over manual analysis. It can process long-term tracking data and combine disparate sources for comprehensive insights into target behavior. The solution has proven effective in intelligence and law enforcement operations.
ICU PREDICTIONS
The document discusses an "icu predictions module" that analyzes historical tracking data to generate a "travel fingerprint" of a target, allowing users to predict future activity and optimize mission planning. It claims this improves target acquisition, takedown planning, and the safety and efficiency of surveillance teams. The module uses a target's full historical travel patterns to produce concise summaries and predictions, helping with mission success, faster target acquisition, and maximizing safety.
ICU OBSERVER
The document describes an electronic monitoring software called ICU Observer that helps corrections officials efficiently manage offender caseloads. It saves officers time by rapidly visualizing an offender's movement patterns over any time period to answer questions about where they went, how often, and who they met. It processes data from any electronic monitoring provider and allows officers to flag locations or be alerted to entirely new places. This helps identify any needed investigation into an offender's activities while saving officers valuable time.
icuWorkbench - Use cases
The document discusses the ICU Workbench software tool which analyzes tracking data to identify patterns of life and travel patterns. It is used by law enforcement and intelligence organizations. The software has 5 key modules and has helped customers by reducing analysis time, identifying targets' homes and work locations, combining different data sources, and discovering relationships between targets. Specific use cases are provided where the software helped catch criminals and uncover intelligence.
Case Study - Waterloo Regional Police
The Waterloo Regional Police Service used to have an investigator spend full time manually analyzing location data from tracking devices and cell phones to generate reports on suspects' patterns of movement and activities. This was a time-consuming process. The police service purchased ICU Workbench software, which automatically analyzes location data and generates pattern of life reports. This new process provides deeper insights into suspects' behaviors more quickly. It allows the investigator previously dedicated to data analysis to return to field work, while gaining more powerful intelligence. The new software has significantly reduced the time needed to analyze location data and freed up resources for more optimal use.
Military - Overview
G2 Research provides software to defense, intelligence, and law enforcement agencies to analyze location-based surveillance data and extract actionable intelligence. Their software can summarize over 80,000 location fixes from 51 days of tracking data into a visual representation in under 2 minutes. This helps analysts who currently spend most of their time on data collection and only 20% of their time creating intelligence. The software also enables predictions of targets' patterns of life and identification of networks and locations of interest to improve mission planning and coordination of surveillance teams.
Law Enforcement - Overview
This document discusses how analyzing location data from GPS devices, calls, social media, and other sources can provide critical intelligence to save lives, improve mission planning, and reduce costs. It describes how a software tool can convert hundreds of thousands of data points into actionable intelligence like patterns of life, call detail analysis, comparisons of entities, multi-target analysis, and predictions. This intelligence enables force multiplication, faster access to information, increased value of surveillance investments, and safety for agents.
Uni Systems Copilot event_05062024_C.Vlachos.pdf
Unlocking Productivity: Leveraging the Potential of Copilot in Microsoft 365, a presentation by Christoforos Vlachos, Senior Solutions Manager – Modern Workplace, Uni Systems
Alt. GDG Cloud Southlake #33: Boule & Rebala: Effective AppSec in SDLC using ...
Effective Application Security in Software Delivery lifecycle using Deployment Firewall and DBOM
The modern software delivery process (or the CI/CD process) includes many tools, distributed teams, open-source code, and cloud platforms. Constant focus on speed to release software to market, along with the traditional slow and manual security checks has caused gaps in continuous security as an important piece in the software supply chain. Today organizations feel more susceptible to external and internal cyber threats due to the vast attack surface in their applications supply chain and the lack of end-to-end governance and risk management.
The software team must secure its software delivery process to avoid vulnerability and security breaches. This needs to be achieved with existing tool chains and without extensive rework of the delivery processes. This talk will present strategies and techniques for providing visibility into the true risk of the existing vulnerabilities, preventing the introduction of security issues in the software, resolving vulnerabilities in production environments quickly, and capturing the deployment bill of materials (DBOM).
Speakers:
Bob Boule
Robert Boule is a technology enthusiast with PASSION for technology and making things work along with a knack for helping others understand how things work. He comes with around 20 years of solution engineering experience in application security, software continuous delivery, and SaaS platforms. He is known for his dynamic presentations in CI/CD and application security integrated in software delivery lifecycle.
Gopinath Rebala
Gopinath Rebala is the CTO of OpsMx, where he has overall responsibility for the machine learning and data processing architectures for Secure Software Delivery. Gopi also has a strong connection with our customers, leading design and architecture for strategic implementations. Gopi is a frequent speaker and well-known leader in continuous delivery and integrating security into software delivery.
GraphSummit Singapore | The Future of Agility: Supercharging Digital Transfor...
Leonard Jayamohan, Partner & Generative AI Lead, Deloitte
This keynote will reveal how Deloitte leverages Neo4j’s graph power for groundbreaking digital twin solutions, achieving a staggering 100x performance boost. Discover the essential role knowledge graphs play in successful generative AI implementations. Plus, get an exclusive look at an innovative Neo4j + Generative AI solution Deloitte is developing in-house.
Full-RAG: A modern architecture for hyper-personalization
Mike Del Balso, CEO & Co-Founder at Tecton, presents "Full RAG," a novel approach to AI recommendation systems, aiming to push beyond the limitations of traditional models through a deep integration of contextual insights and real-time data, leveraging the Retrieval-Augmented Generation architecture. This talk will outline Full RAG's potential to significantly enhance personalization, address engineering challenges such as data management and model training, and introduce data enrichment with reranking as a key solution. Attendees will gain crucial insights into the importance of hyperpersonalization in AI, the capabilities of Full RAG for advanced personalization, and strategies for managing complex data integrations for deploying cutting-edge AI solutions.
GraphSummit Singapore | Neo4j Product Vision & Roadmap - Q2 2024
Maruthi Prithivirajan, Head of ASEAN & IN Solution Architecture, Neo4j
Get an inside look at the latest Neo4j innovations that enable relationship-driven intelligence at scale. Learn more about the newest cloud integrations and product enhancements that make Neo4j an essential choice for developers building apps with interconnected data and generative AI.
More Related Content
Similar to ICU MULTIVIEW
RilwanKujenyaBDSDDVBAC-Thesis-HYDRAAR_larger
1) HYDRAAR is an augmented reality app designed to aid emergency professionals by visualizing important information directly in their field of view.
2) The app has different modes like Walking Mode, Glance Mode, and Full Map View to display tags, locations, and other data.
3) It is intended to assist with navigation, object detection, monitoring devices, connectivity between users, and remotely controlling devices like doors and cameras. This would allow emergency responders to make effective rescue decisions.
ICU TRACKSMITH
This document describes an intelligent tracking software called icu tracksmith that can analyze location data from multiple sources to identify travel patterns and destinations of surveillance targets. It visualizes location patterns and frequencies to determine an overall pattern of life. The software instantly generates comprehensive itinerary reports and maps to show a target's daily or full travel sequence. It is designed to make location-based surveillance more effective for law enforcement and security agencies.
Gi sdoc
Mobile Systems Research Labs has developed GIS and C4I software solutions including Map and Earth 3D modules. Map is a 2D tactical visualization module that can display vector, raster and object data layers for situational awareness. Earth 3D is a 3D tactical visualization module that can precisely display objects like vehicles and terrain in 3D along with time playback of historical data for post-mission analysis. Both modules were used to help Polish authorities respond to flooding in 2010 by creating forecasts and recommendations.
VizDyn and spatial utility Dec 2014
VizDyn is a 3D globe created by Mission Logic that allows users to visualize and analyze geospatial data. It can display thousands of data points in real-time, ingest files from other platforms like ESRI and Google Earth, and analyze streaming data like vessel locations or weather patterns. VizDyn also includes tools for sensor placement optimization, coverage analysis, and identifying satellite imagery availability. It aims to enable engineers and scientists to better understand and work with geospatial content.
ICU Enterprise
The document describes a web-based software called icu enterprise that analyzes location data from multiple sources to identify patterns of life. It can now be deployed centrally for an entire organization on their secure network server. The icu enterprise provides enhanced capabilities like new reporting functionality and interface upgrades while supporting multiple simultaneous users analyzing the same data. It saves organizations significant time and costs in their analysis and can pay for itself within weeks.
ICU TRACKNET
icu tracknet is a software that analyzes geo-location data from multiple targets to identify relationships between targets and uncover criminal networks. It can identify who meets who, where, when, and for how long by surfacing common meeting locations and offset meeting times that may indicate dead-drop activity. The software prioritizes targets, finds meeting locations, and provides an immediate understanding of all relationships within a network to help investigators and analysts acquire targets faster and improve mission success.
ICU CELLULAR
The document describes a cell ping companion called icu cellular. It defines cell surveillance, cell ping data, and icu cellular. Icu cellular is a solution that collects email data from carriers about a target's location, processes it, and plots the target's movement on a map automatically. It can live track up to 5 targets simultaneously, export data in an open format, and instantly view or filter a target's historical travel. Icu cellular organizes cell ping data to monitor target movement without having to decipher individual emails.
L IVE T ILES I N M AINFRAME
This paper proposes the usage of Live Tiles Usabili
ty Experience in Mainframes. The UI
experience was brought into the mainframe CICS maps
. The map related parameters and
attributes are used for achieving the live tiles di
splay and enhancing the user experience. The
dynamic tiles UI is provided with location based in
terfacing on the CICS map. The concept of
Temporary storage Queue (TSQ) is implemented in ord
er to display the information and the
concept of cursor positioning is also used to make
the application user friendly. This paper also
addresses how Live Tiles will improve the user inte
rface in Mainframes. Live tile is implemented
using COBOL, DB2, CICS in mainframe
Similar to ICU MULTIVIEW (8)
More from G2 Research Ltd.
Sample - Extending IBM i2 Analysis with G2 Research
This document demonstrates how tracking data from GPS tags and other sources can be analyzed in ICU Workbench and integrated into IBM i2 Analyst's Notebook to assist an investigation. ICU Workbench identified unusual patterns in a person of interest's movements. When this data was exported to i2, it revealed connections between individuals that helped uncover a relationship involving bribery between a criminal gang and a court official. Analyzing tracking data in this integrated way provided valuable intelligence that helped resolve the case.
ICU WORKBENCH - The Art of Where
The document summarizes an ICU Workbench location analysis solution. It rapidly analyzes geo-temporal data from surveillance to identify patterns of life, destinations visited, and connections between targets. This saves analysts significant time over manual analysis. It can process long-term tracking data and combine disparate sources for comprehensive insights into target behavior. The solution has proven effective in intelligence and law enforcement operations.
ICU PREDICTIONS
The document discusses an "icu predictions module" that analyzes historical tracking data to generate a "travel fingerprint" of a target, allowing users to predict future activity and optimize mission planning. It claims this improves target acquisition, takedown planning, and the safety and efficiency of surveillance teams. The module uses a target's full historical travel patterns to produce concise summaries and predictions, helping with mission success, faster target acquisition, and maximizing safety.
ICU OBSERVER
The document describes an electronic monitoring software called ICU Observer that helps corrections officials efficiently manage offender caseloads. It saves officers time by rapidly visualizing an offender's movement patterns over any time period to answer questions about where they went, how often, and who they met. It processes data from any electronic monitoring provider and allows officers to flag locations or be alerted to entirely new places. This helps identify any needed investigation into an offender's activities while saving officers valuable time.
icuWorkbench - Use cases
The document discusses the ICU Workbench software tool which analyzes tracking data to identify patterns of life and travel patterns. It is used by law enforcement and intelligence organizations. The software has 5 key modules and has helped customers by reducing analysis time, identifying targets' homes and work locations, combining different data sources, and discovering relationships between targets. Specific use cases are provided where the software helped catch criminals and uncover intelligence.
Case Study - Waterloo Regional Police
The Waterloo Regional Police Service used to have an investigator spend full time manually analyzing location data from tracking devices and cell phones to generate reports on suspects' patterns of movement and activities. This was a time-consuming process. The police service purchased ICU Workbench software, which automatically analyzes location data and generates pattern of life reports. This new process provides deeper insights into suspects' behaviors more quickly. It allows the investigator previously dedicated to data analysis to return to field work, while gaining more powerful intelligence. The new software has significantly reduced the time needed to analyze location data and freed up resources for more optimal use.
Military - Overview
G2 Research provides software to defense, intelligence, and law enforcement agencies to analyze location-based surveillance data and extract actionable intelligence. Their software can summarize over 80,000 location fixes from 51 days of tracking data into a visual representation in under 2 minutes. This helps analysts who currently spend most of their time on data collection and only 20% of their time creating intelligence. The software also enables predictions of targets' patterns of life and identification of networks and locations of interest to improve mission planning and coordination of surveillance teams.
Law Enforcement - Overview
This document discusses how analyzing location data from GPS devices, calls, social media, and other sources can provide critical intelligence to save lives, improve mission planning, and reduce costs. It describes how a software tool can convert hundreds of thousands of data points into actionable intelligence like patterns of life, call detail analysis, comparisons of entities, multi-target analysis, and predictions. This intelligence enables force multiplication, faster access to information, increased value of surveillance investments, and safety for agents.
More from G2 Research Ltd. (8)
Sample - Extending IBM i2 Analysis with G2 Research
Sample - Extending IBM i2 Analysis with G2 Research
Recently uploaded
Uni Systems Copilot event_05062024_C.Vlachos.pdf
Unlocking Productivity: Leveraging the Potential of Copilot in Microsoft 365, a presentation by Christoforos Vlachos, Senior Solutions Manager – Modern Workplace, Uni Systems
Alt. GDG Cloud Southlake #33: Boule & Rebala: Effective AppSec in SDLC using ...
Effective Application Security in Software Delivery lifecycle using Deployment Firewall and DBOM
The modern software delivery process (or the CI/CD process) includes many tools, distributed teams, open-source code, and cloud platforms. Constant focus on speed to release software to market, along with the traditional slow and manual security checks has caused gaps in continuous security as an important piece in the software supply chain. Today organizations feel more susceptible to external and internal cyber threats due to the vast attack surface in their applications supply chain and the lack of end-to-end governance and risk management.
The software team must secure its software delivery process to avoid vulnerability and security breaches. This needs to be achieved with existing tool chains and without extensive rework of the delivery processes. This talk will present strategies and techniques for providing visibility into the true risk of the existing vulnerabilities, preventing the introduction of security issues in the software, resolving vulnerabilities in production environments quickly, and capturing the deployment bill of materials (DBOM).
Speakers:
Bob Boule
Robert Boule is a technology enthusiast with PASSION for technology and making things work along with a knack for helping others understand how things work. He comes with around 20 years of solution engineering experience in application security, software continuous delivery, and SaaS platforms. He is known for his dynamic presentations in CI/CD and application security integrated in software delivery lifecycle.
Gopinath Rebala
Gopinath Rebala is the CTO of OpsMx, where he has overall responsibility for the machine learning and data processing architectures for Secure Software Delivery. Gopi also has a strong connection with our customers, leading design and architecture for strategic implementations. Gopi is a frequent speaker and well-known leader in continuous delivery and integrating security into software delivery.
GraphSummit Singapore | The Future of Agility: Supercharging Digital Transfor...
Leonard Jayamohan, Partner & Generative AI Lead, Deloitte
This keynote will reveal how Deloitte leverages Neo4j’s graph power for groundbreaking digital twin solutions, achieving a staggering 100x performance boost. Discover the essential role knowledge graphs play in successful generative AI implementations. Plus, get an exclusive look at an innovative Neo4j + Generative AI solution Deloitte is developing in-house.
Full-RAG: A modern architecture for hyper-personalization
Mike Del Balso, CEO & Co-Founder at Tecton, presents "Full RAG," a novel approach to AI recommendation systems, aiming to push beyond the limitations of traditional models through a deep integration of contextual insights and real-time data, leveraging the Retrieval-Augmented Generation architecture. This talk will outline Full RAG's potential to significantly enhance personalization, address engineering challenges such as data management and model training, and introduce data enrichment with reranking as a key solution. Attendees will gain crucial insights into the importance of hyperpersonalization in AI, the capabilities of Full RAG for advanced personalization, and strategies for managing complex data integrations for deploying cutting-edge AI solutions.
GraphSummit Singapore | Neo4j Product Vision & Roadmap - Q2 2024
Maruthi Prithivirajan, Head of ASEAN & IN Solution Architecture, Neo4j
Get an inside look at the latest Neo4j innovations that enable relationship-driven intelligence at scale. Learn more about the newest cloud integrations and product enhancements that make Neo4j an essential choice for developers building apps with interconnected data and generative AI.
20 Comprehensive Checklist of Designing and Developing a Website
Dive into the world of Website Designing and Developing with Pixlogix! Looking to create a stunning online presence? Look no further! Our comprehensive checklist covers everything you need to know to craft a website that stands out. From user-friendly design to seamless functionality, we've got you covered. Don't miss out on this invaluable resource! Check out our checklist now at Pixlogix and start your journey towards a captivating online presence today.
Let's Integrate MuleSoft RPA, COMPOSER, APM with AWS IDP along with Slack
Discover the seamless integration of RPA (Robotic Process Automation), COMPOSER, and APM with AWS IDP enhanced with Slack notifications. Explore how these technologies converge to streamline workflows, optimize performance, and ensure secure access, all while leveraging the power of AWS IDP and real-time communication via Slack notifications.
Building RAG with self-deployed Milvus vector database and Snowpark Container...
This talk will give hands-on advice on building RAG applications with an open-source Milvus database deployed as a docker container. We will also introduce the integration of Milvus with Snowpark Container Services.
GraphSummit Singapore | The Art of the Possible with Graph - Q2 2024
Neha Bajwa, Vice President of Product Marketing, Neo4j
Join us as we explore breakthrough innovations enabled by interconnected data and AI. Discover firsthand how organizations use relationships in data to uncover contextual insights and solve our most pressing challenges – from optimizing supply chains, detecting fraud, and improving customer experiences to accelerating drug discoveries.
TrustArc Webinar - 2024 Global Privacy Survey
How does your privacy program stack up against your peers? What challenges are privacy teams tackling and prioritizing in 2024?
In the fifth annual Global Privacy Benchmarks Survey, we asked over 1,800 global privacy professionals and business executives to share their perspectives on the current state of privacy inside and outside of their organizations. This year’s report focused on emerging areas of importance for privacy and compliance professionals, including considerations and implications of Artificial Intelligence (AI) technologies, building brand trust, and different approaches for achieving higher privacy competence scores.
See how organizational priorities and strategic approaches to data security and privacy are evolving around the globe.
This webinar will review:
- The top 10 privacy insights from the fifth annual Global Privacy Benchmarks Survey
- The top challenges for privacy leaders, practitioners, and organizations in 2024
- Key themes to consider in developing and maintaining your privacy program
Cosa hanno in comune un mattoncino Lego e la backdoor XZ?
ABSTRACT: A prima vista, un mattoncino Lego e la backdoor XZ potrebbero avere in comune il fatto di essere entrambi blocchi di costruzione, o dipendenze di progetti creativi e software. La realtà è che un mattoncino Lego e il caso della backdoor XZ hanno molto di più di tutto ciò in comune.
Partecipate alla presentazione per immergervi in una storia di interoperabilità, standard e formati aperti, per poi discutere del ruolo importante che i contributori hanno in una comunità open source sostenibile.
BIO: Sostenitrice del software libero e dei formati standard e aperti. È stata un membro attivo dei progetti Fedora e openSUSE e ha co-fondato l'Associazione LibreItalia dove è stata coinvolta in diversi eventi, migrazioni e formazione relativi a LibreOffice. In precedenza ha lavorato a migrazioni e corsi di formazione su LibreOffice per diverse amministrazioni pubbliche e privati. Da gennaio 2020 lavora in SUSE come Software Release Engineer per Uyuni e SUSE Manager e quando non segue la sua passione per i computer e per Geeko coltiva la sua curiosità per l'astronomia (da cui deriva il suo nickname deneb_alpha).
Observability Concepts EVERY Developer Should Know -- DeveloperWeek Europe.pdf
Monitoring and observability aren’t traditionally found in software curriculums and many of us cobble this knowledge together from whatever vendor or ecosystem we were first introduced to and whatever is a part of your current company’s observability stack.
While the dev and ops silo continues to crumble….many organizations still relegate monitoring & observability as the purview of ops, infra and SRE teams. This is a mistake - achieving a highly observable system requires collaboration up and down the stack.
I, a former op, would like to extend an invitation to all application developers to join the observability party will share these foundational concepts to build on:
Goodbye Windows 11: Make Way for Nitrux Linux 3.5.0!
As the digital landscape continually evolves, operating systems play a critical role in shaping user experiences and productivity. The launch of Nitrux Linux 3.5.0 marks a significant milestone, offering a robust alternative to traditional systems such as Windows 11. This article delves into the essence of Nitrux Linux 3.5.0, exploring its unique features, advantages, and how it stands as a compelling choice for both casual users and tech enthusiasts.
Enchancing adoption of Open Source Libraries. A case study on Albumentations.AI
Enchancing adoption of Open Source Libraries. A case study on Albumentations.AIVladimir Iglovikov, Ph.D.
Presented by Vladimir Iglovikov:
- https://www.linkedin.com/in/iglovikov/
- https://x.com/viglovikov
- https://www.instagram.com/ternaus/
This presentation delves into the journey of Albumentations.ai, a highly successful open-source library for data augmentation.
Created out of a necessity for superior performance in Kaggle competitions, Albumentations has grown to become a widely used tool among data scientists and machine learning practitioners.
This case study covers various aspects, including:
People: The contributors and community that have supported Albumentations.
Metrics: The success indicators such as downloads, daily active users, GitHub stars, and financial contributions.
Challenges: The hurdles in monetizing open-source projects and measuring user engagement.
Development Practices: Best practices for creating, maintaining, and scaling open-source libraries, including code hygiene, CI/CD, and fast iteration.
Community Building: Strategies for making adoption easy, iterating quickly, and fostering a vibrant, engaged community.
Marketing: Both online and offline marketing tactics, focusing on real, impactful interactions and collaborations.
Mental Health: Maintaining balance and not feeling pressured by user demands.
Key insights include the importance of automation, making the adoption process seamless, and leveraging offline interactions for marketing. The presentation also emphasizes the need for continuous small improvements and building a friendly, inclusive community that contributes to the project's growth.
Vladimir Iglovikov brings his extensive experience as a Kaggle Grandmaster, ex-Staff ML Engineer at Lyft, sharing valuable lessons and practical advice for anyone looking to enhance the adoption of their open-source projects.
Explore more about Albumentations and join the community at:
GitHub: https://github.com/albumentations-team/albumentations
Website: https://albumentations.ai/
LinkedIn: https://www.linkedin.com/company/100504475
Twitter: https://x.com/albumentationsみなさんこんにちはこれ何文字まで入るの?40文字以下不可とか本当に意味わからないけどこれ限界文字数書いてないからマジでやばい文字数いけるんじゃないの?えこ...
ここ3000字までしか入らないけどタイトルの方がたくさん文字入ると思います。
“Building and Scaling AI Applications with the Nx AI Manager,” a Presentation...
“Building and Scaling AI Applications with the Nx AI Manager,” a Presentation...Edge AI and Vision Alliance
For the full video of this presentation, please visit: https://www.edge-ai-vision.com/2024/06/building-and-scaling-ai-applications-with-the-nx-ai-manager-a-presentation-from-network-optix/
Robin van Emden, Senior Director of Data Science at Network Optix, presents the “Building and Scaling AI Applications with the Nx AI Manager,” tutorial at the May 2024 Embedded Vision Summit.
In this presentation, van Emden covers the basics of scaling edge AI solutions using the Nx tool kit. He emphasizes the process of developing AI models and deploying them globally. He also showcases the conversion of AI models and the creation of effective edge AI pipelines, with a focus on pre-processing, model conversion, selecting the appropriate inference engine for the target hardware and post-processing.
van Emden shows how Nx can simplify the developer’s life and facilitate a rapid transition from concept to production-ready applications.He provides valuable insights into developing scalable and efficient edge AI solutions, with a strong focus on practical implementation.Presentation of the OECD Artificial Intelligence Review of Germany
Consult the full report at https://www.oecd.org/digital/oecd-artificial-intelligence-review-of-germany-609808d6-en.htm
Recently uploaded (20)
Alt. GDG Cloud Southlake #33: Boule & Rebala: Effective AppSec in SDLC using ...
Alt. GDG Cloud Southlake #33: Boule & Rebala: Effective AppSec in SDLC using ...
GraphSummit Singapore | The Future of Agility: Supercharging Digital Transfor...
GraphSummit Singapore | The Future of Agility: Supercharging Digital Transfor...
Full-RAG: A modern architecture for hyper-personalization
Full-RAG: A modern architecture for hyper-personalization
GraphSummit Singapore | Neo4j Product Vision & Roadmap - Q2 2024
GraphSummit Singapore | Neo4j Product Vision & Roadmap - Q2 2024
20 Comprehensive Checklist of Designing and Developing a Website
20 Comprehensive Checklist of Designing and Developing a Website
Let's Integrate MuleSoft RPA, COMPOSER, APM with AWS IDP along with Slack
Let's Integrate MuleSoft RPA, COMPOSER, APM with AWS IDP along with Slack
Building RAG with self-deployed Milvus vector database and Snowpark Container...
Building RAG with self-deployed Milvus vector database and Snowpark Container...
GraphSummit Singapore | The Art of the Possible with Graph - Q2 2024
GraphSummit Singapore | The Art of the Possible with Graph - Q2 2024
Cosa hanno in comune un mattoncino Lego e la backdoor XZ?
Cosa hanno in comune un mattoncino Lego e la backdoor XZ?
Observability Concepts EVERY Developer Should Know -- DeveloperWeek Europe.pdf
Observability Concepts EVERY Developer Should Know -- DeveloperWeek Europe.pdf
Goodbye Windows 11: Make Way for Nitrux Linux 3.5.0!
Goodbye Windows 11: Make Way for Nitrux Linux 3.5.0!
Enchancing adoption of Open Source Libraries. A case study on Albumentations.AI
Enchancing adoption of Open Source Libraries. A case study on Albumentations.AI
みなさんこんにちはこれ何文字まで入るの?40文字以下不可とか本当に意味わからないけどこれ限界文字数書いてないからマジでやばい文字数いけるんじゃないの?えこ...
みなさんこんにちはこれ何文字まで入るの?40文字以下不可とか本当に意味わからないけどこれ限界文字数書いてないからマジでやばい文字数いけるんじゃないの?えこ...
“Building and Scaling AI Applications with the Nx AI Manager,” a Presentation...
“Building and Scaling AI Applications with the Nx AI Manager,” a Presentation...
Presentation of the OECD Artificial Intelligence Review of Germany
Presentation of the OECD Artificial Intelligence Review of Germany
ICU MULTIVIEW
- 1. The Art of Where See more. Know more. The icu multiview, an extension feature within icu suite, delivers a visual representation of where all of your targets were at a specified time, or time period. Interested in knowing what all of the targets were doing before the IED detonated? Select the tracks and the time leading up to the event, and immediately see the behaviour of all targets on the map and through a series of automated reports. Turning complexity into simplicity. www.G2-Research.com E icu@G2-Research.com T +001 (902) 407-3191
- 2. The Art of Where See what all your targets were doing at the same time, on the same map. icu multiview is an extension to the icu suite. It provides a consolidated, concurrent view into the activities of a group of targets for a specified time or period of time. The travel and destinations for all of the requested targets is shown in a single grid view with applicable colour coding to differentiate between activities that indicates whether a target was stationary or in motion. The view for each target is displayed concurrently on the map and color coded to easily identify the travel of each target. Individual Reporting is also available. icu multiview will: »» Show travel from all your targets on one map »» Individual Selection of relevant times for each target »» Provides daily reporting on the targets activity icu multiview—a simple tool delivering powerful insights. Instantly compare Location Analysis for multiple targets www.G2-Research.com E icu@G2-Research.com T +001 (902) 407-3191