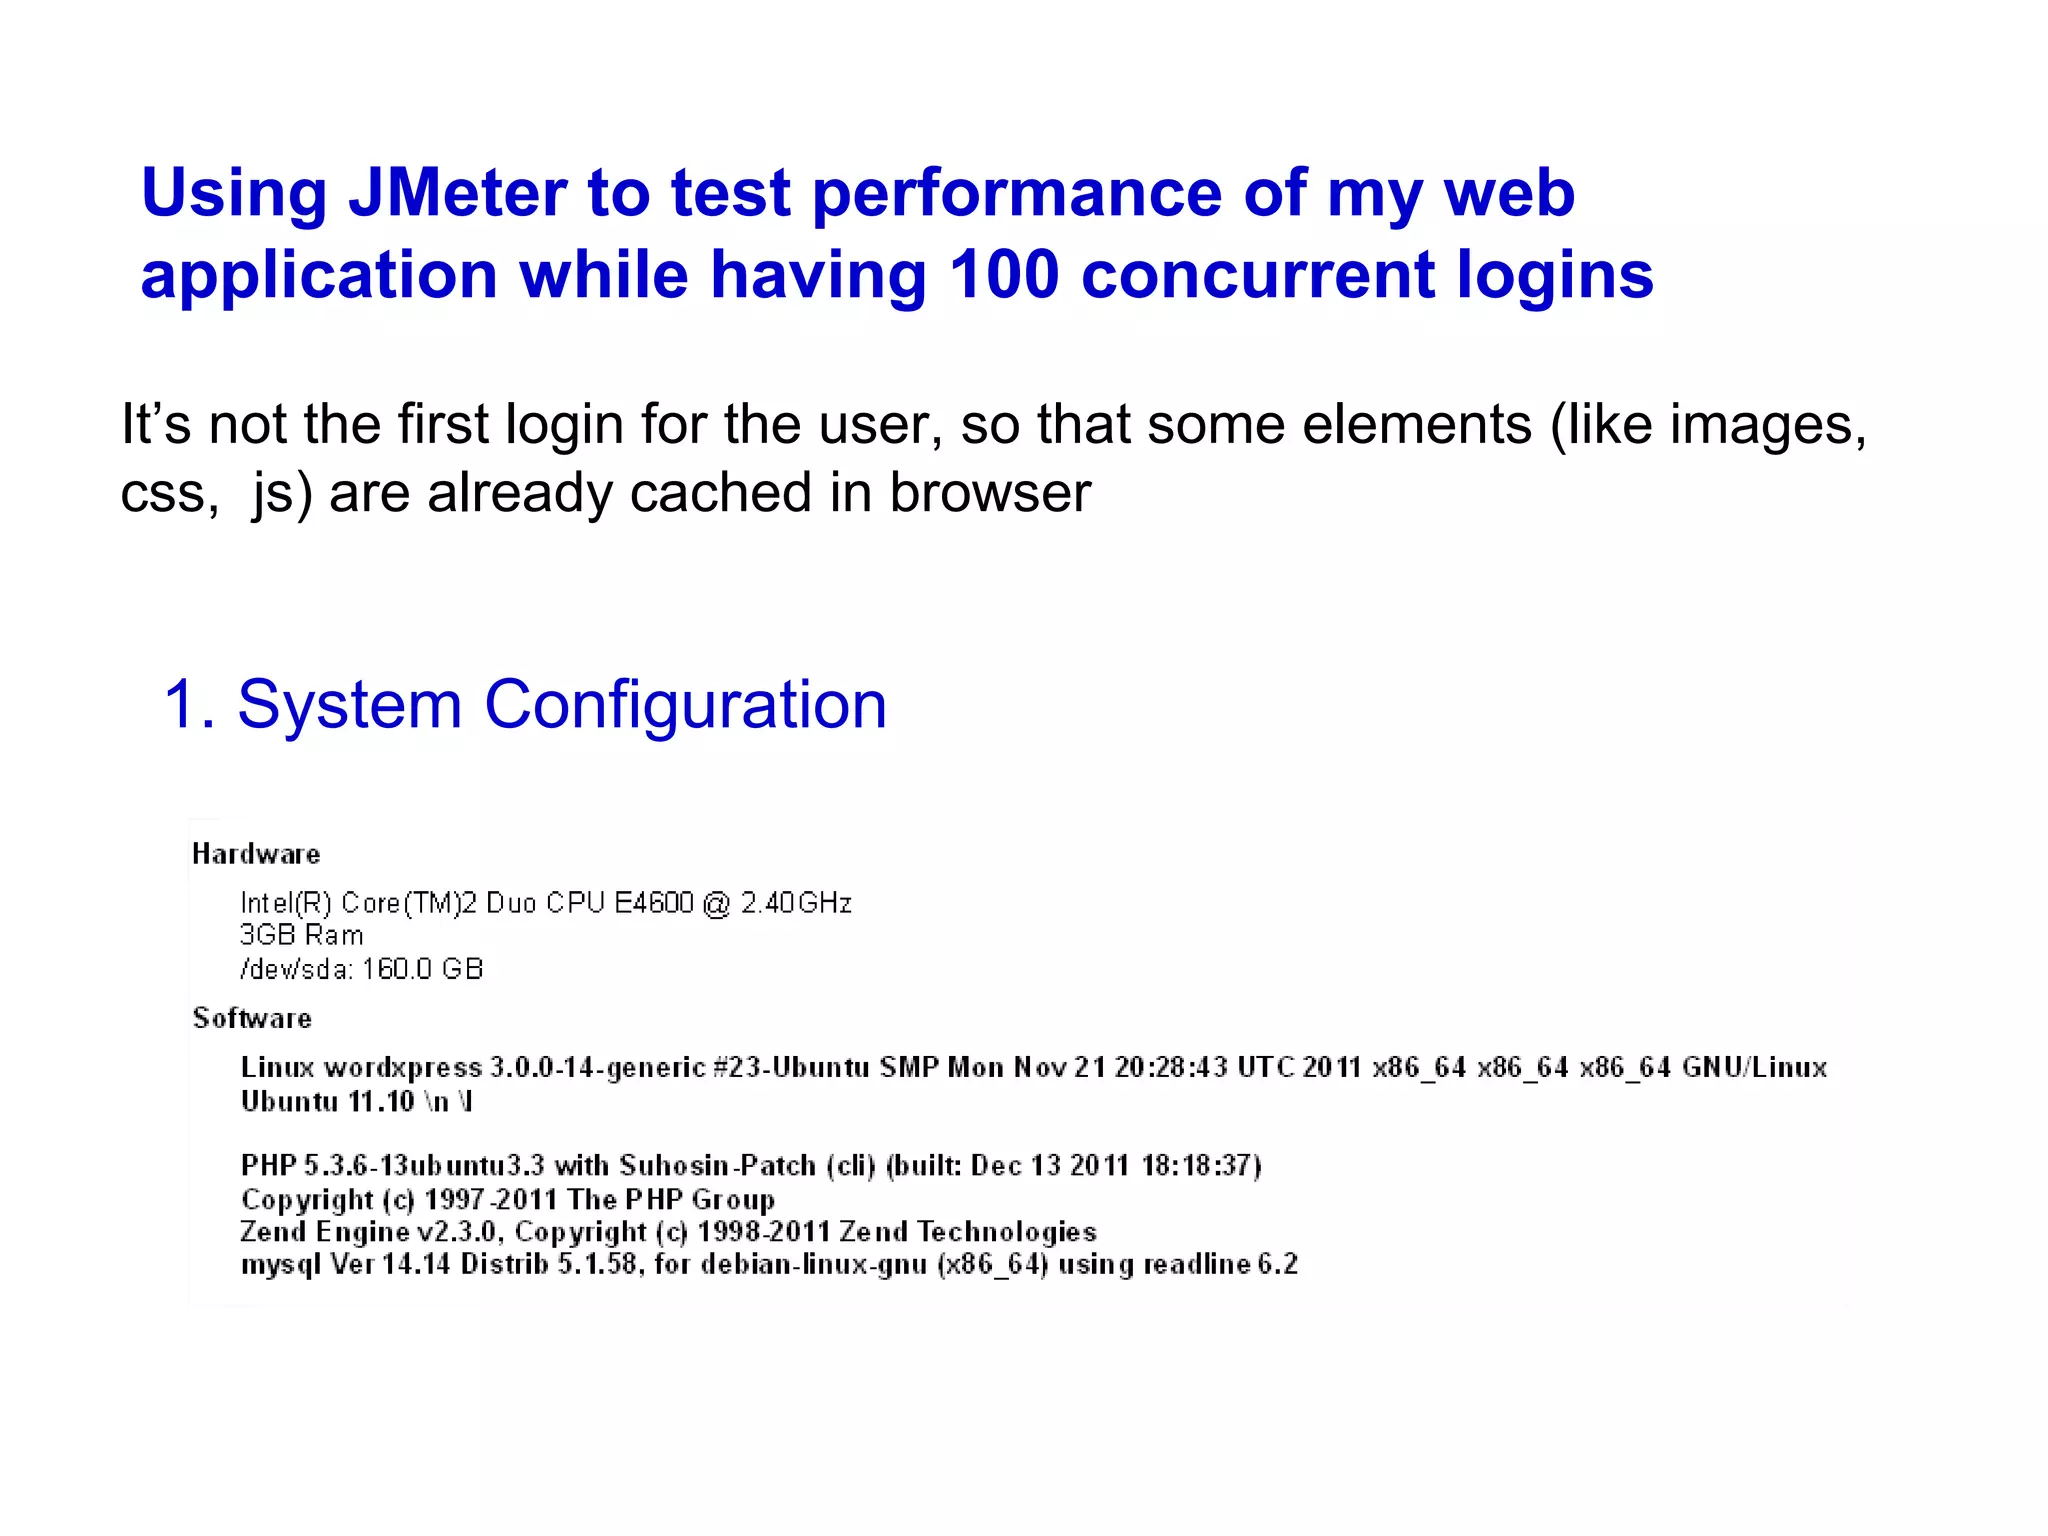
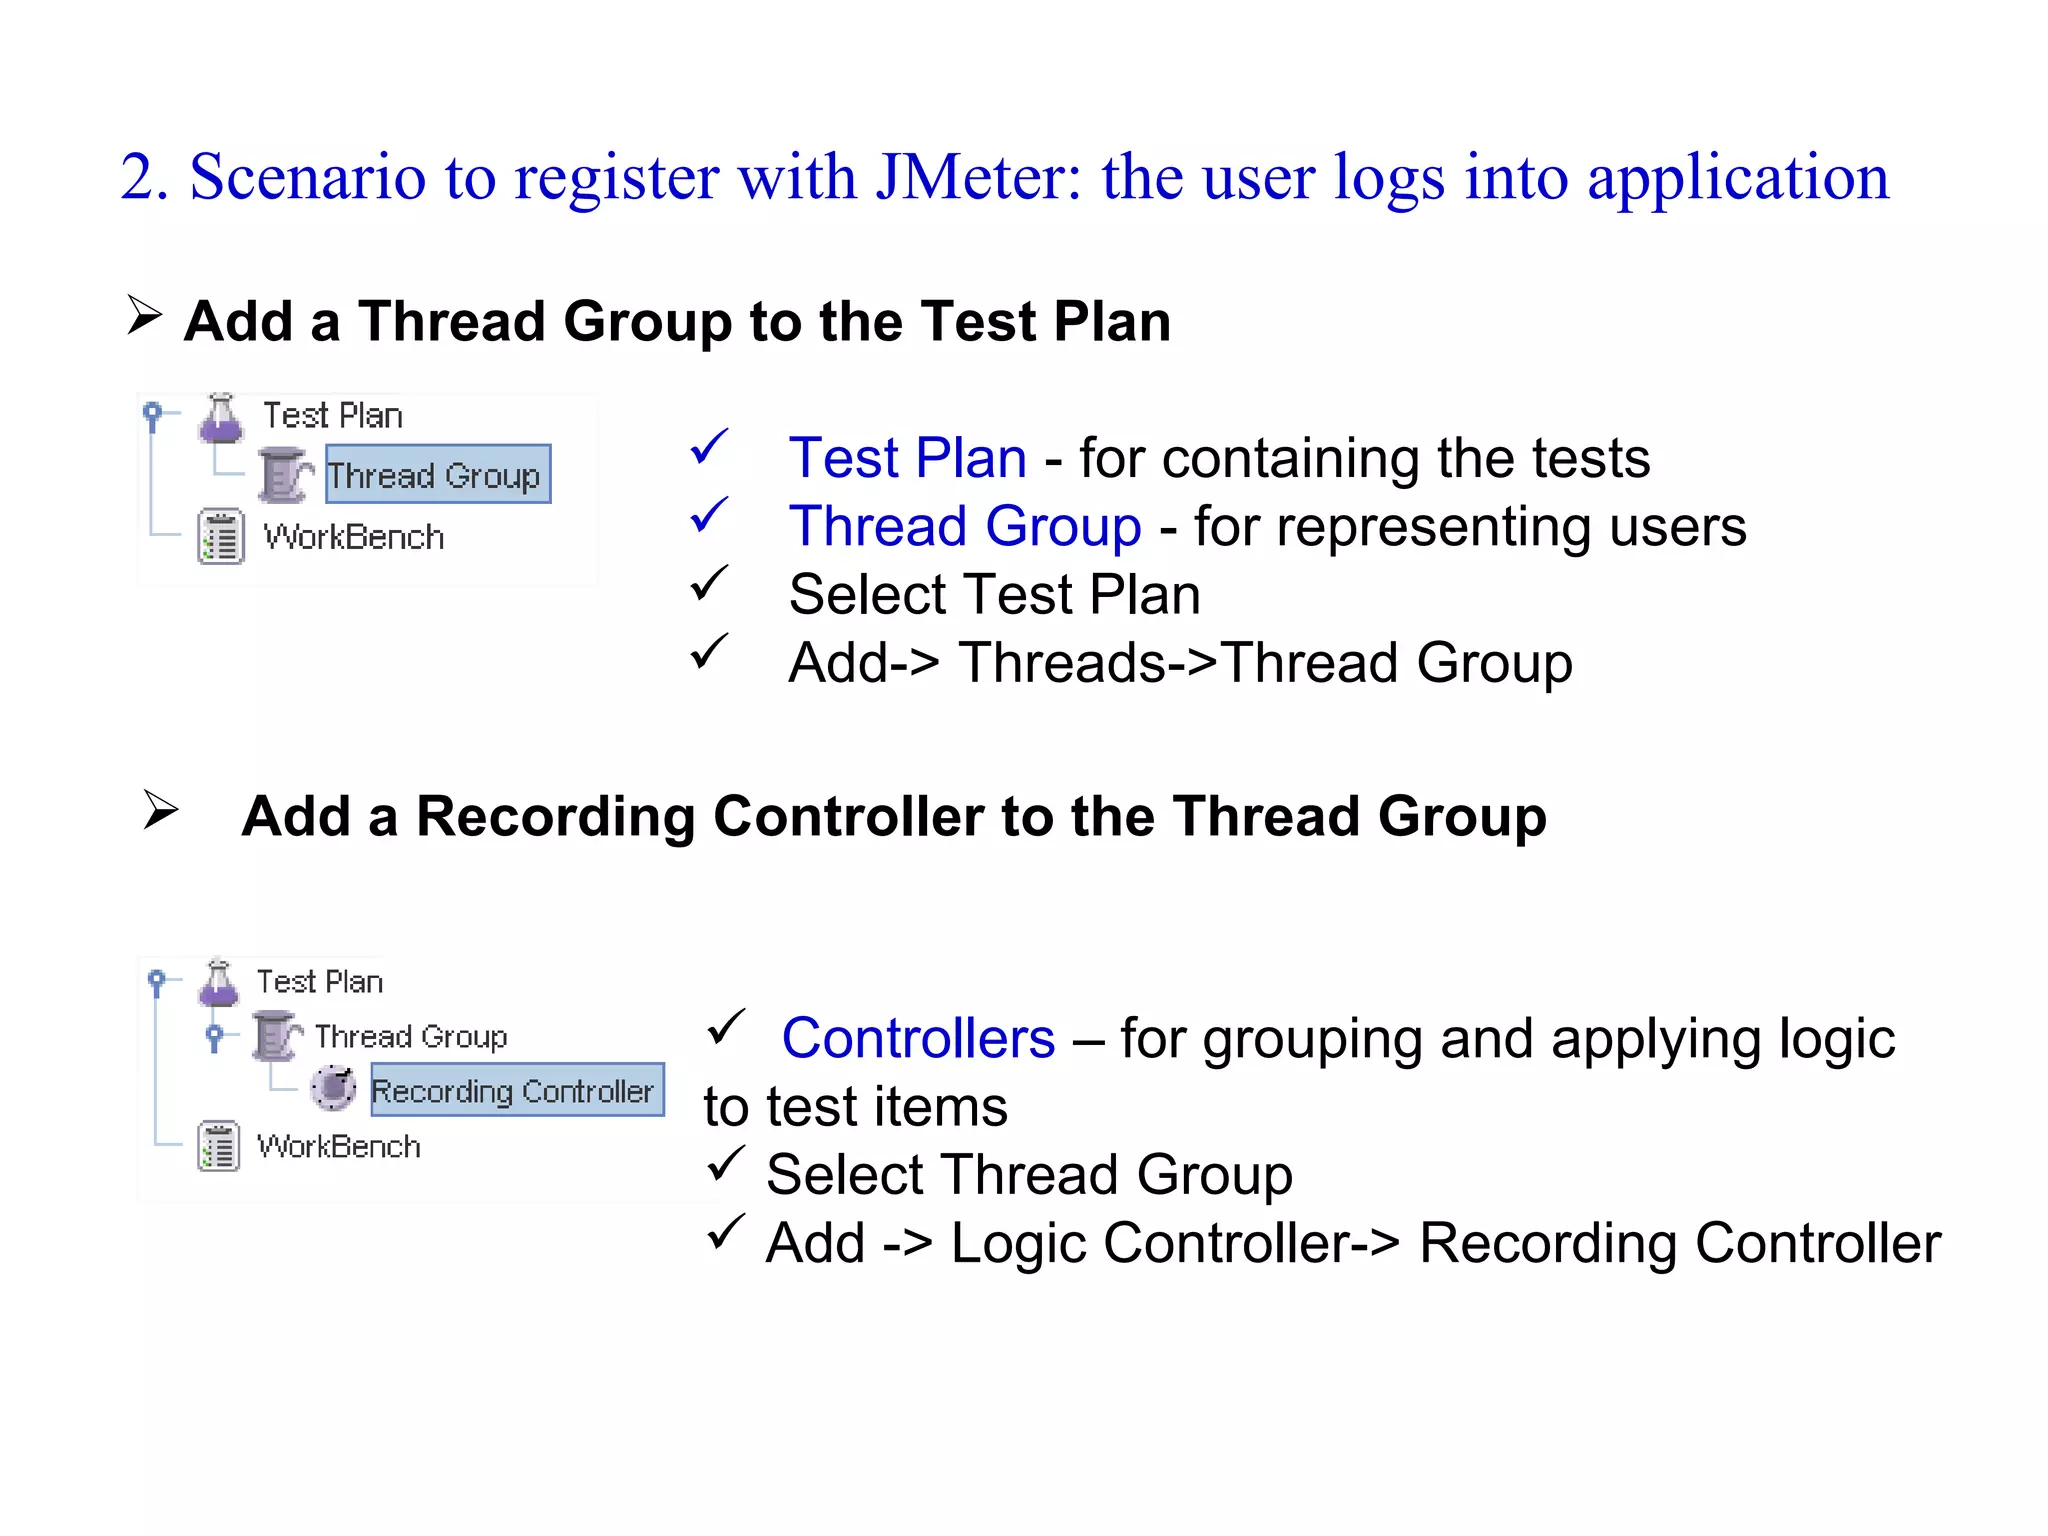
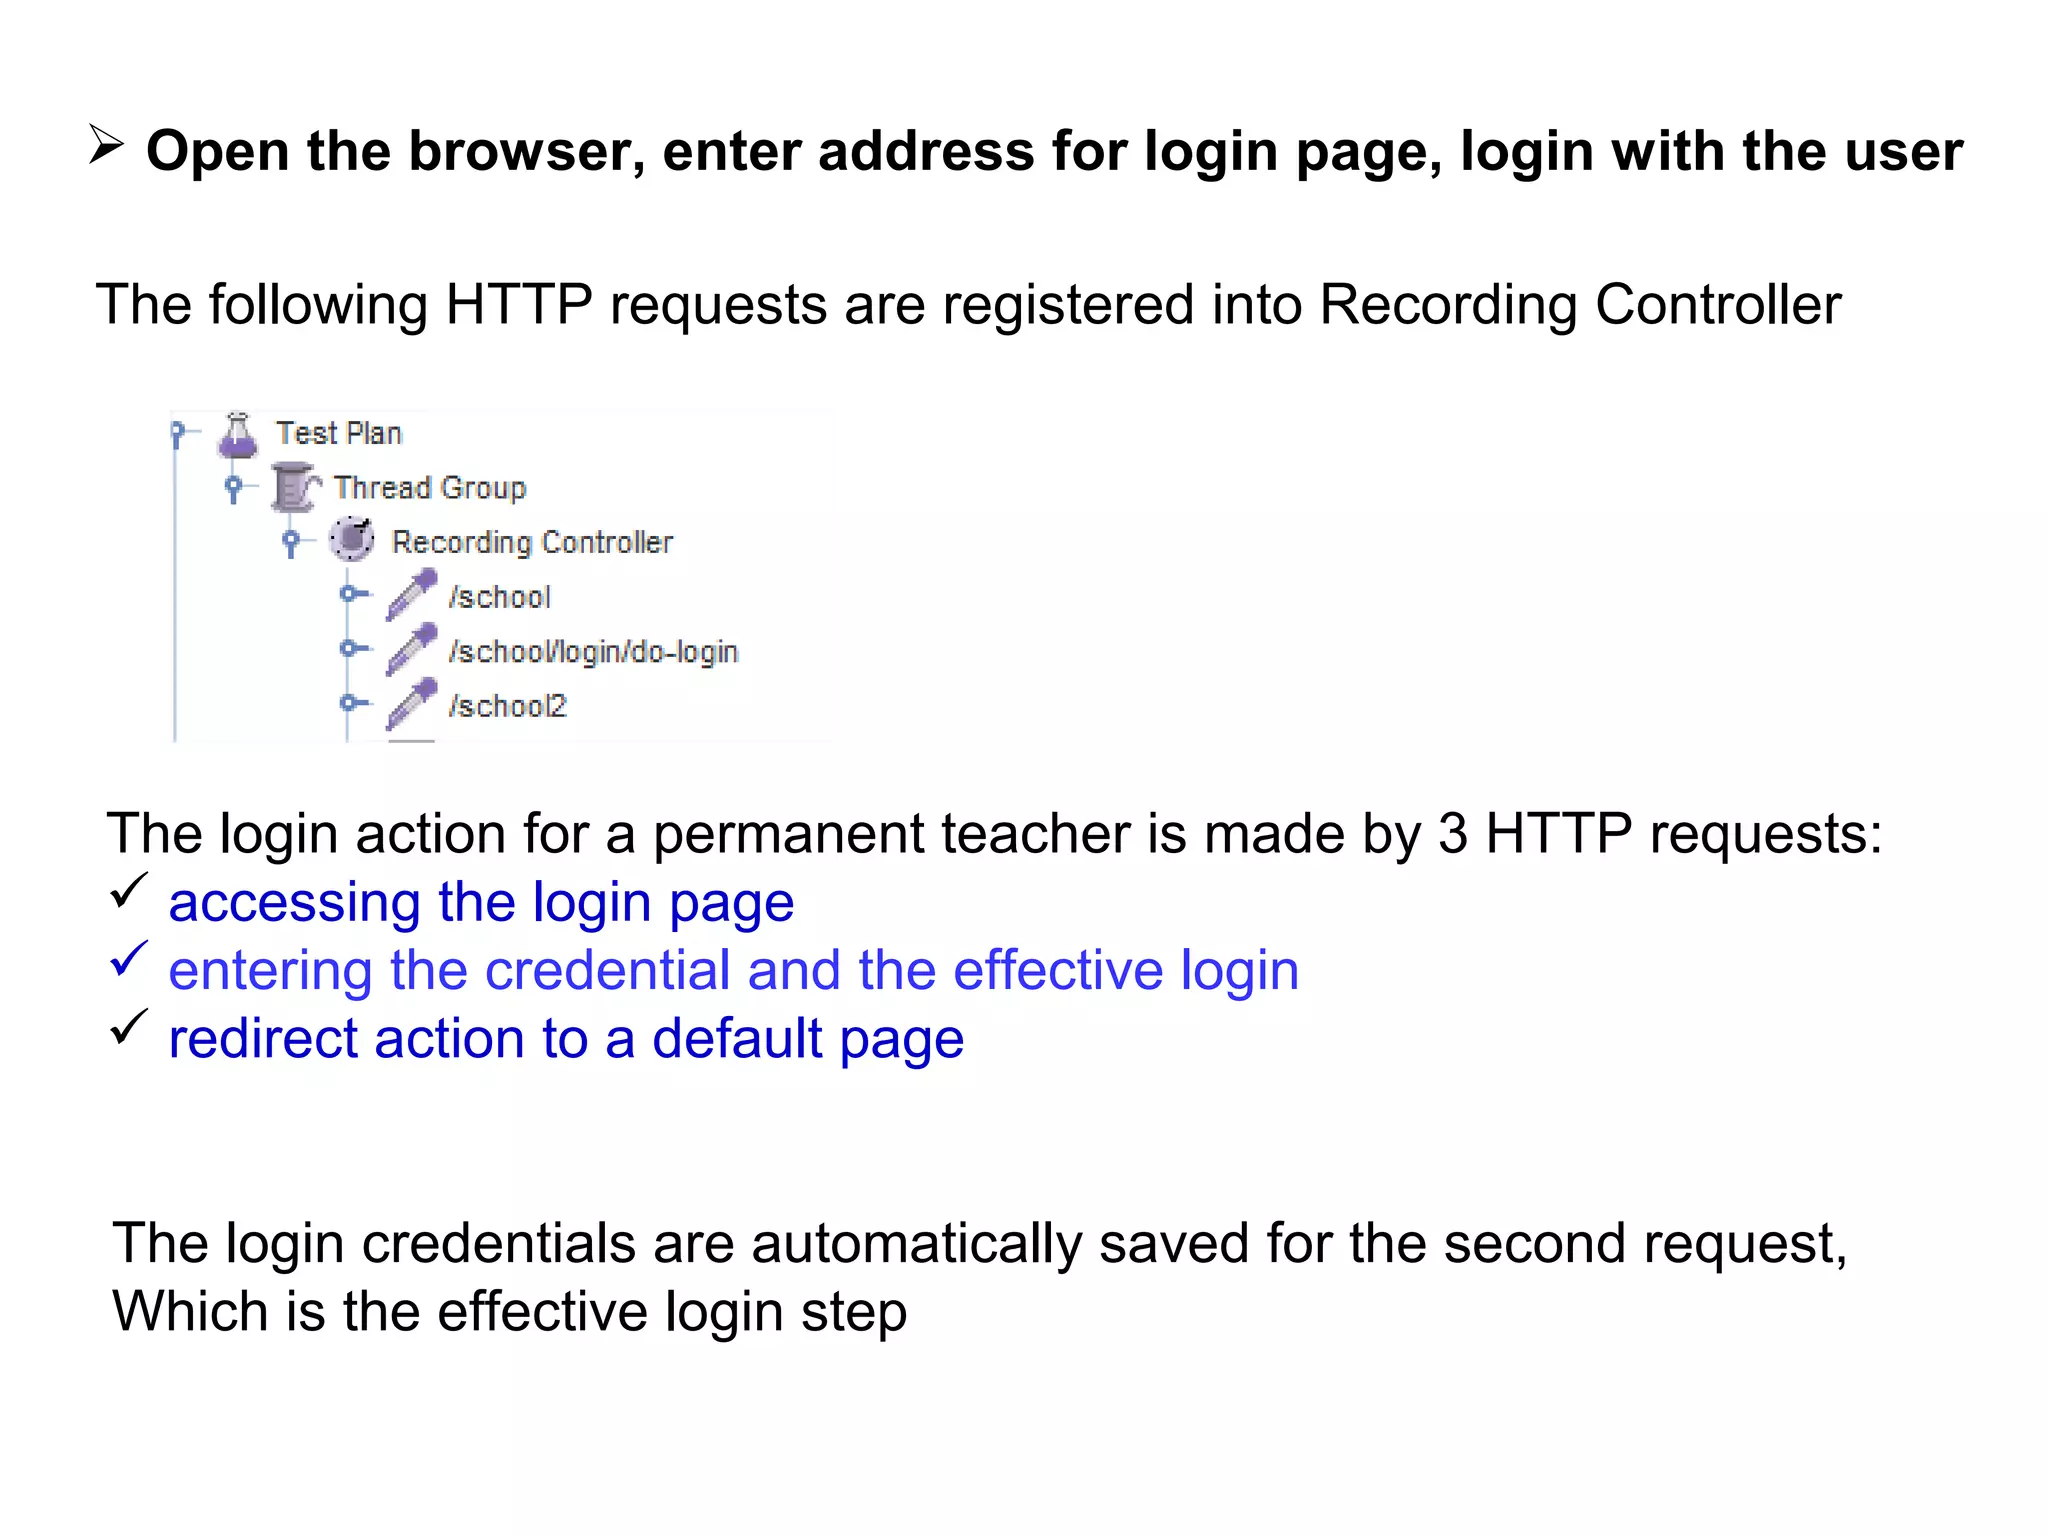
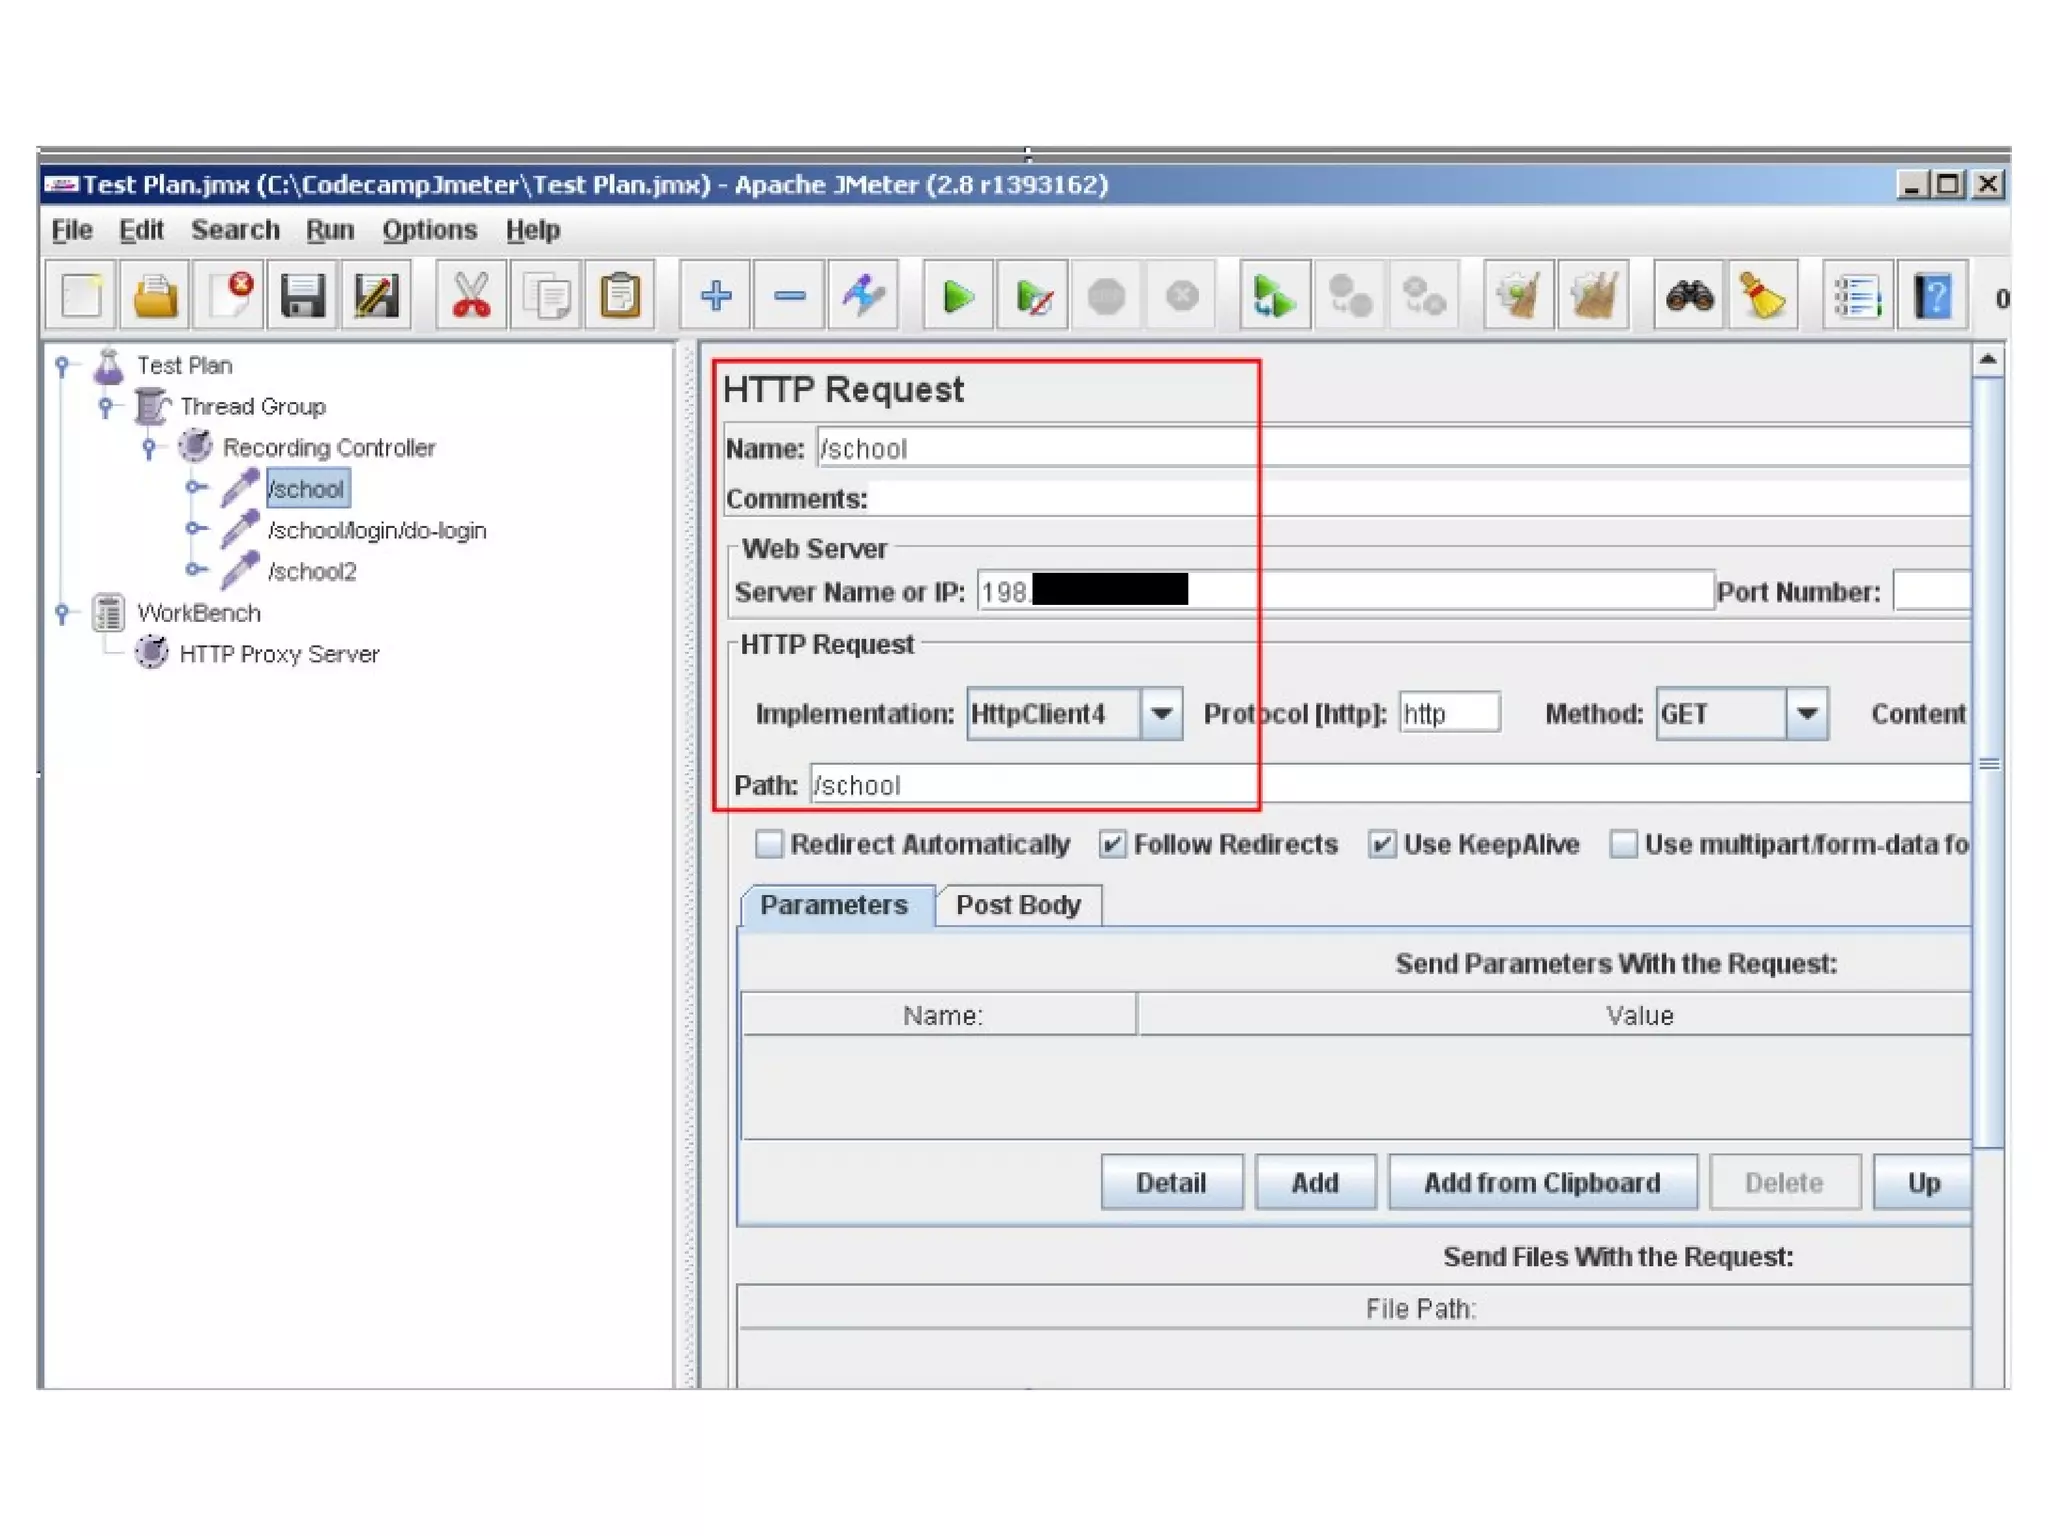
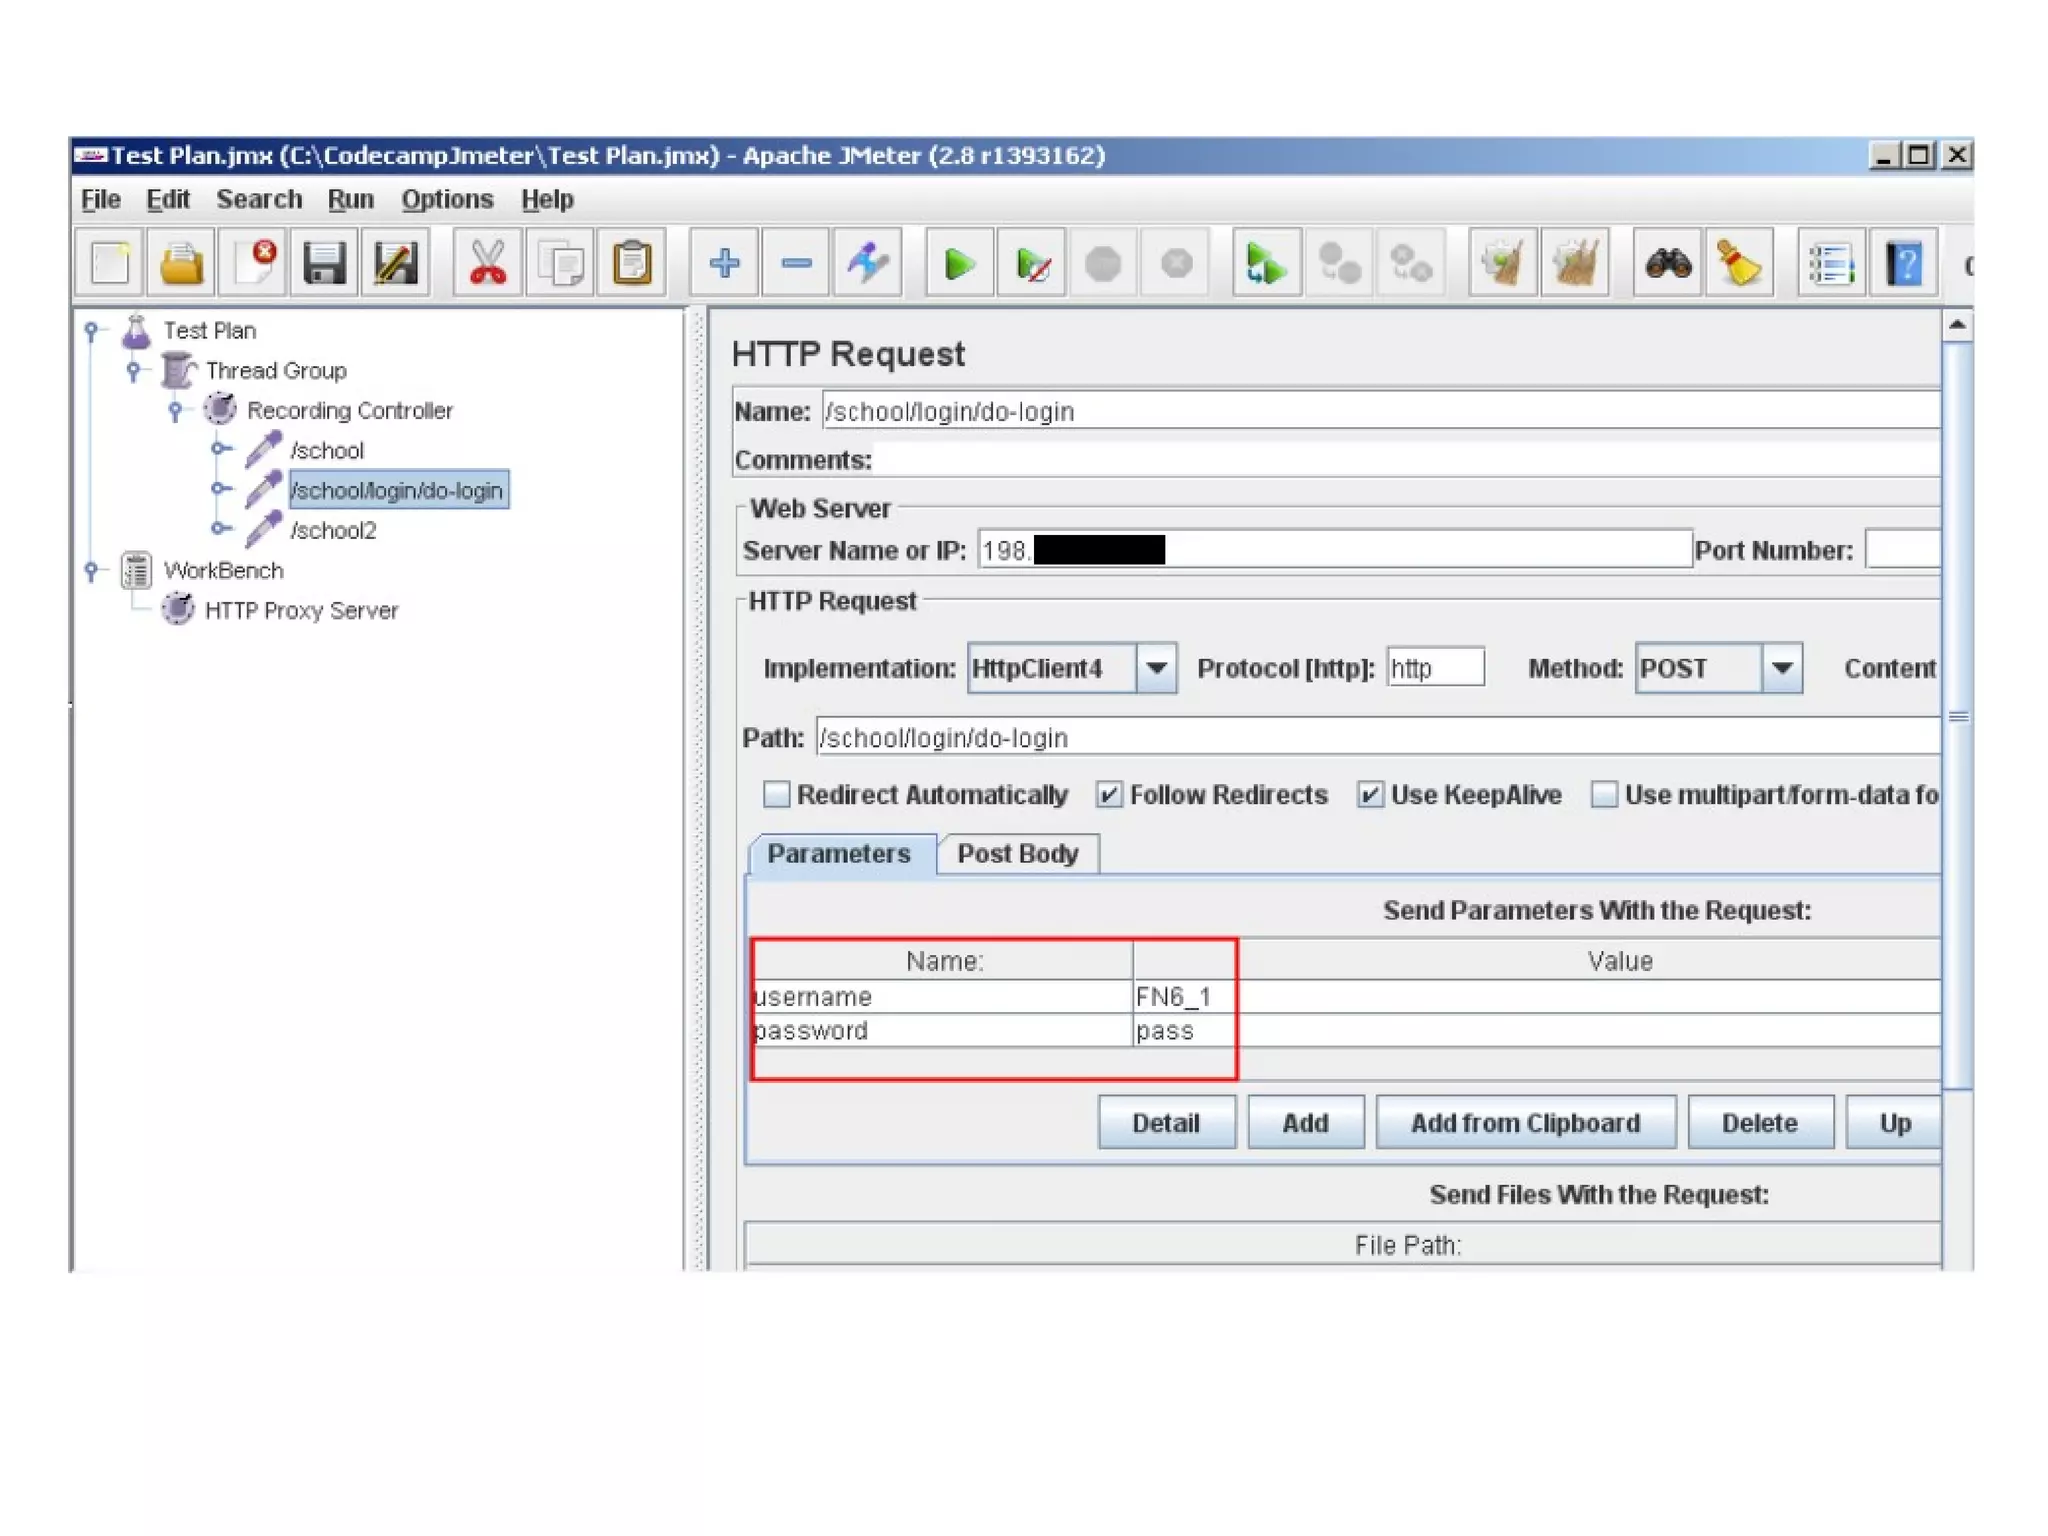
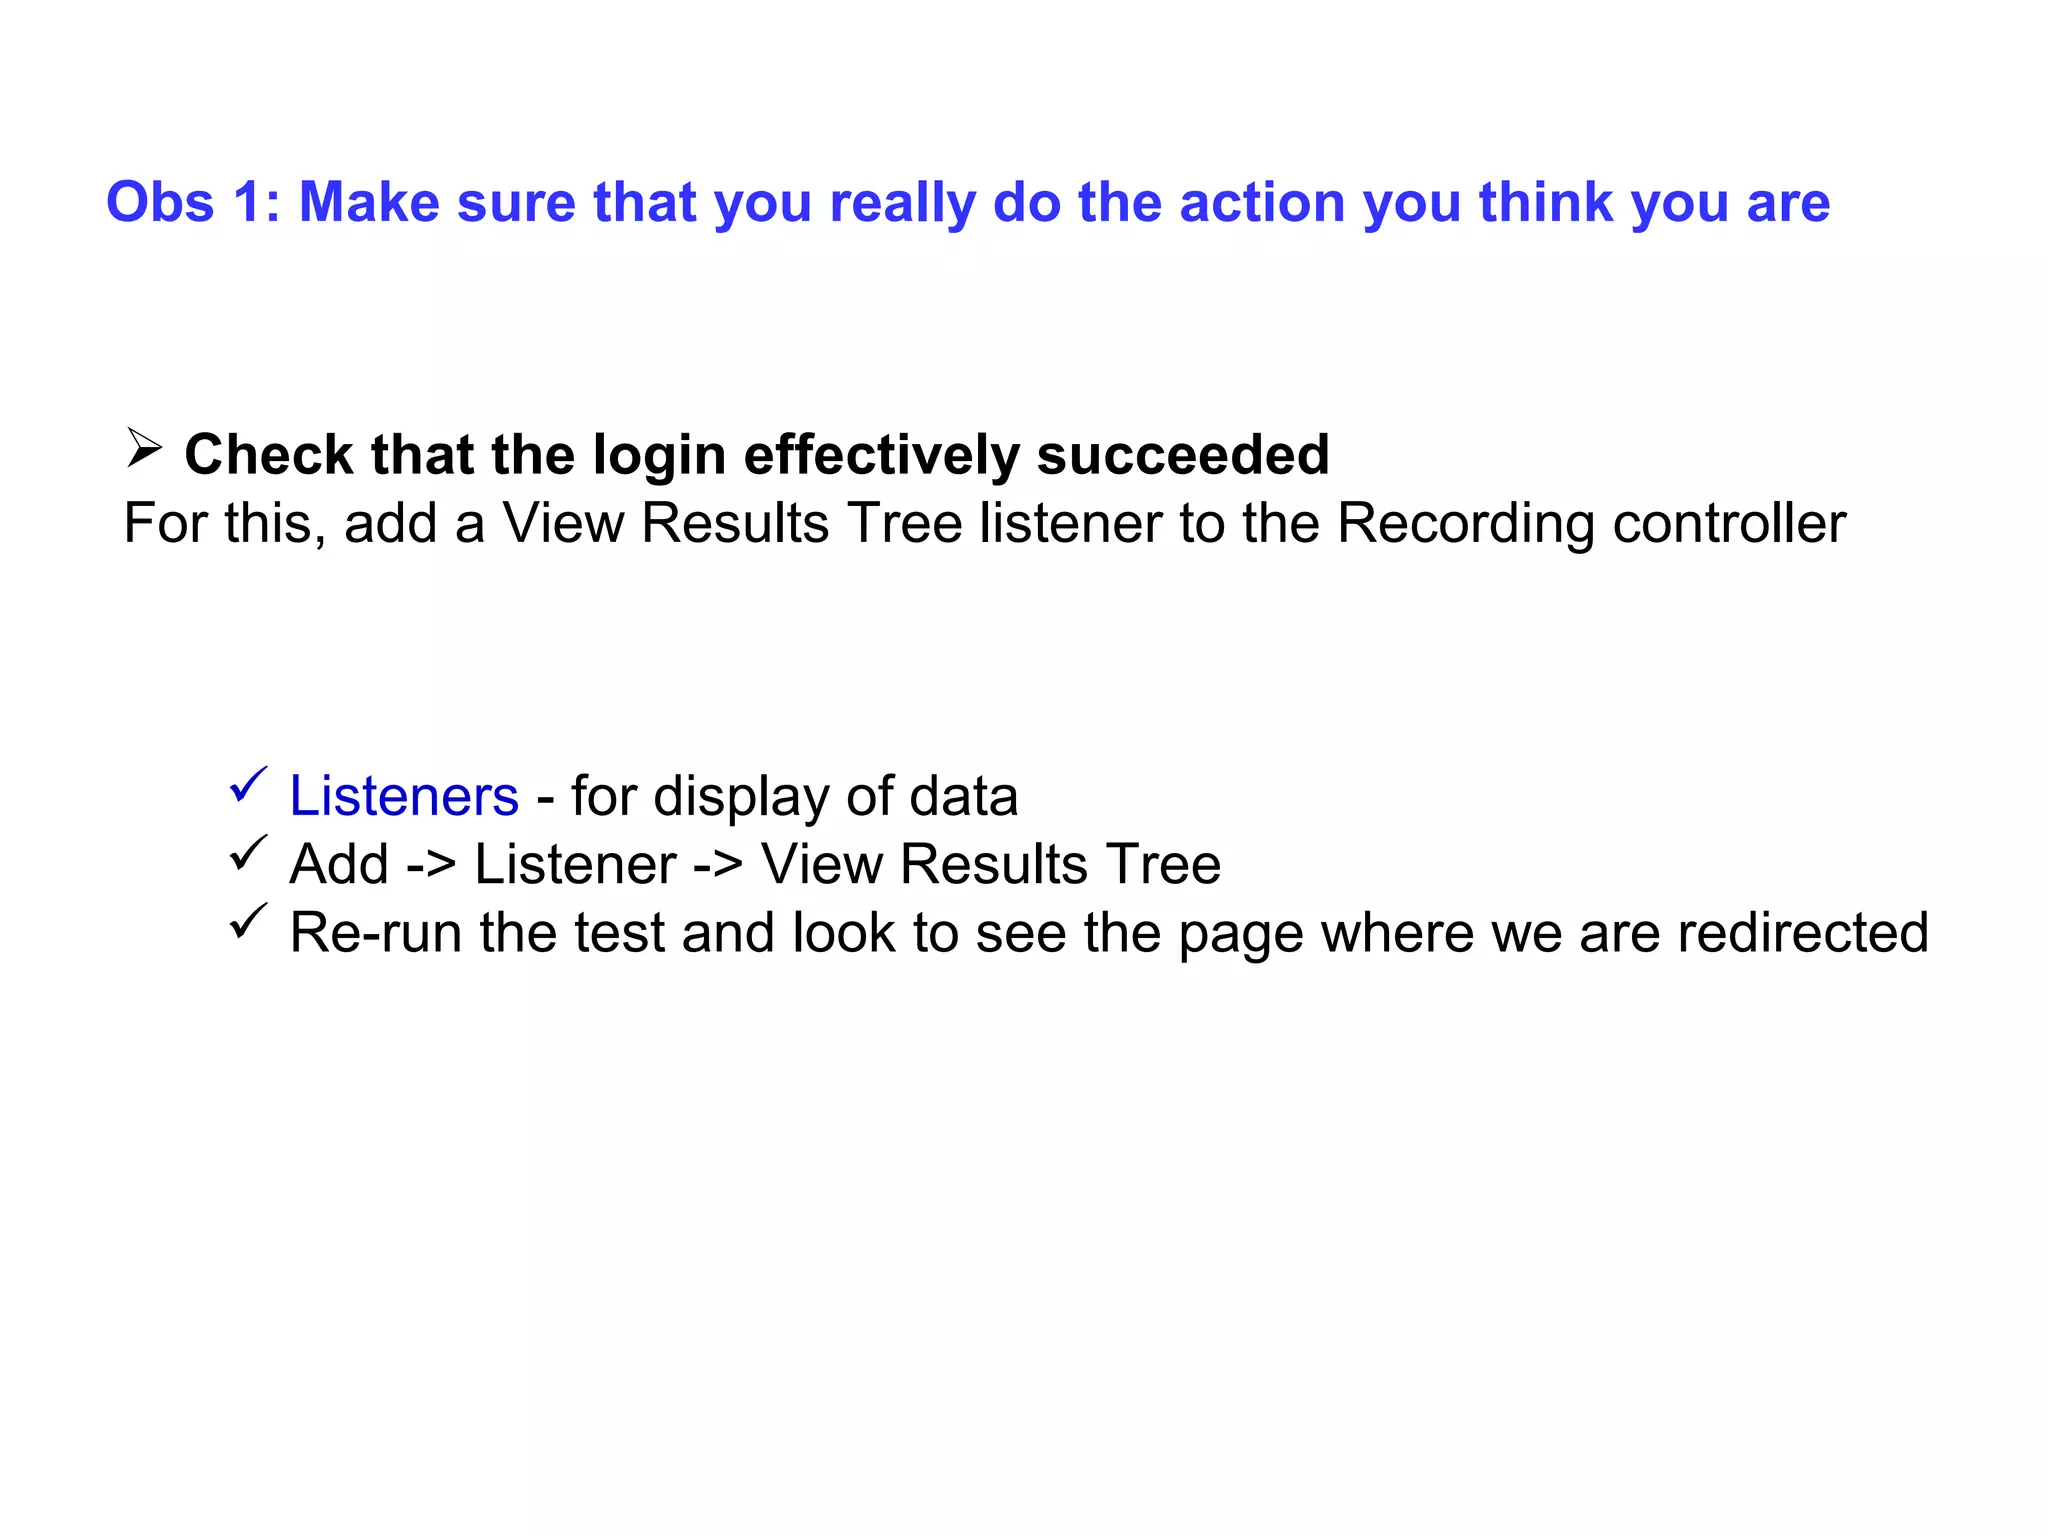
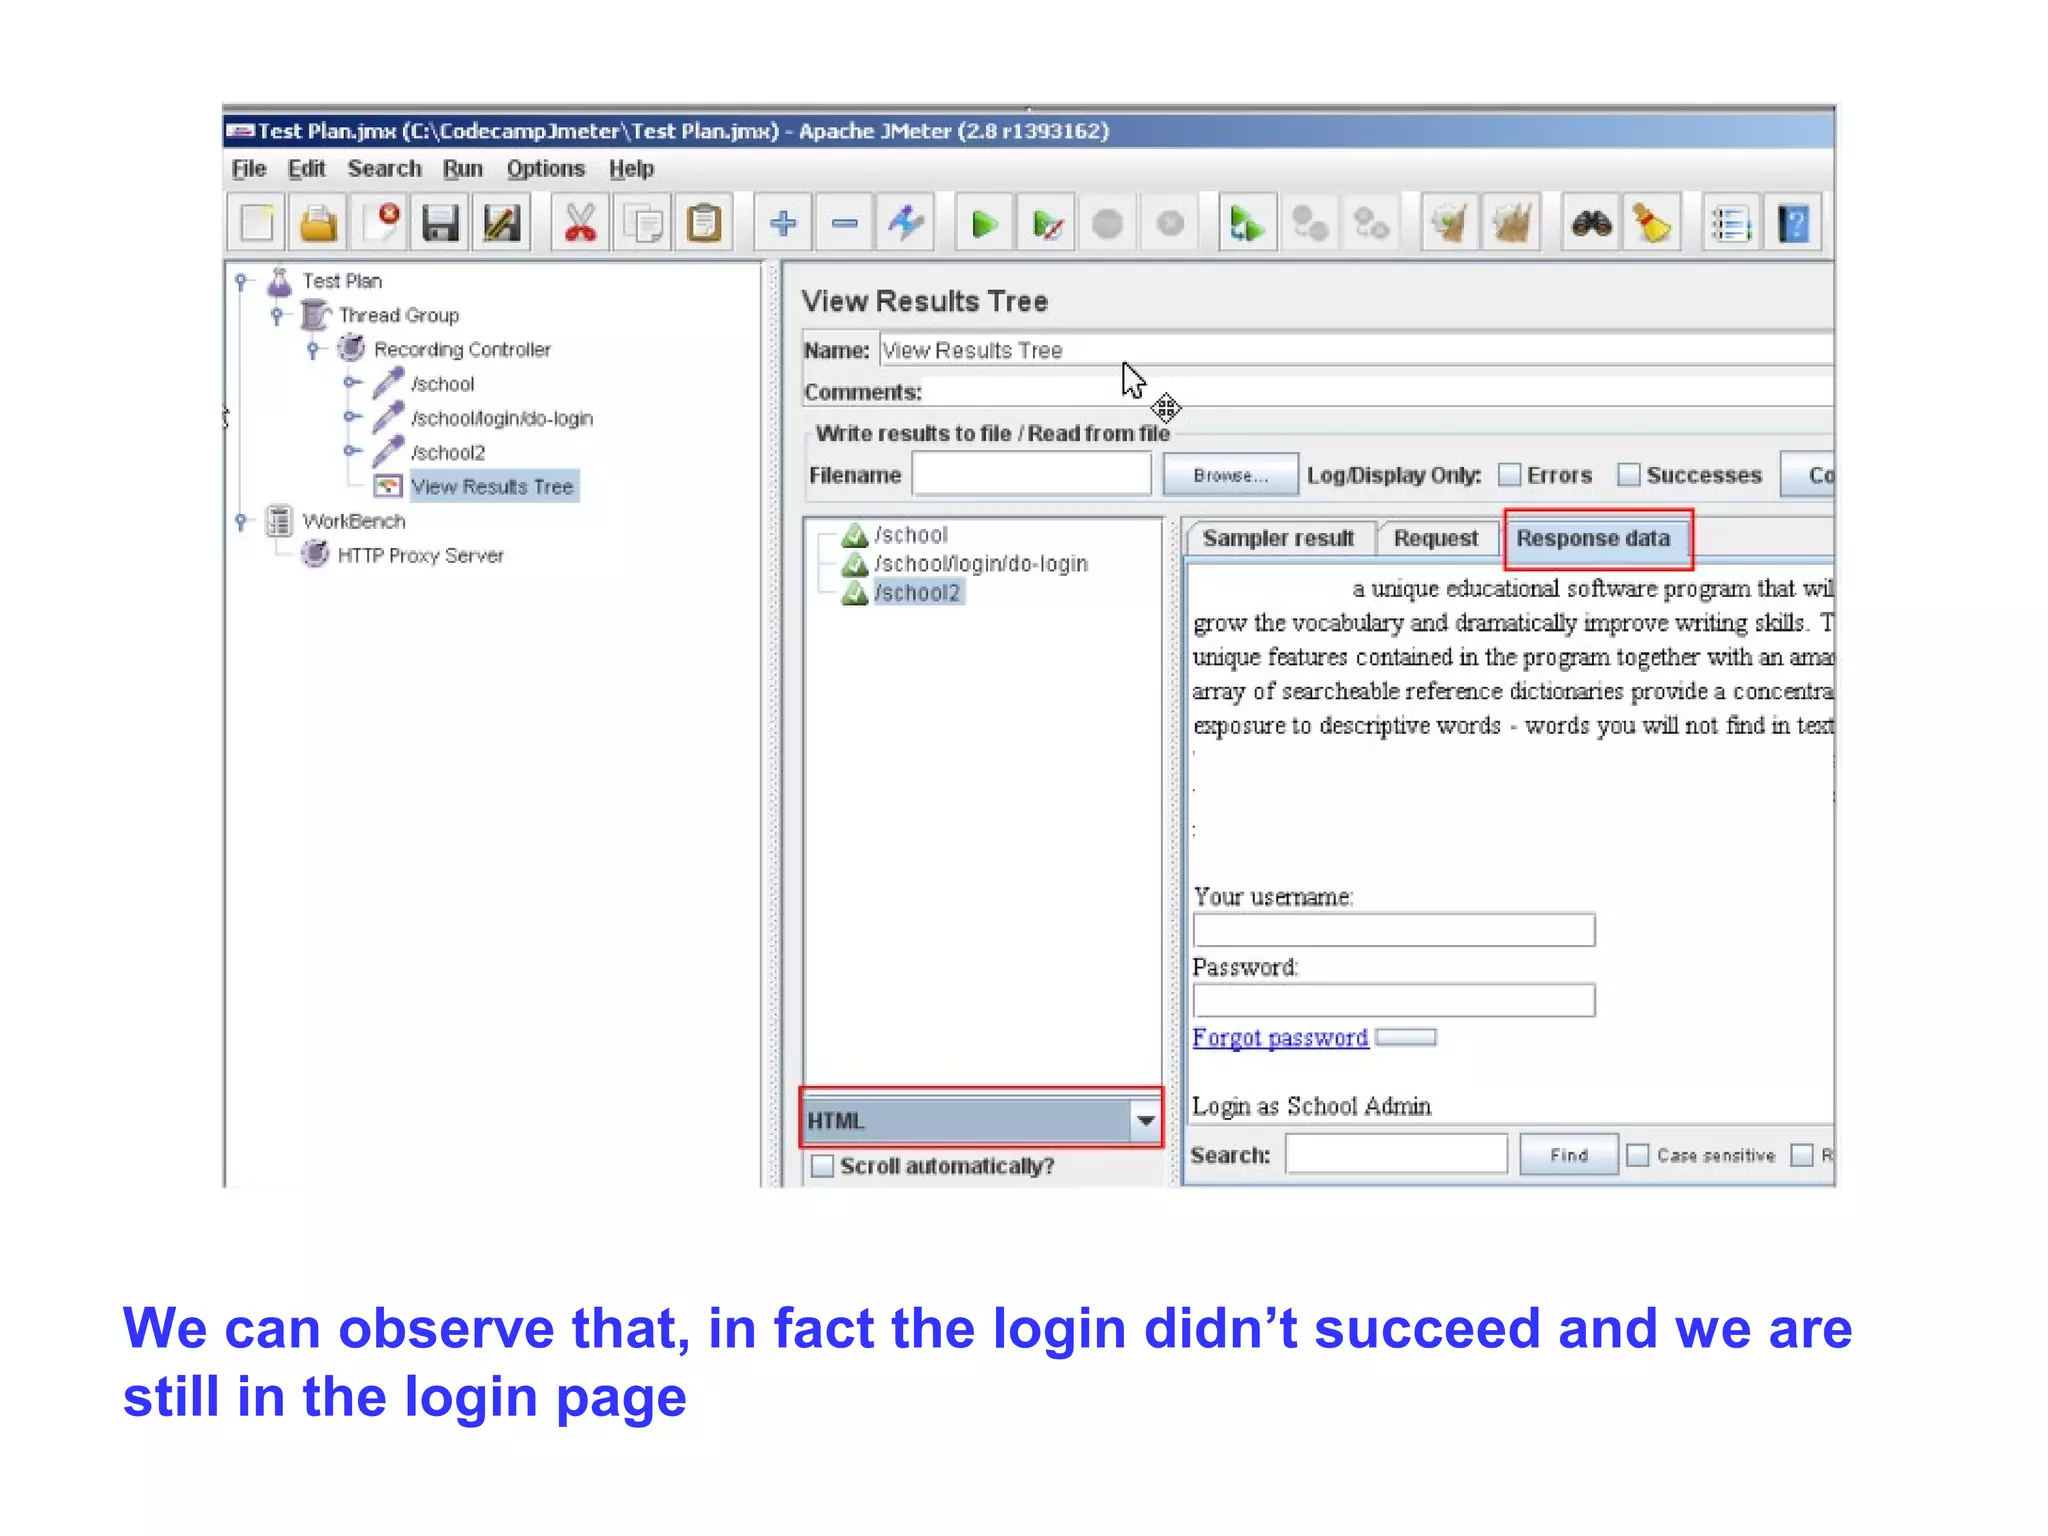
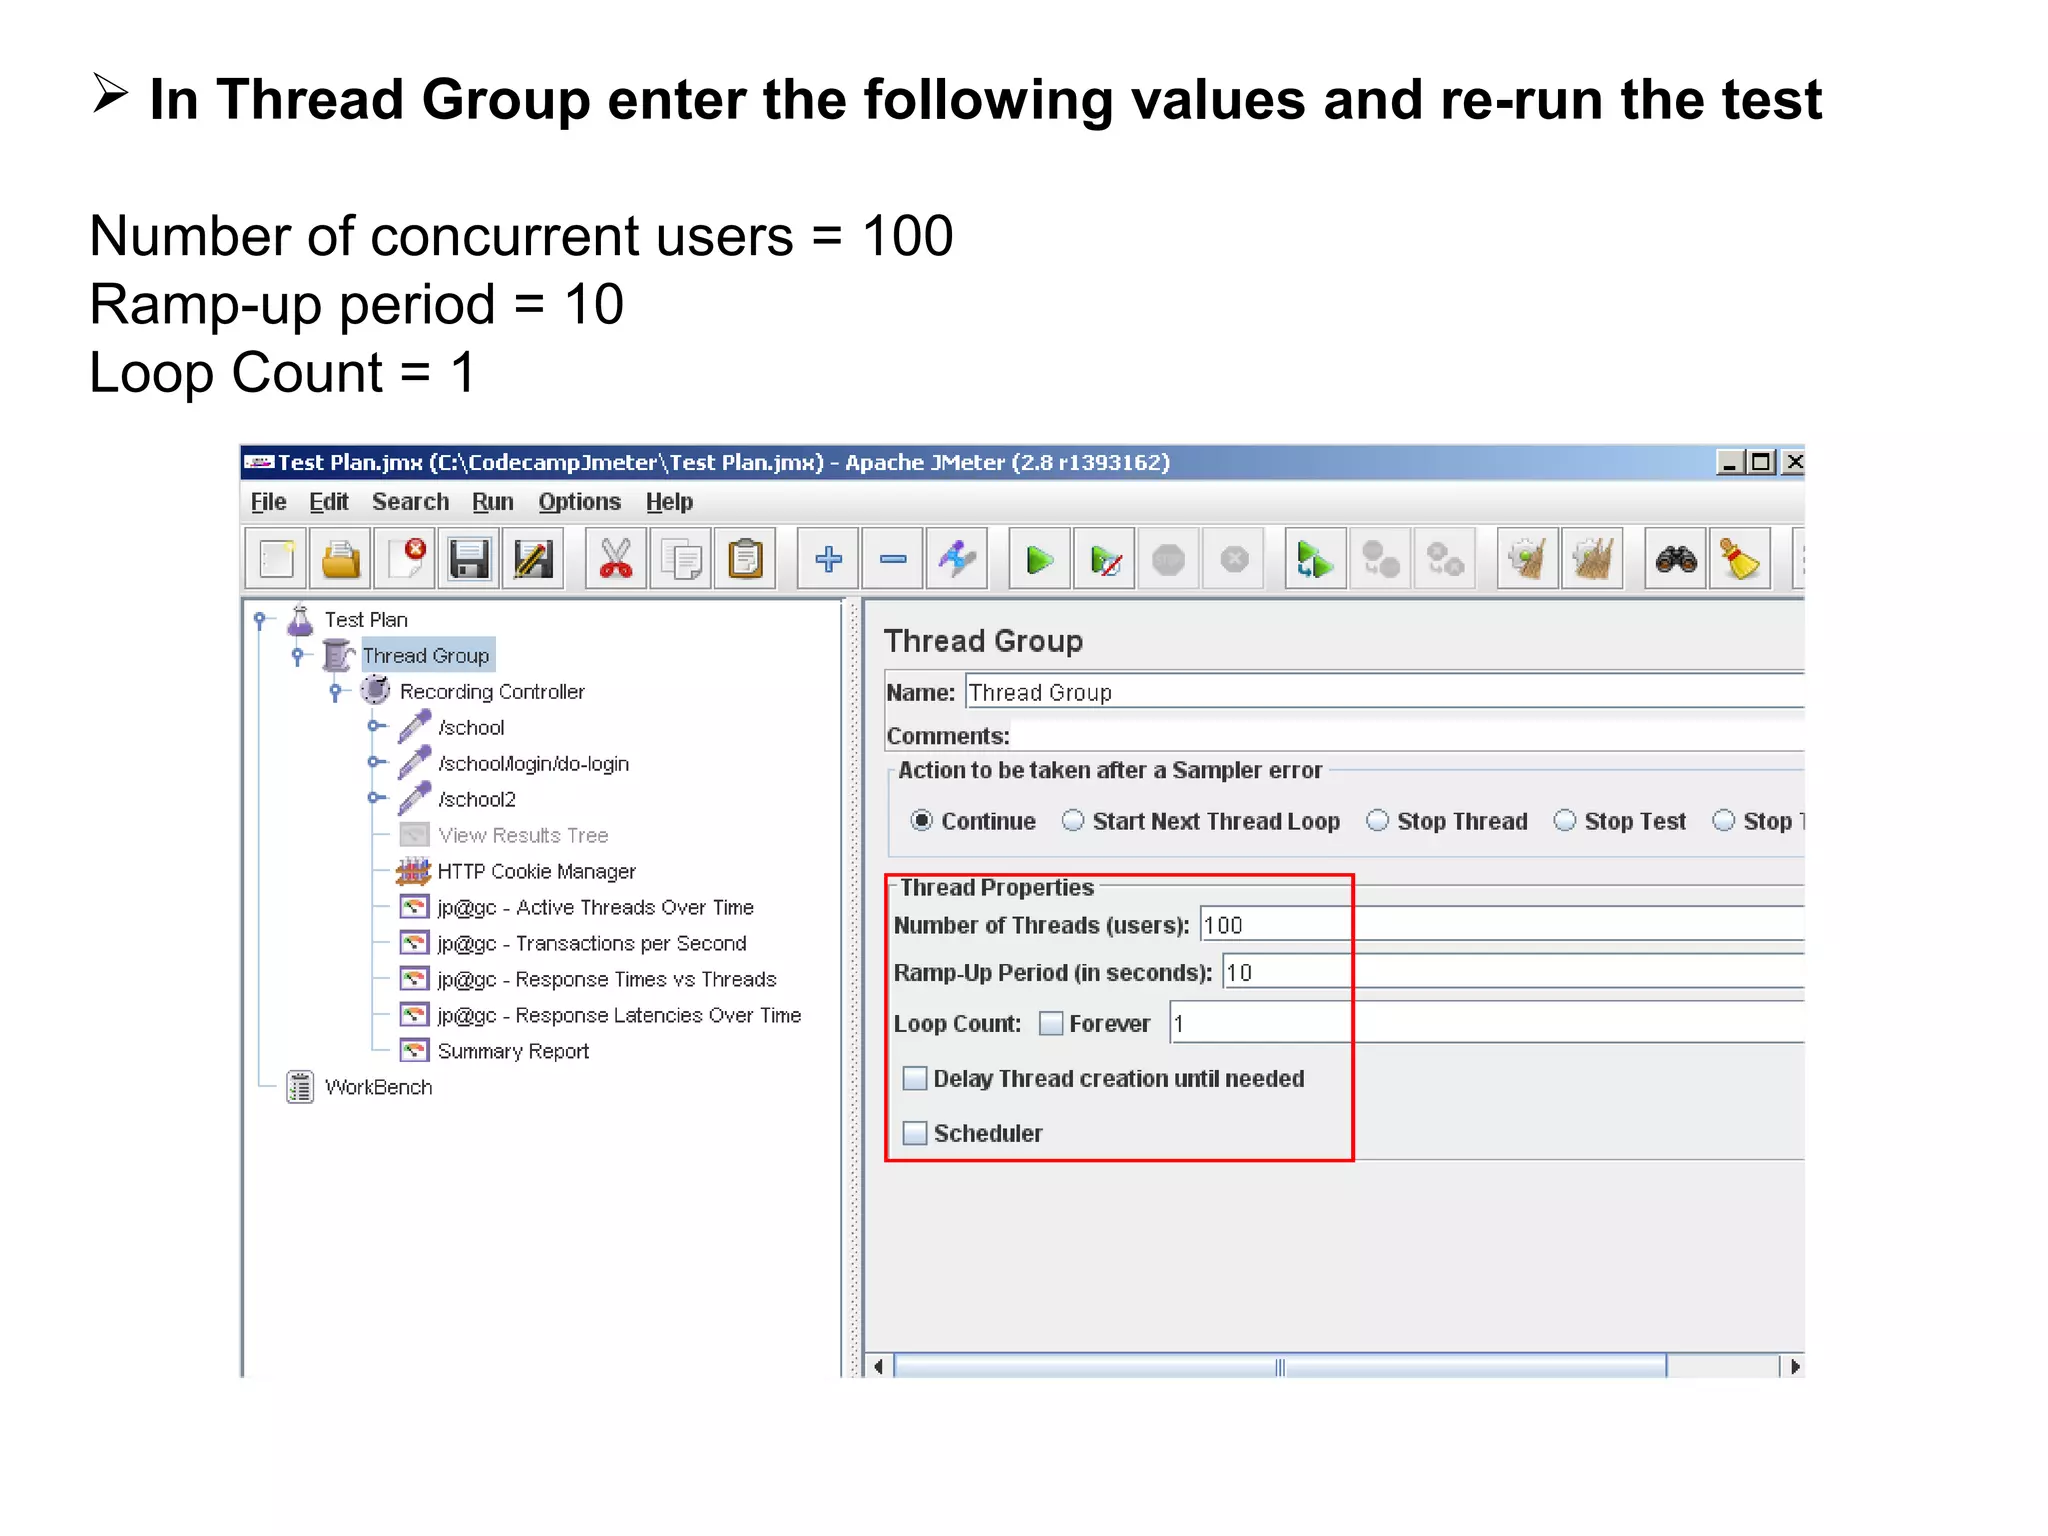
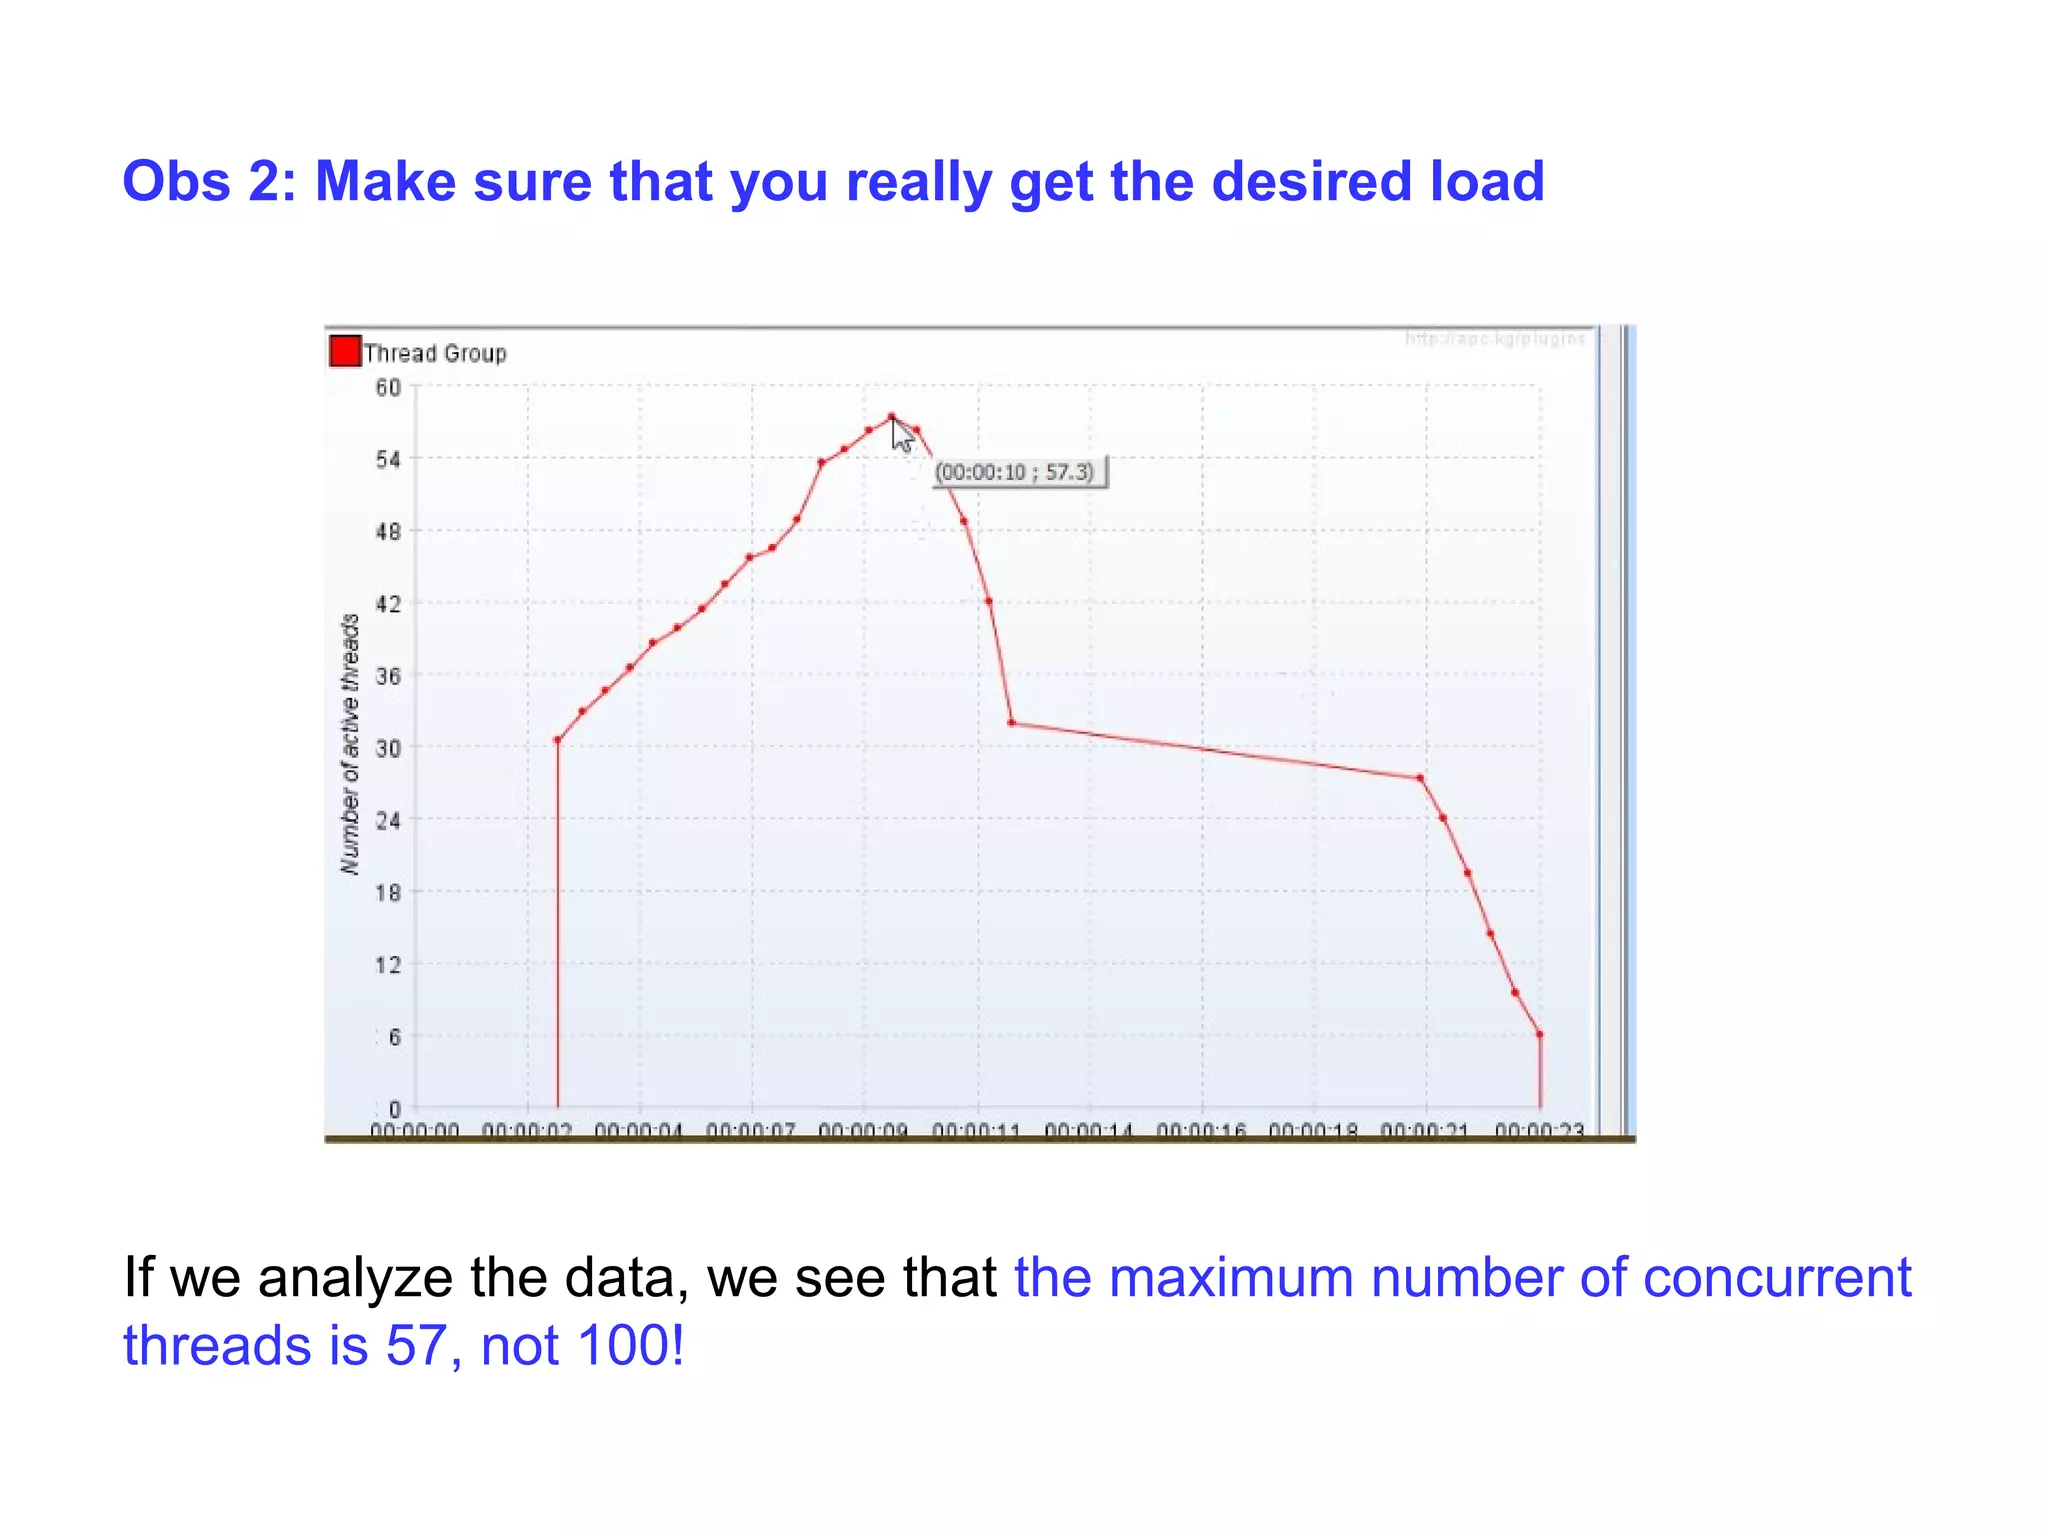
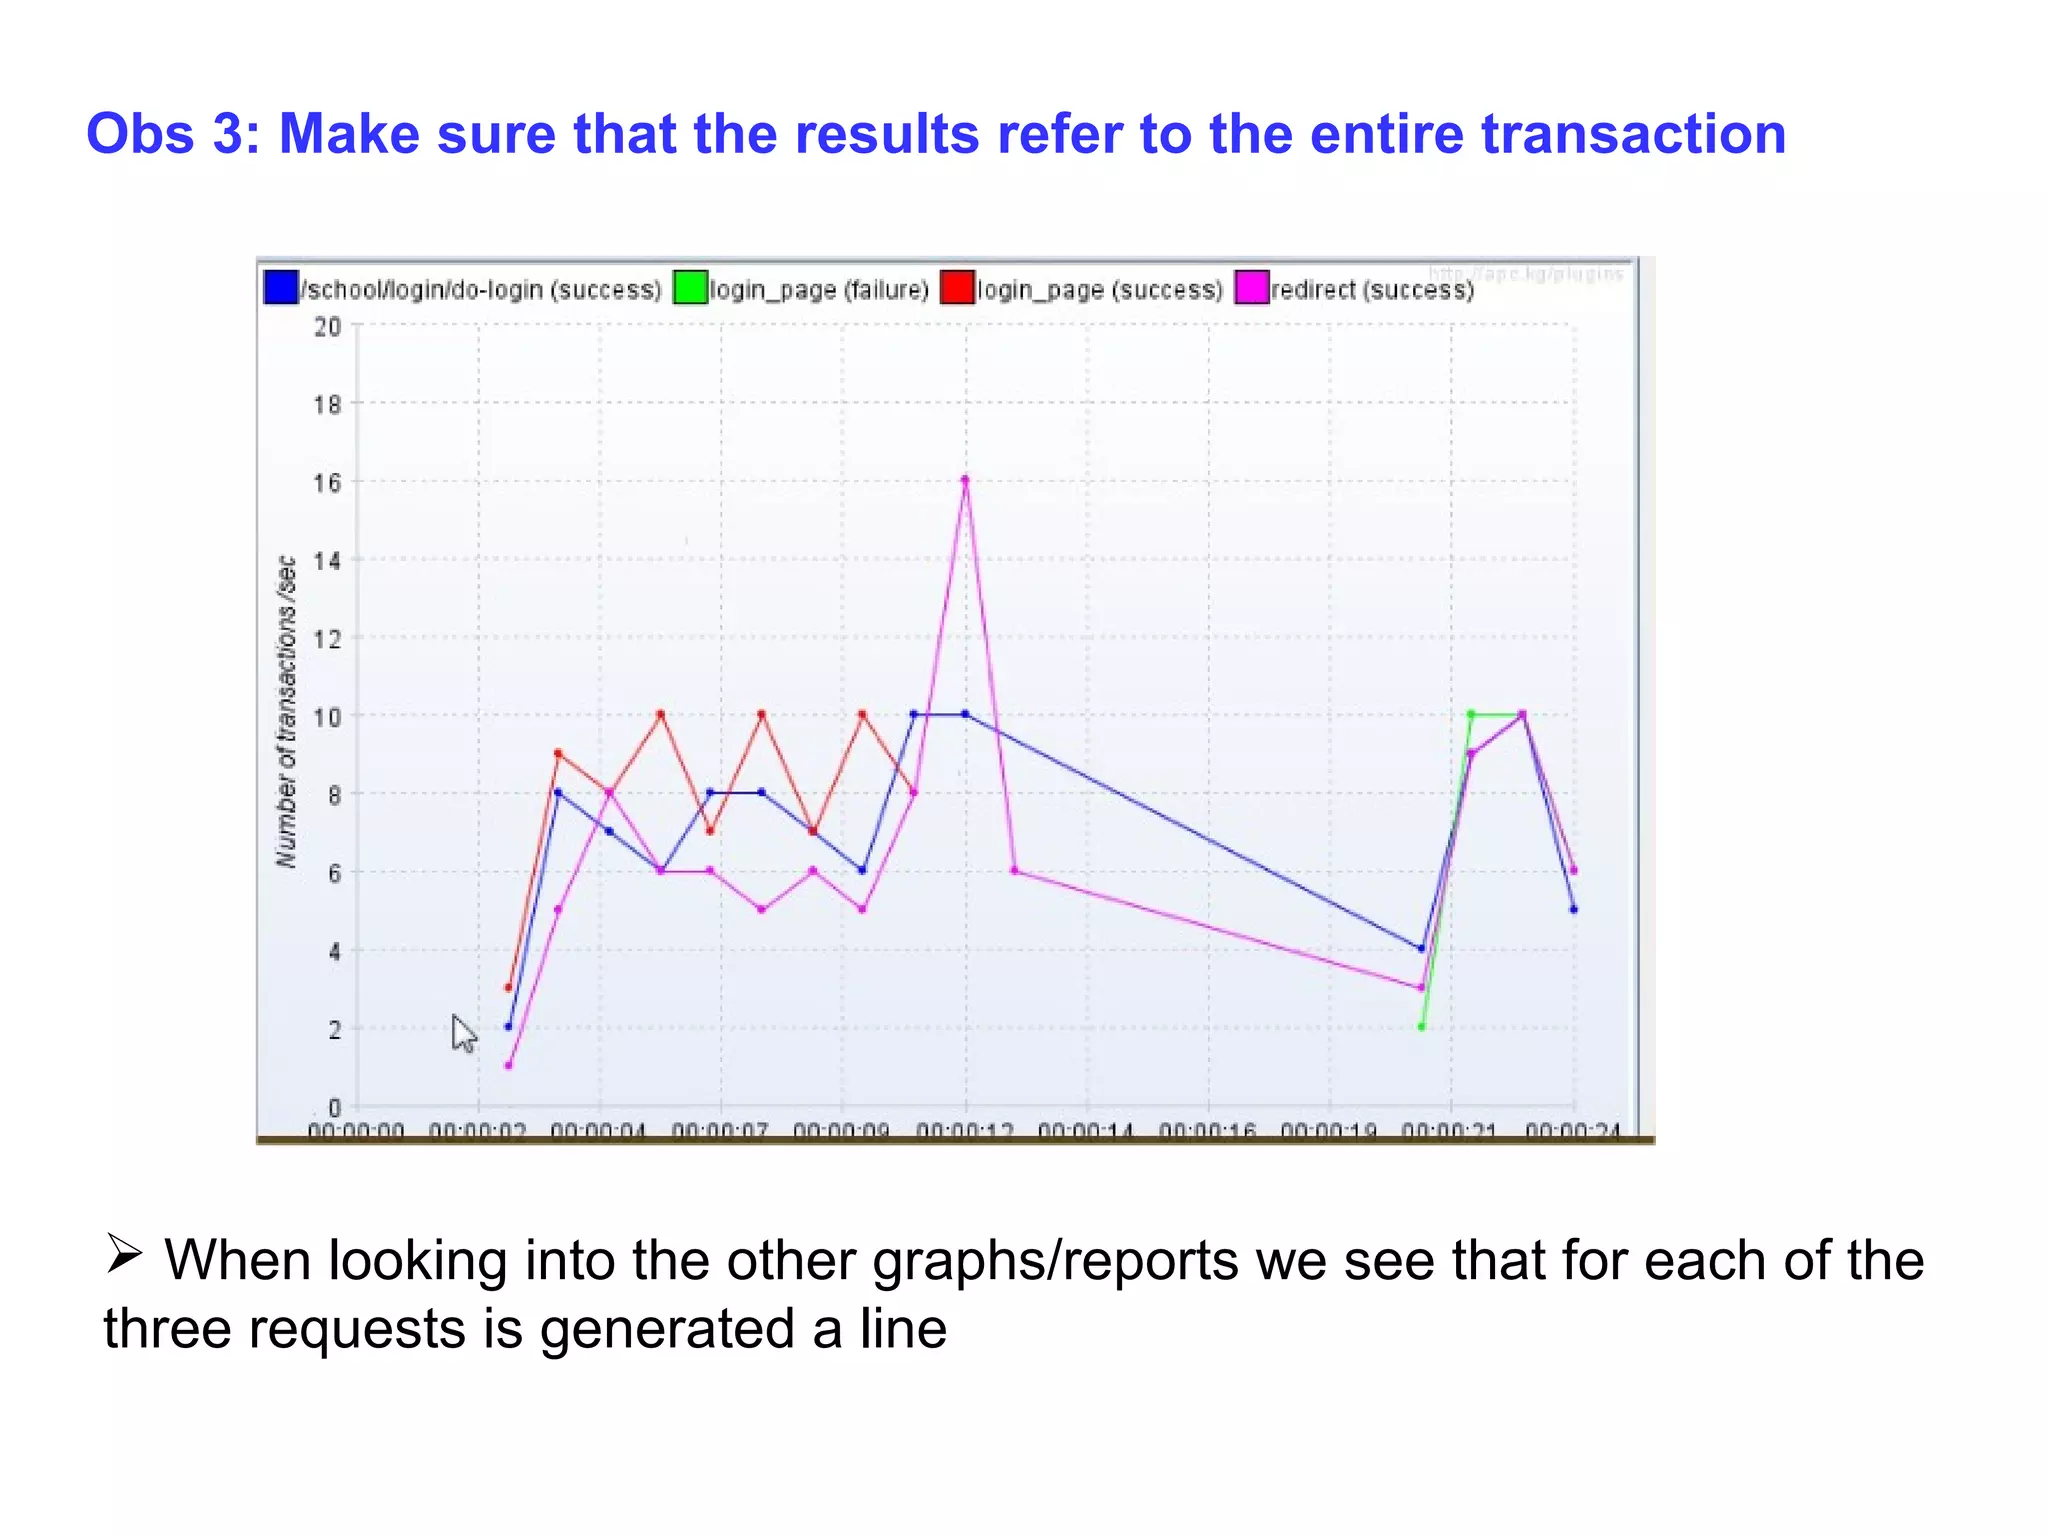
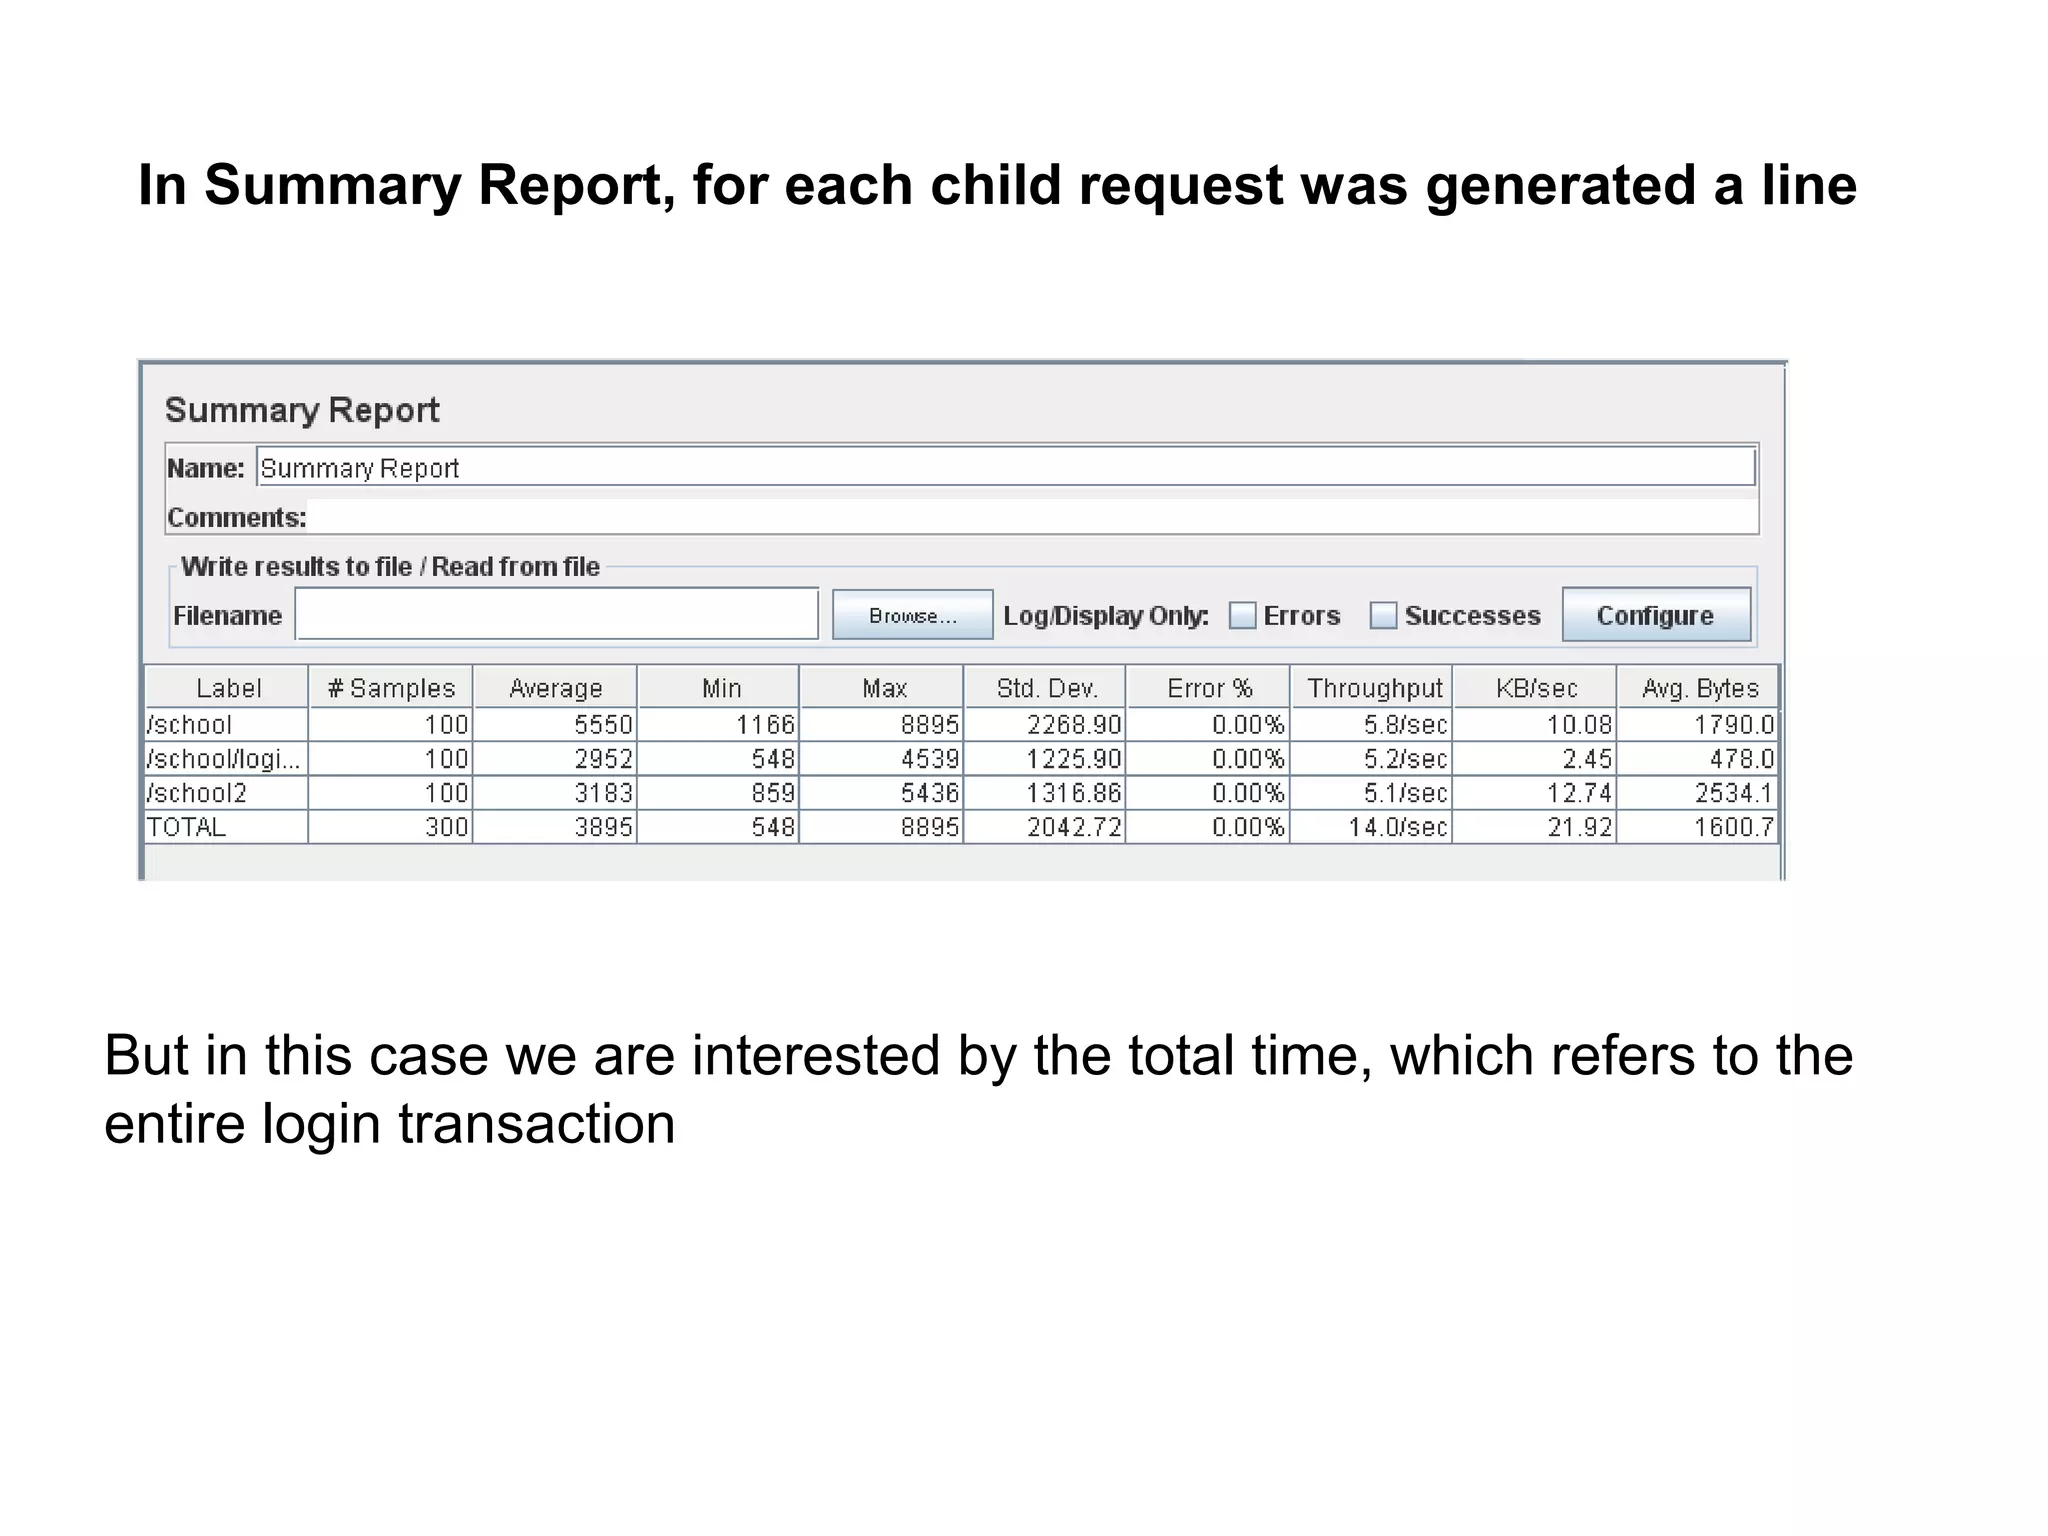
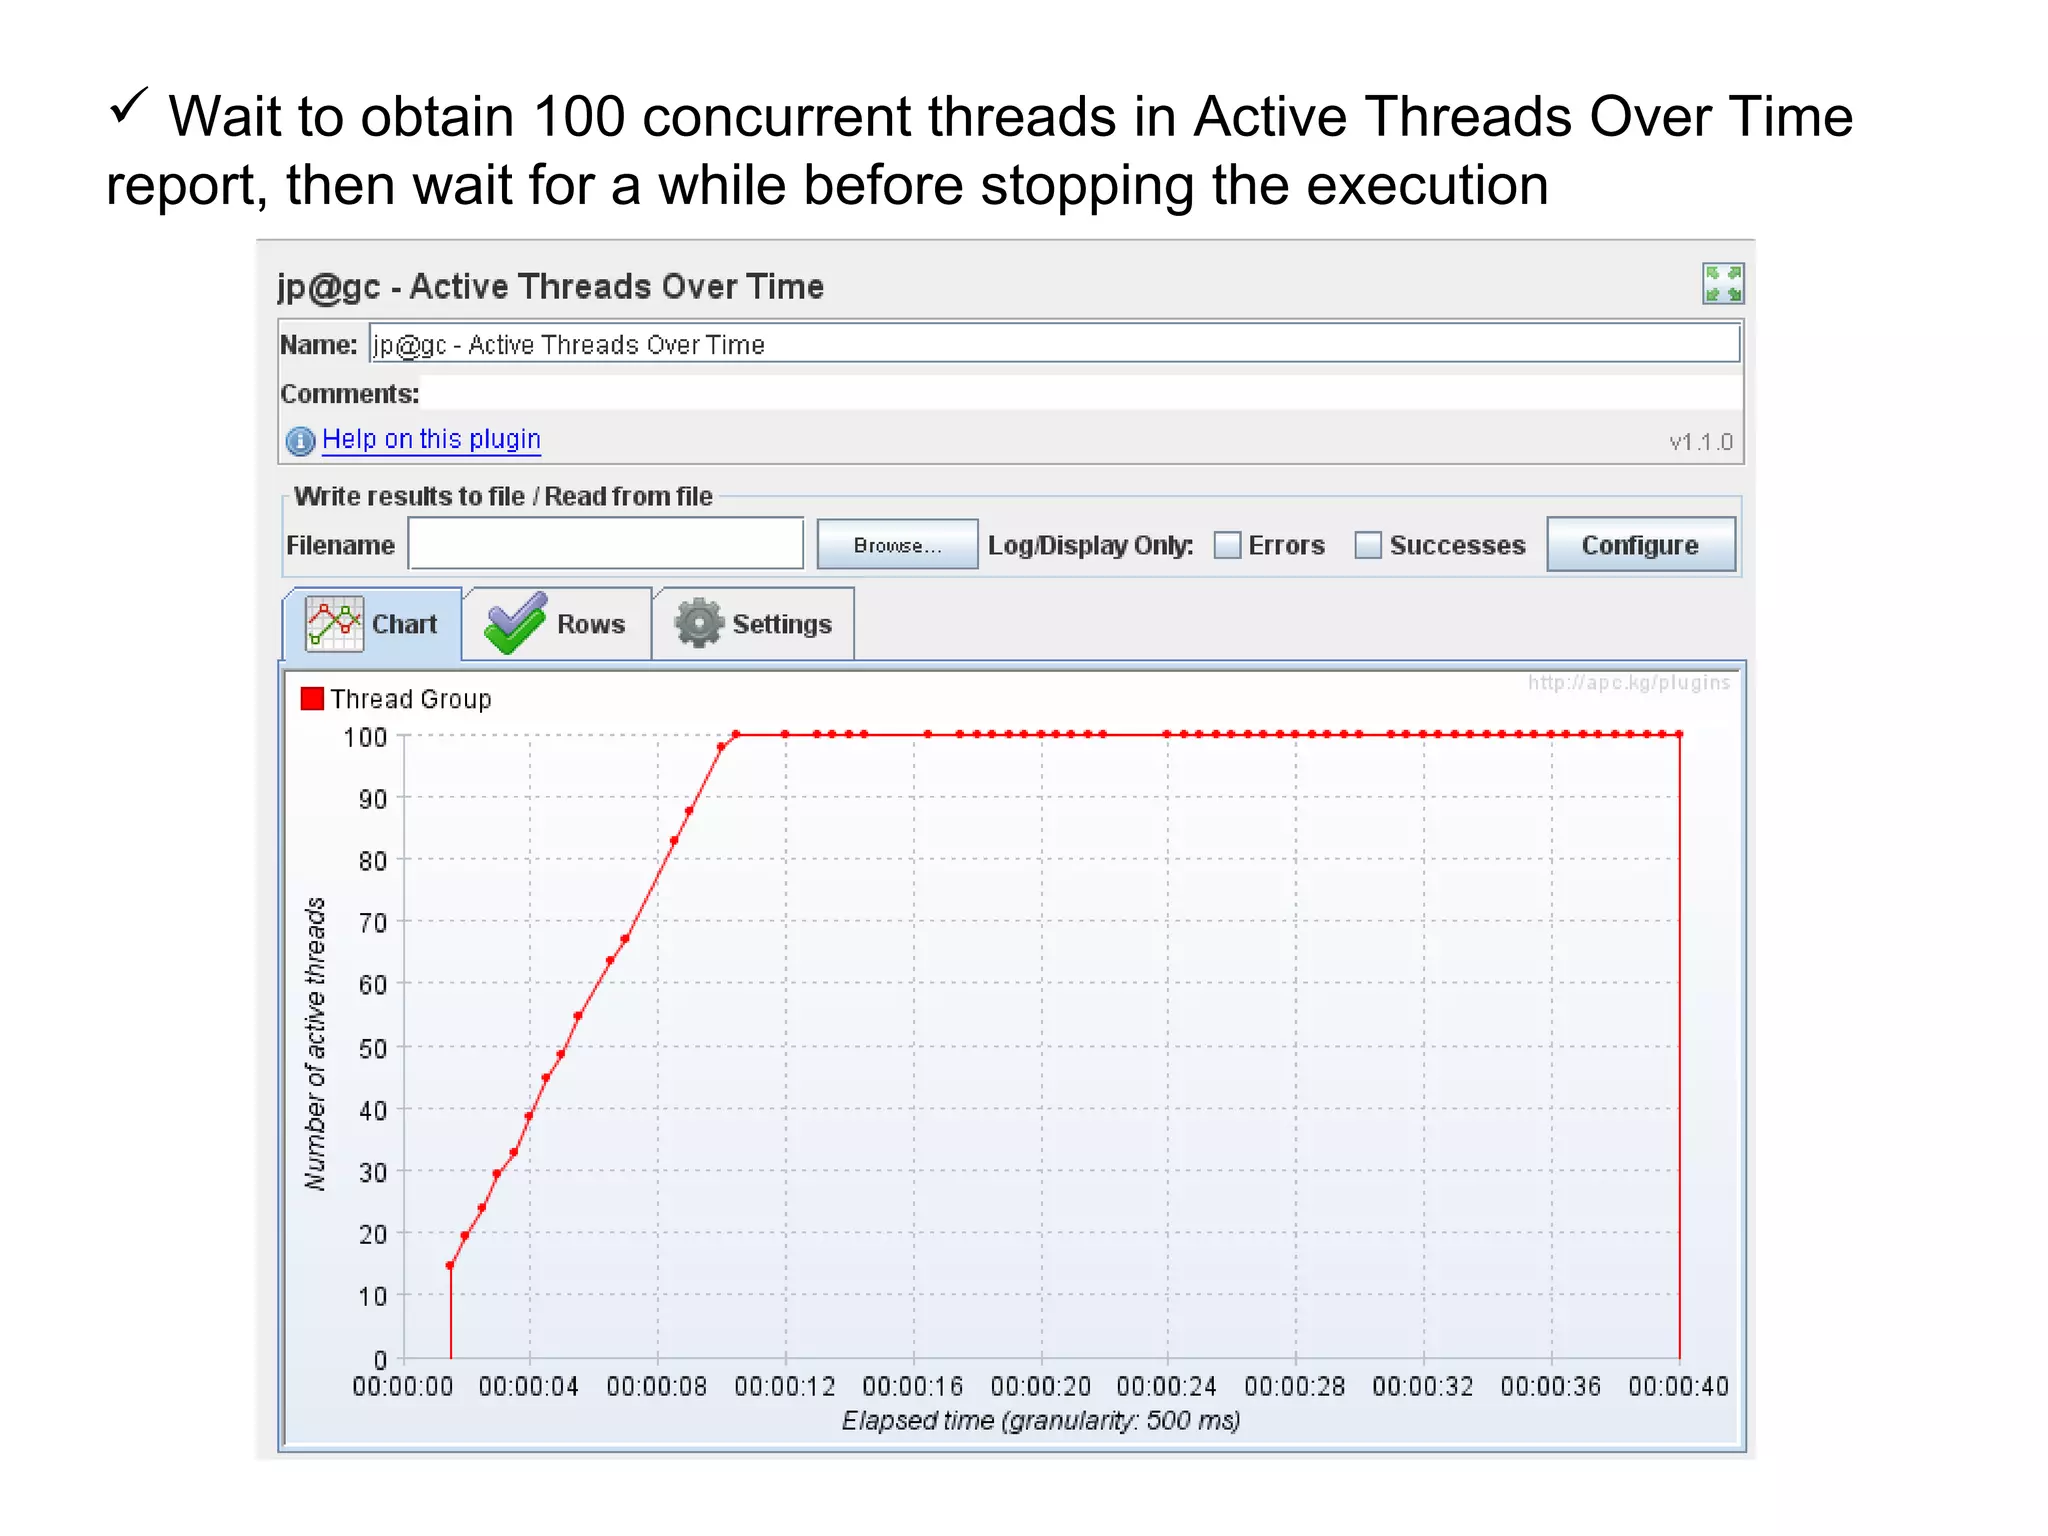
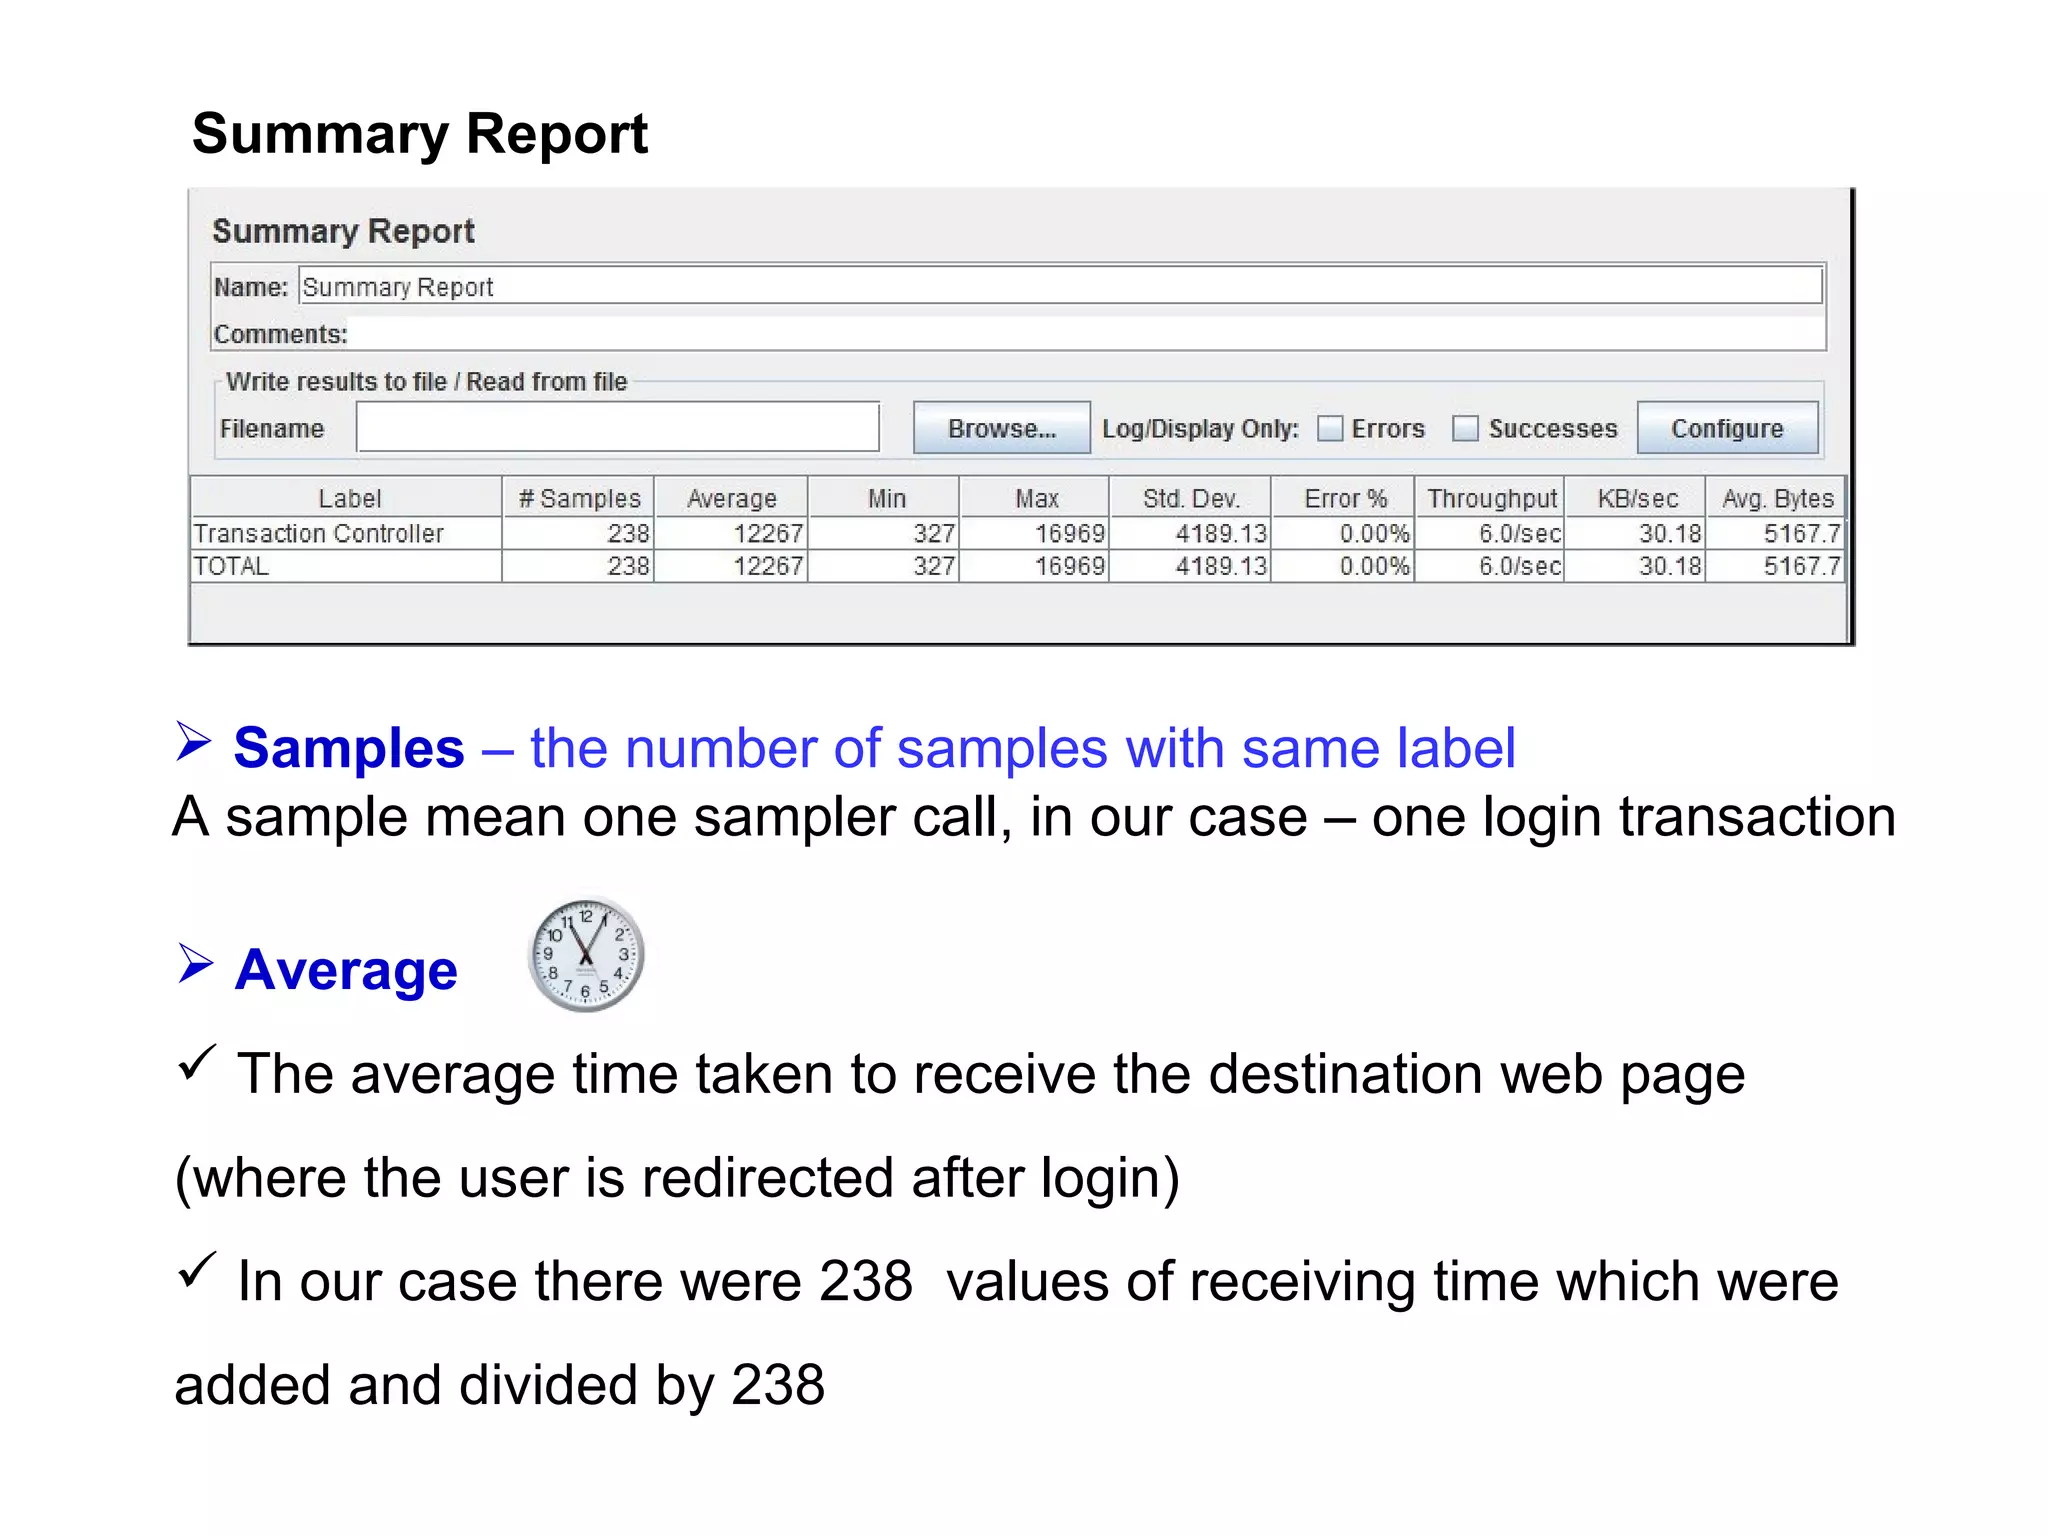
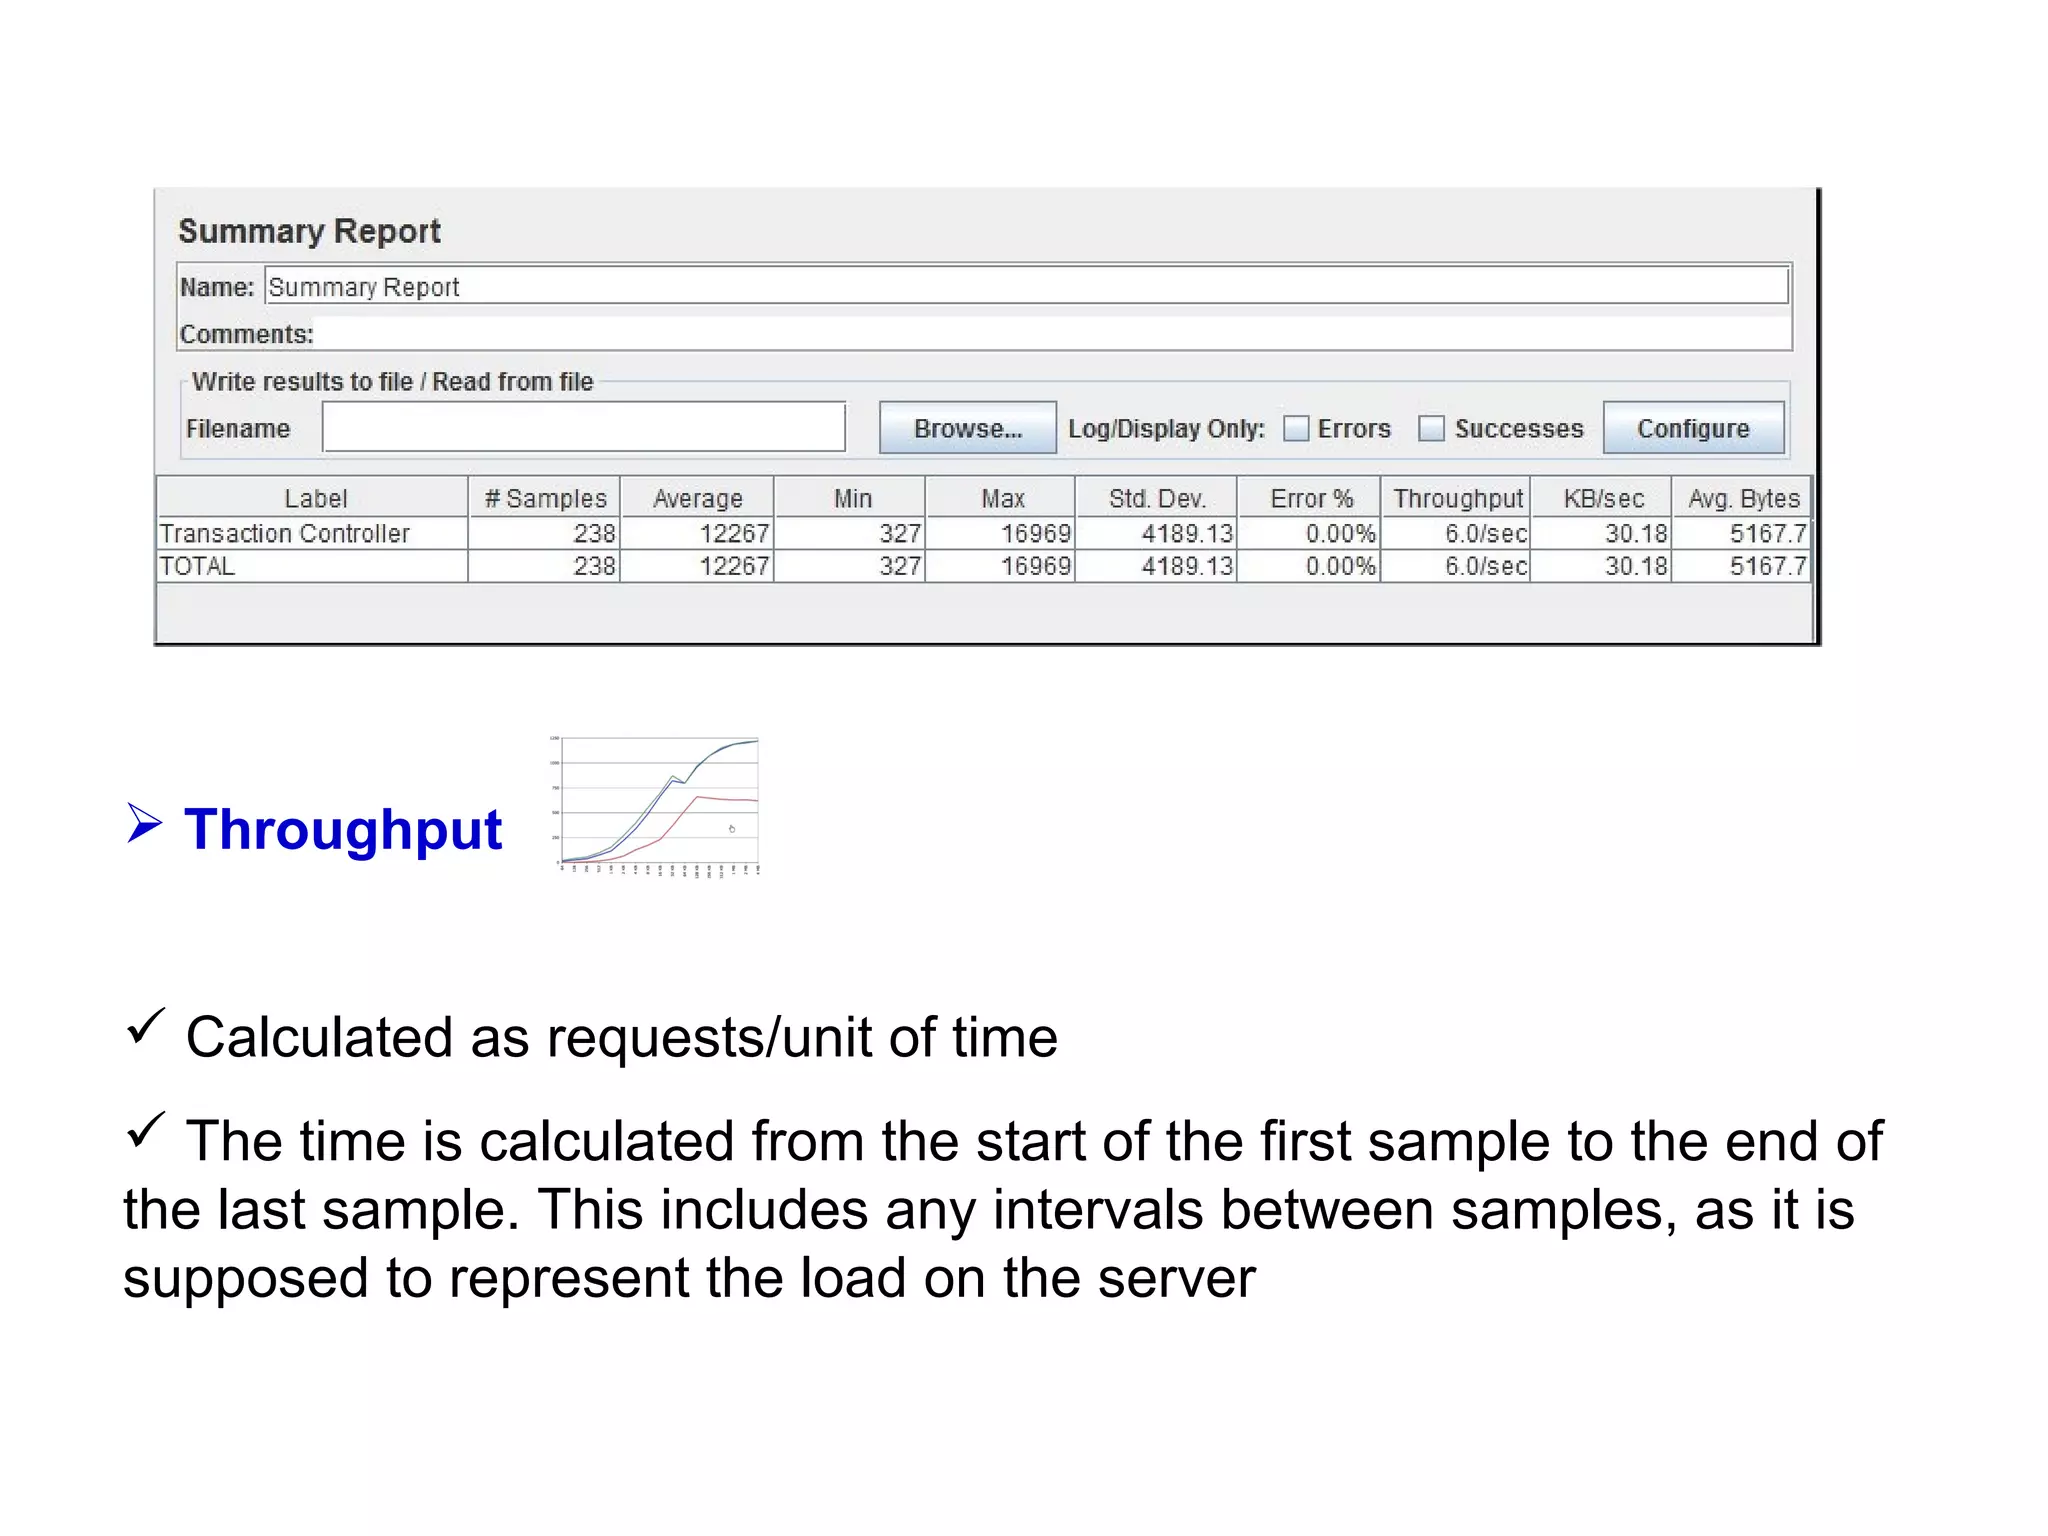
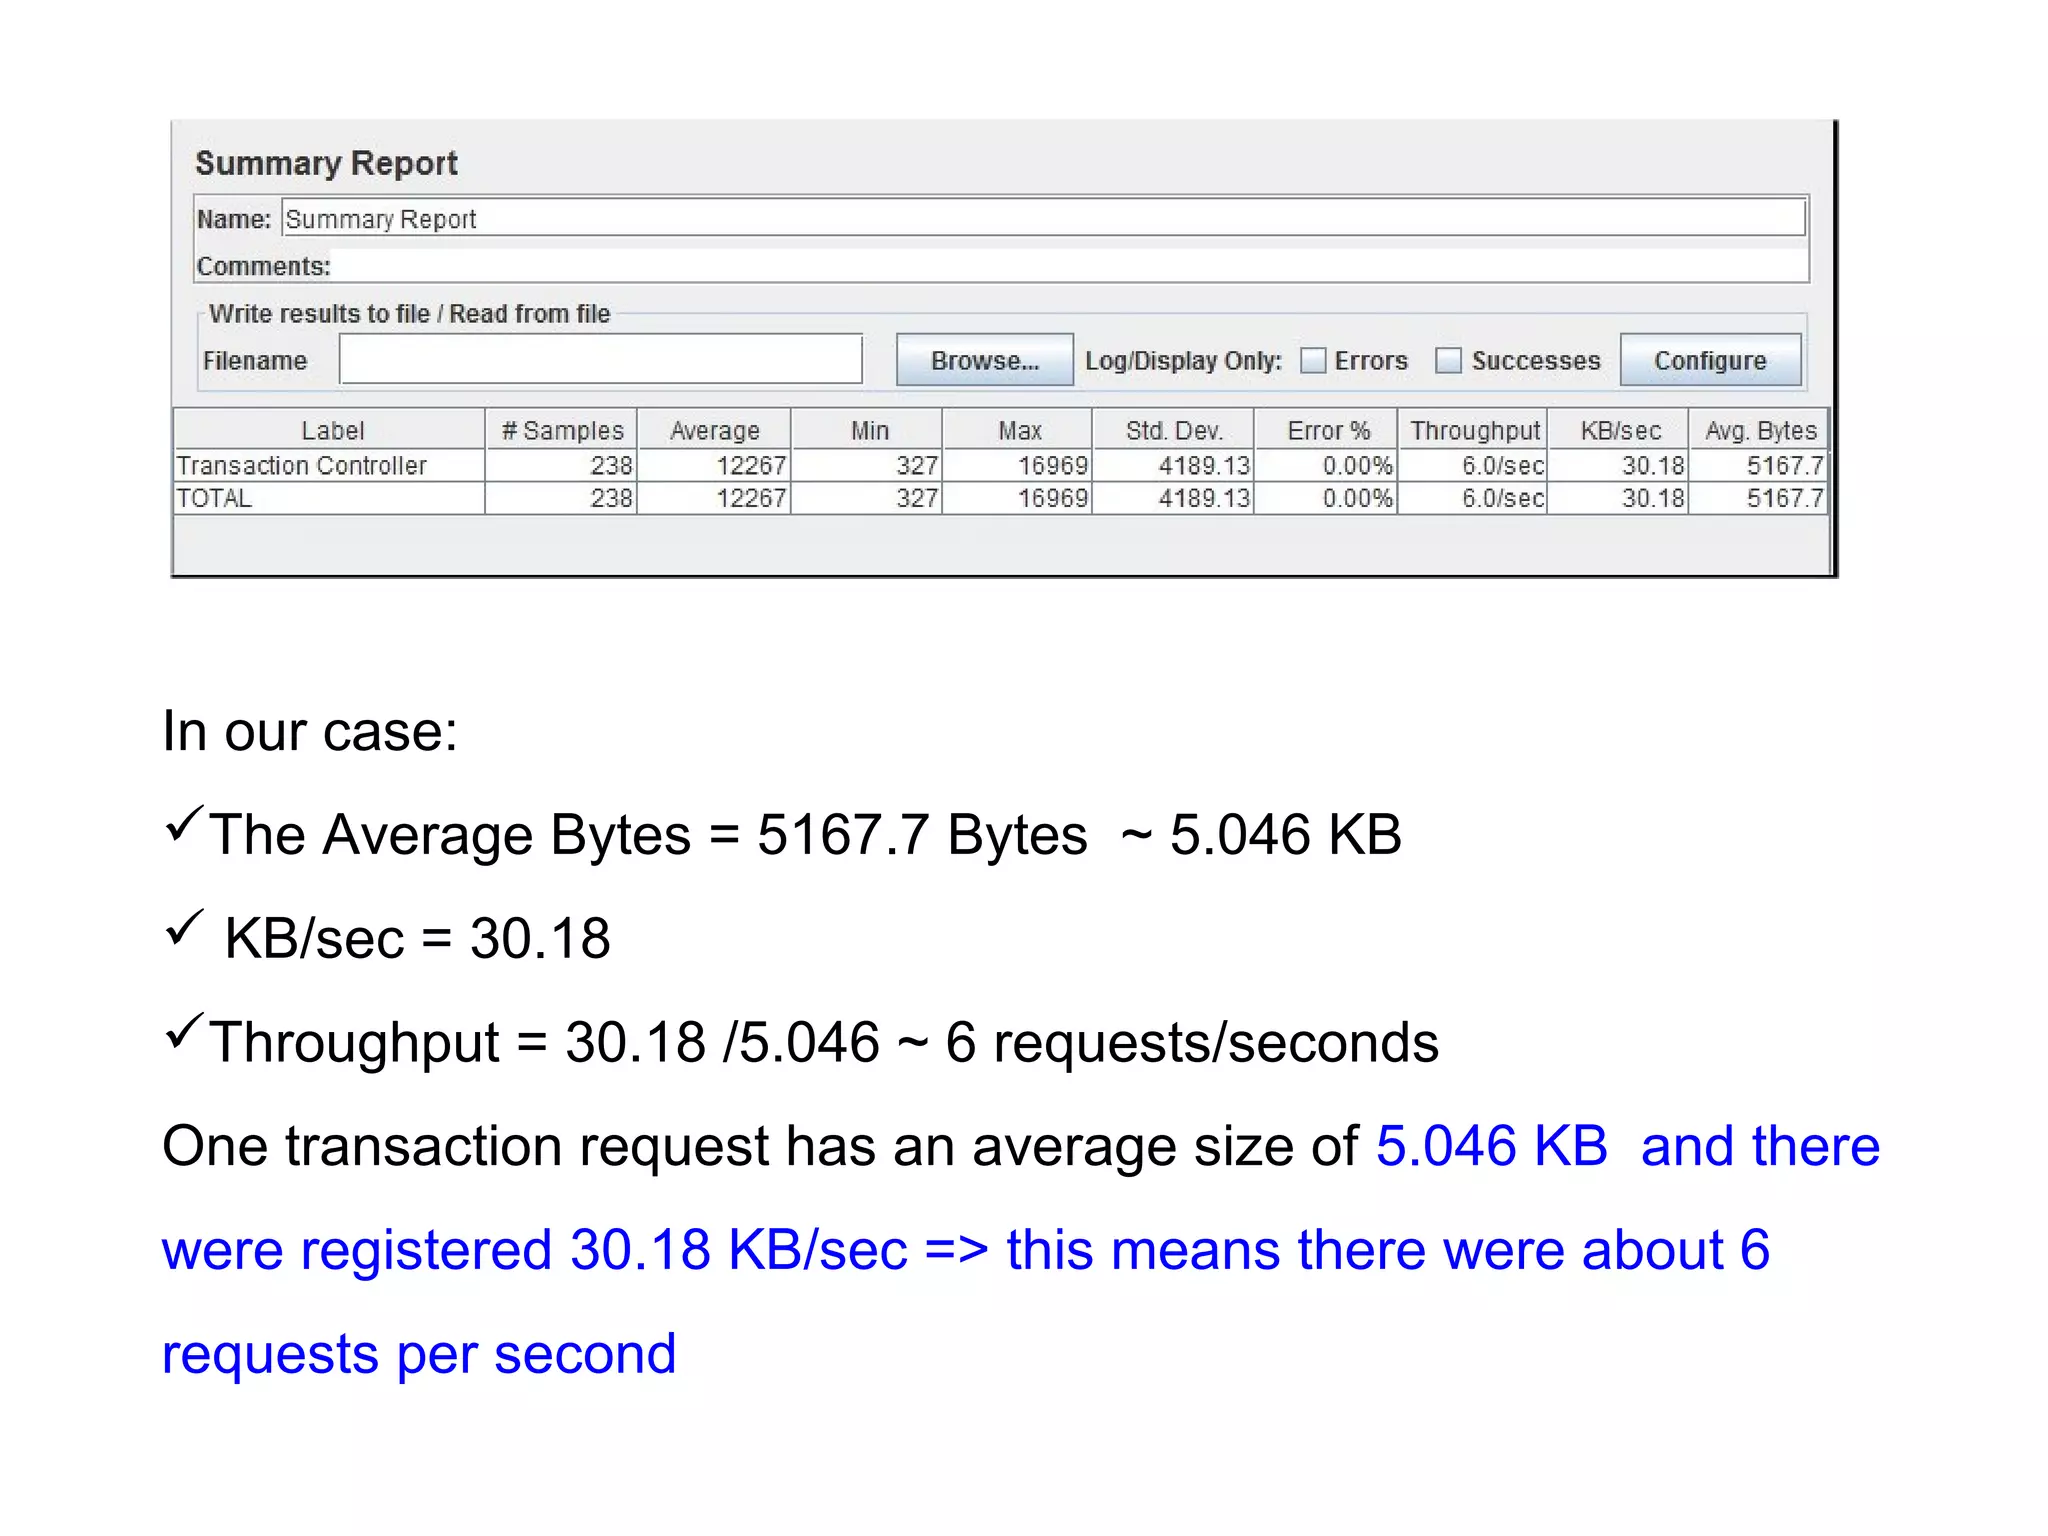
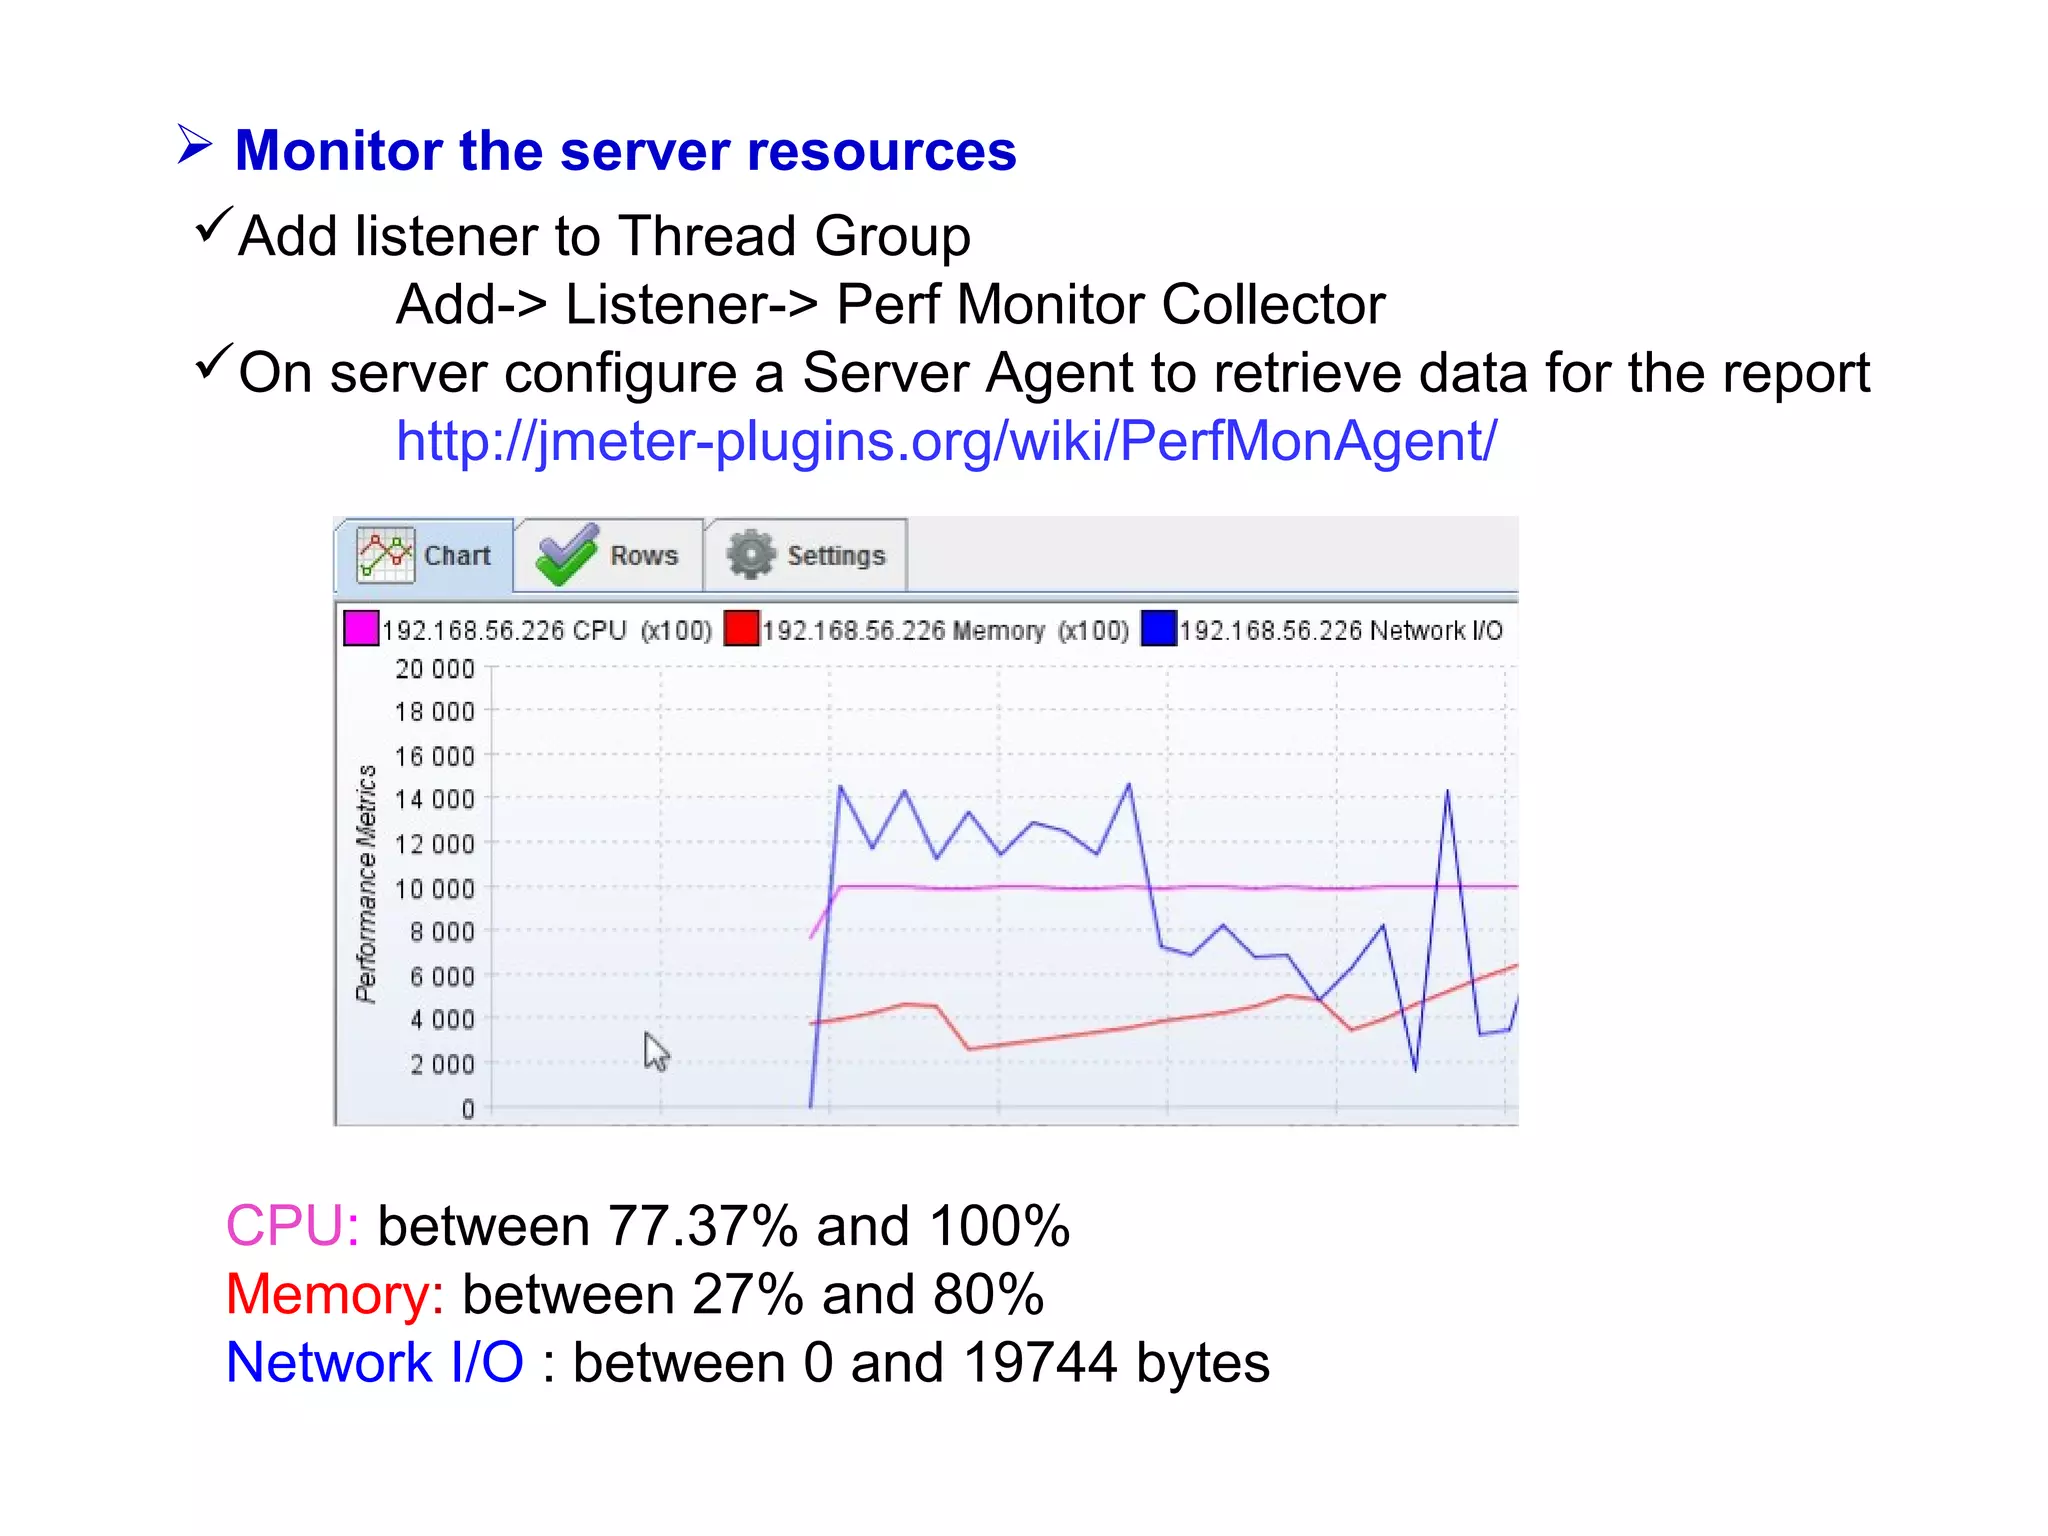
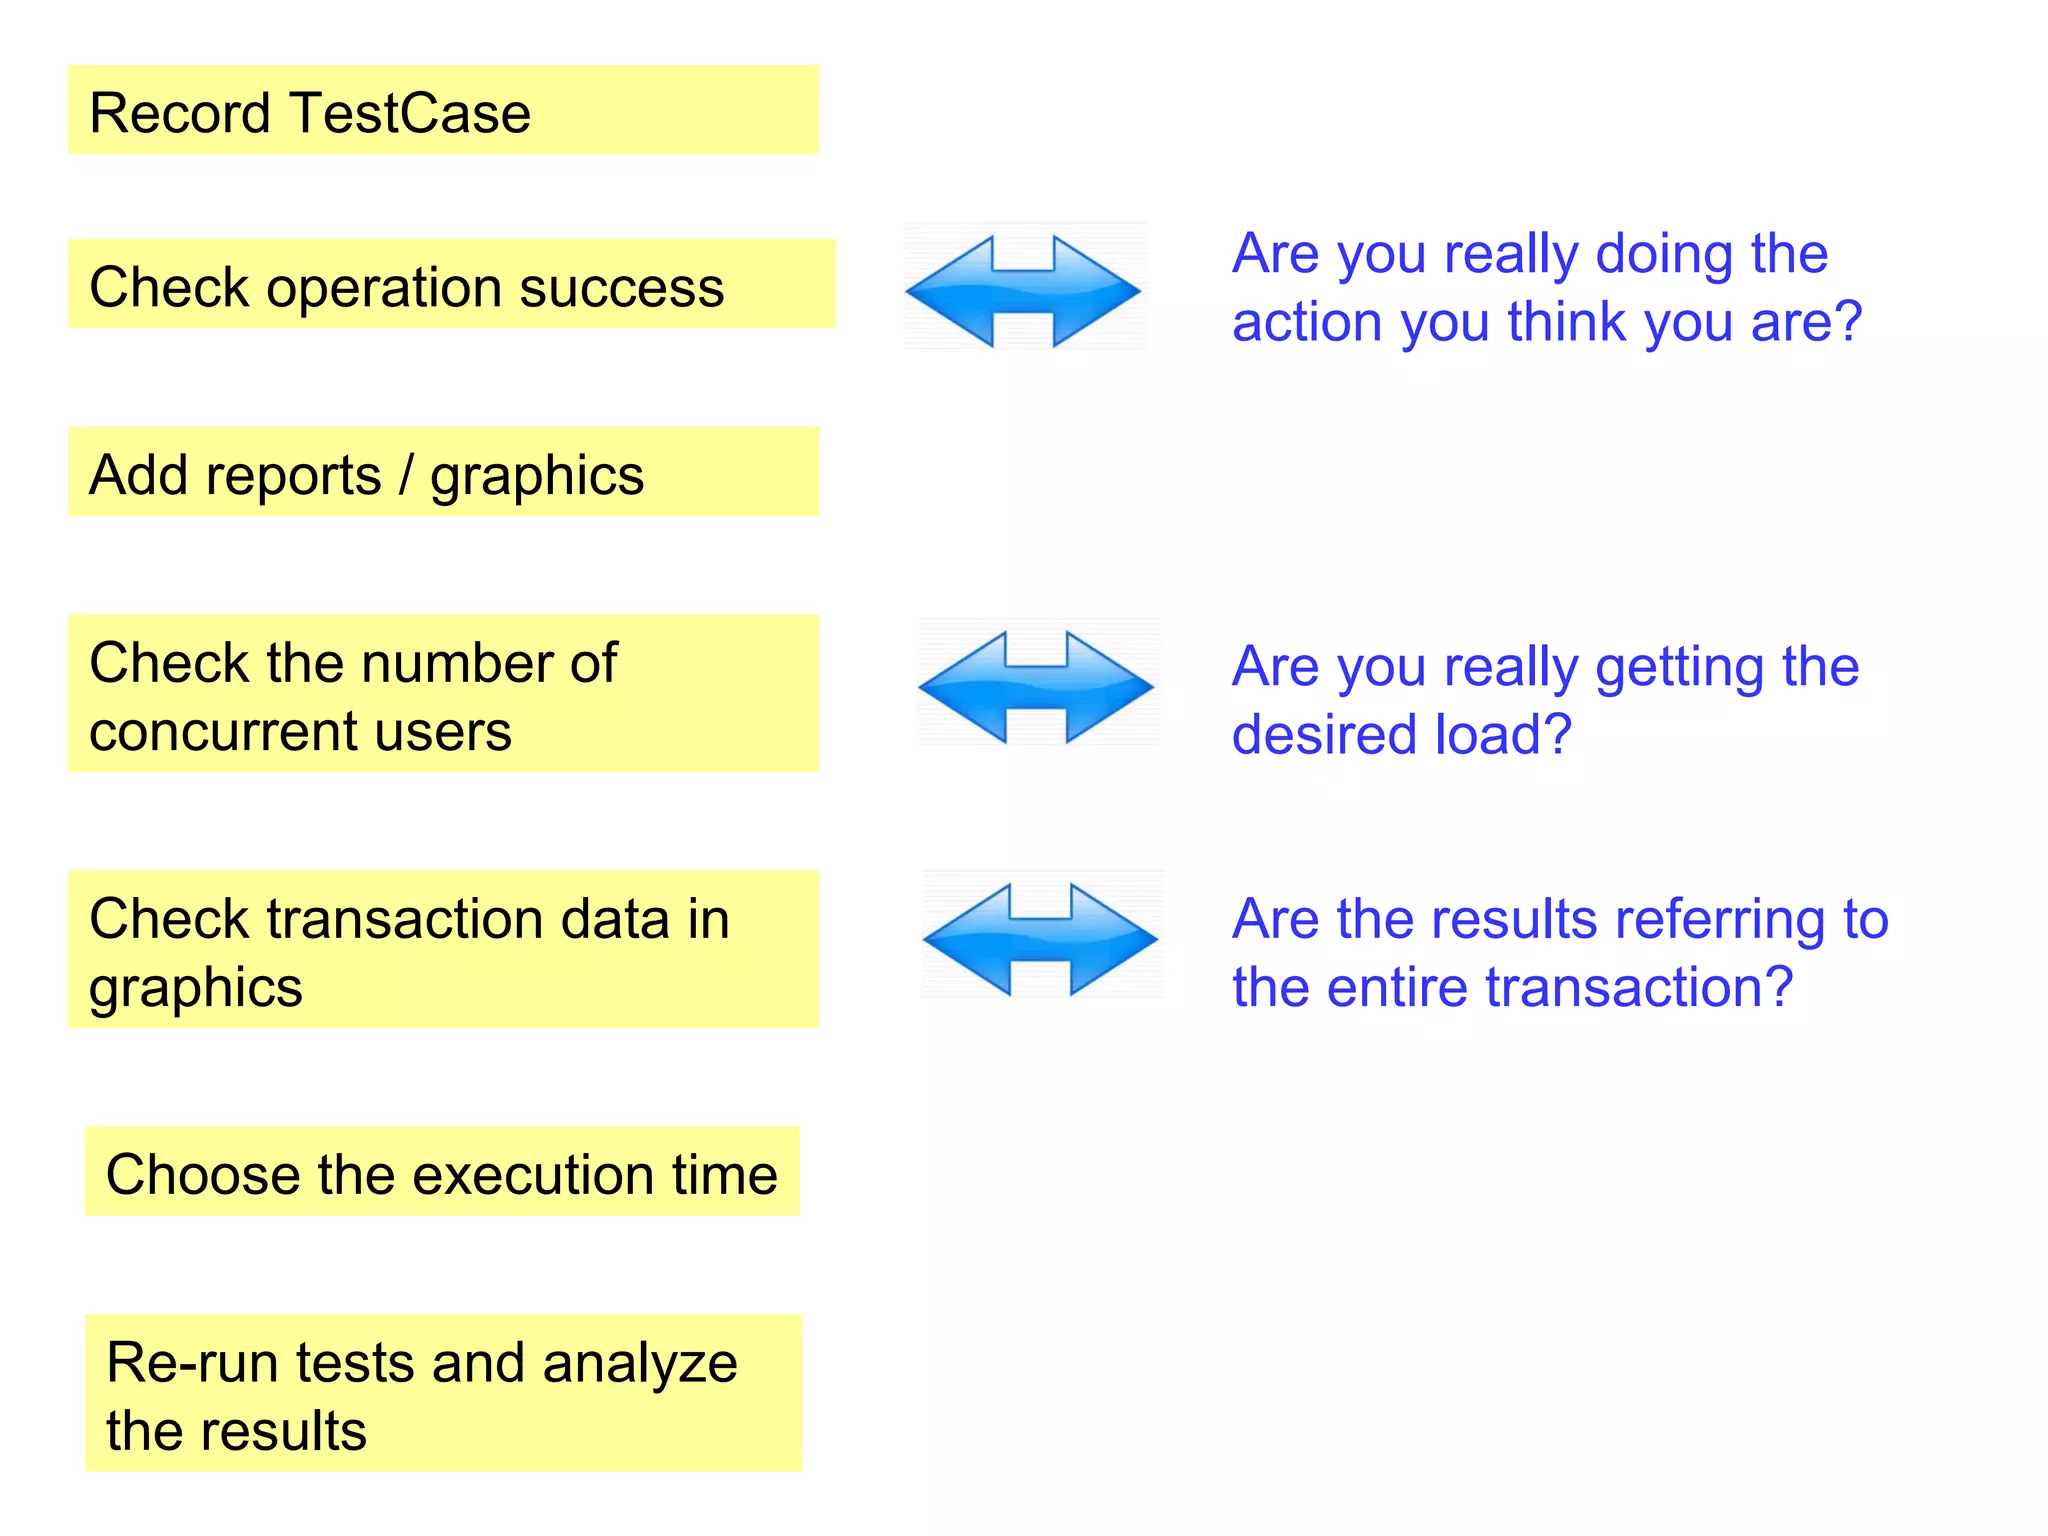
Performance testing determines /validates
Speed

Stability
Scalability
What we measure:

Response
times

Throughput

Resource
utilization
Load testing
Determine a system’s behavior under
normal conditions
anticipated peak load conditions
Used to identify:
 maximum operating capacity
 bottlenecks
 which element is causing degradation
Stress testing
Load the system to its breakpoint

Used to identify the system break point

It’s important to monitor how the system breaks and
recovers
Volume testing
Testing a system with a certain amount of data. Usually
includes high data and throughput volumes

Endurance testing

Testing a system under load for an extended period of
time to establish stability and behavior under sustained
use
Using JMeter to test performance of my web
application while having 100 concurrent logins
It’s not the first login for the user, so that some elements (like images,
css, js) are already cached in browser

1. System Configuration
2. Scenario to register with JMeter: the user logs into application
 Add a Thread Group to the Test Plan






Test Plan - for containing the tests
Thread Group - for representing users
Select Test Plan
Add-> Threads->Thread Group

Add a Recording Controller to the Thread Group

 Controllers – for grouping and applying logic
to test items
 Select Thread Group
 Add -> Logic Controller-> Recording Controller
 Add a HTTP Proxy server to the WorkBench

 WorkBench - used for temporary items
Add-> Non-Test Elements -> HTTP Proxy server
configure it to use the recording controller
 Configure your browser to use the proxy and start the proxy server
 Open the browser, enter address for login page, login with the user
The following HTTP requests are registered into Recording Controller

The login action for a permanent teacher is made by 3 HTTP requests:
 accessing the login page
 entering the credential and the effective login
 redirect action to a default page
The login credentials are automatically saved for the second request,
Which is the effective login step
Obs 1: Make sure that you really do the action you think you are

 Check that the login effectively succeeded
For this, add a View Results Tree listener to the Recording controller

 Listeners - for display of data
 Add -> Listener -> View Results Tree
 Re-run the test and look to see the page where we are redirected
We can observe that, in fact the login didn’t succeed and we are
still in the login page
 Add a HTTP Cache manager to the recording controller and rerun the test
Configuration element - can modify requests
Add-> Config Element-> HTTP Cookie Manager
 Add Listeners to see statistics of the execution

First install JMeter Plugins
 From http://jmeter-plugins.org/downloads/all/ download the
JMeterPlugins-1.1.0.zip
 Copy JMeterPlugins.jar file from JMeterPlugins-1.1.0.zip inside
JMETER_INSTALL_DIR/lib/ext, for example to c:jmeterlibext in case
of windows installation
 Restart JMeter and see jp@gc-prefixed plugins in menus
Then add the Listeners
 Select Thread Group
 Add -> Listener and add the following listeners:

 Active Threads Over Time
 Transactions per Second
 Response Times vs Threads
 Summary Report
 In Thread Group enter the following values and re-run the test
Number of concurrent users = 100
Ramp-up period = 10
Loop Count = 1
 The ramp-up period tells JMeter how long to take to "ramp-up" to
the full number of threads chosen
 If 100 threads are used, and the ramp-up period is 10 seconds,
then JMeter will take 10 seconds to get all 100 threads up and
running
 Theoretically, each thread will start 0.1(10/100) seconds after the
previous thread was begun
The ramp-up should be:
 long enough to avoid too large a work-load at the start of a test
 short enough that the last threads start running before the first
ones finish
Obs 2: Make sure that you really get the desired load

If we analyze the data, we see that the maximum number of concurrent
threads is 57, not 100!
Obs 3: Make sure that the results refer to the entire transaction

 When looking into the other graphs/reports we see that for each of the
three requests is generated a line
In Summary Report, for each child request was generated a line

But in this case we are interested by the total time, which refers to the
entire login transaction
 We are interested in having 100 concurrent users and to evaluate the
entire login transaction (which is composed by all the three requests)
So we’ll do the following changes:
 In Thread Group check Forever for execution
 Select Recording Controller and Change it to Transaction Controller
 Select the Transaction Controller, check Generate parent sample and
uncheck the second option, then re-run the test

The statistics in reports refer now to the entire transaction
 Wait to obtain 100 concurrent threads in Active Threads Over Time
report, then wait for a while before stopping the execution
Observations (after stopping the execution):
 The test has run for about 40 sec
 100 concurrent users were obtained after 10 sec
 The next 30 sec were used to obtain statistics, in different graphics.
The number of users remained 100 until the test was manually stopped
If you consider that the chosen period of time (40 sec) is good enough
to get significant trends then use this value as execution time
 In Thread Group enter 40 in Duration(seconds) field and re-run the
tests
3. Analyze the results
Active Threads Over Time:
 how many active threads are in each thread group during test run
 Theoretically, each thread will start 0.1(10/100)
seconds after the previous thread was begun

 Practically, the start of each
thread depends on
factors like available resources
(e.g. machine CPU), by the load
created by the other threads and
so on, so that differences may
appear
Transactions per second
The load generated by the100 concurent users during 40 seconds
created a number of maximum 16 concurrent transactions/seconds

Obs 4: 100 concurrent users/threads don’t mean 100 concurrent
transactions
 The response times vary between 1.5 sec when having 15 active
threads and almost 20 sec when reaching 100 active threads
Response Time - Time to last byte

 Time from the moment the request was sent till the last resource is
finished downloading

Response Latency

- Time to first byte

 Time from the moment the request was sent till the first byte of the
first resource is received back
Response Time

Response Latency

Time to last byte

Time to first byte
Summary Report

 Samples – the number of samples with same label
A sample mean one sampler call, in our case – one login transaction
 Average
 The average time taken to receive the destination web page
(where the user is redirected after login)
 In our case there were 238 values of receiving time which were
added and divided by 238
 Min and Max
The minimum and maximum value of time required for receiving the
destination web page
 Std. Dev
How many exceptional cases were found which were deviating from
the average value of the receiving time. The lesser this value more
consistent the time pattern is assumed
Error %
Indicates the percentage of error
Avg. Bytes
Average size of the sample response in bytes
 Throughput

 Calculated as requests/unit of time
 The time is calculated from the start of the first sample to the end of
the last sample. This includes any intervals between samples, as it is
supposed to represent the load on the server
In our case:
The Average Bytes = 5167.7 Bytes ~ 5.046 KB
 KB/sec = 30.18
Throughput = 30.18 /5.046 ~ 6 requests/seconds
One transaction request has an average size of 5.046 KB and there
were registered 30.18 KB/sec => this means there were about 6
requests per second
 Monitor the server resources
Add listener to Thread Group
Add-> Listener-> Perf Monitor Collector
On server configure a Server Agent to retrieve data for the report
http://jmeter-plugins.org/wiki/PerfMonAgent/

CPU: between 77.37% and 100%
Memory: between 27% and 80%
Network I/O : between 0 and 19744 bytes/s
Record TestCase
Check operation success

Are you really doing the
action you think you are?

Add reports / graphics
Check the number of
concurrent users

Are you really getting the
desired load?

Check transaction data in
graphics

Are the results referring to
the entire transaction?

Choose the execution time
Re-run tests and analyze
the results
Bibliography:
1. http://jmeter-expert.blogspot.ro/
2. http://www.slideshare.net/vivizam/how-to-analyze-reports-in-jmeter
3. http://stackoverflow.com/questions/346788/difference-between-baseline-and-benchmark-inperformance-of-an-application
4. http://www.performancetesting.co.za/Baseline%20Testing.htm
5. https://en.wikipedia.org/wiki/Load_testing
6. http://stackoverflow.com/questions/8397700/jmeter-response-time-calculation
7. http://stackoverflow.com/questions/12303535/meaning-and-calculation-formulas-for-processingtime-latency-and-response-time
8. http://blazemeter.com/blog/load-testing-mobile-apps-made-easy (mobile)
9. https://a.blazemeter.com/node/add/jcs?status=trial&rnd=1380662288 (mobile)
10. http://jmeter-plugins.org/wiki/PerfMonAgent/
Please fill in your evaluation form
Performance testing for Web applications with JMeter
Codruta Salomia

codrutasalomia@yahoo.com
12th of October 2013

Iasi code camp 12 october 2013 performance testing for web applications with j-meter- codrutasalomia

  • 3.
    Performance testing determines/validates Speed Stability Scalability
  • 4.
  • 5.
    Load testing Determine asystem’s behavior under normal conditions anticipated peak load conditions Used to identify:  maximum operating capacity  bottlenecks  which element is causing degradation
  • 6.
    Stress testing Load thesystem to its breakpoint Used to identify the system break point It’s important to monitor how the system breaks and recovers
  • 7.
    Volume testing Testing asystem with a certain amount of data. Usually includes high data and throughput volumes Endurance testing Testing a system under load for an extended period of time to establish stability and behavior under sustained use
  • 9.
    Using JMeter totest performance of my web application while having 100 concurrent logins It’s not the first login for the user, so that some elements (like images, css, js) are already cached in browser 1. System Configuration
  • 10.
    2. Scenario toregister with JMeter: the user logs into application  Add a Thread Group to the Test Plan      Test Plan - for containing the tests Thread Group - for representing users Select Test Plan Add-> Threads->Thread Group Add a Recording Controller to the Thread Group  Controllers – for grouping and applying logic to test items  Select Thread Group  Add -> Logic Controller-> Recording Controller
  • 11.
     Add aHTTP Proxy server to the WorkBench  WorkBench - used for temporary items Add-> Non-Test Elements -> HTTP Proxy server configure it to use the recording controller
  • 12.
     Configure yourbrowser to use the proxy and start the proxy server
  • 14.
     Open thebrowser, enter address for login page, login with the user The following HTTP requests are registered into Recording Controller The login action for a permanent teacher is made by 3 HTTP requests:  accessing the login page  entering the credential and the effective login  redirect action to a default page The login credentials are automatically saved for the second request, Which is the effective login step
  • 17.
    Obs 1: Makesure that you really do the action you think you are  Check that the login effectively succeeded For this, add a View Results Tree listener to the Recording controller  Listeners - for display of data  Add -> Listener -> View Results Tree  Re-run the test and look to see the page where we are redirected
  • 18.
    We can observethat, in fact the login didn’t succeed and we are still in the login page
  • 19.
     Add aHTTP Cache manager to the recording controller and rerun the test Configuration element - can modify requests Add-> Config Element-> HTTP Cookie Manager
  • 20.
     Add Listenersto see statistics of the execution First install JMeter Plugins  From http://jmeter-plugins.org/downloads/all/ download the JMeterPlugins-1.1.0.zip  Copy JMeterPlugins.jar file from JMeterPlugins-1.1.0.zip inside JMETER_INSTALL_DIR/lib/ext, for example to c:jmeterlibext in case of windows installation  Restart JMeter and see jp@gc-prefixed plugins in menus
  • 21.
    Then add theListeners  Select Thread Group  Add -> Listener and add the following listeners:  Active Threads Over Time  Transactions per Second  Response Times vs Threads  Summary Report
  • 22.
     In ThreadGroup enter the following values and re-run the test Number of concurrent users = 100 Ramp-up period = 10 Loop Count = 1
  • 23.
     The ramp-upperiod tells JMeter how long to take to "ramp-up" to the full number of threads chosen  If 100 threads are used, and the ramp-up period is 10 seconds, then JMeter will take 10 seconds to get all 100 threads up and running  Theoretically, each thread will start 0.1(10/100) seconds after the previous thread was begun The ramp-up should be:  long enough to avoid too large a work-load at the start of a test  short enough that the last threads start running before the first ones finish
  • 24.
    Obs 2: Makesure that you really get the desired load If we analyze the data, we see that the maximum number of concurrent threads is 57, not 100!
  • 25.
    Obs 3: Makesure that the results refer to the entire transaction  When looking into the other graphs/reports we see that for each of the three requests is generated a line
  • 26.
    In Summary Report,for each child request was generated a line But in this case we are interested by the total time, which refers to the entire login transaction
  • 27.
     We areinterested in having 100 concurrent users and to evaluate the entire login transaction (which is composed by all the three requests) So we’ll do the following changes:  In Thread Group check Forever for execution
  • 28.
     Select RecordingController and Change it to Transaction Controller
  • 29.
     Select theTransaction Controller, check Generate parent sample and uncheck the second option, then re-run the test The statistics in reports refer now to the entire transaction
  • 30.
     Wait toobtain 100 concurrent threads in Active Threads Over Time report, then wait for a while before stopping the execution
  • 31.
    Observations (after stoppingthe execution):  The test has run for about 40 sec  100 concurrent users were obtained after 10 sec  The next 30 sec were used to obtain statistics, in different graphics. The number of users remained 100 until the test was manually stopped If you consider that the chosen period of time (40 sec) is good enough to get significant trends then use this value as execution time
  • 32.
     In ThreadGroup enter 40 in Duration(seconds) field and re-run the tests
  • 33.
  • 34.
    Active Threads OverTime:  how many active threads are in each thread group during test run  Theoretically, each thread will start 0.1(10/100) seconds after the previous thread was begun  Practically, the start of each thread depends on factors like available resources (e.g. machine CPU), by the load created by the other threads and so on, so that differences may appear
  • 35.
    Transactions per second Theload generated by the100 concurent users during 40 seconds created a number of maximum 16 concurrent transactions/seconds Obs 4: 100 concurrent users/threads don’t mean 100 concurrent transactions
  • 36.
     The responsetimes vary between 1.5 sec when having 15 active threads and almost 20 sec when reaching 100 active threads
  • 37.
    Response Time -Time to last byte  Time from the moment the request was sent till the last resource is finished downloading Response Latency - Time to first byte  Time from the moment the request was sent till the first byte of the first resource is received back
  • 38.
    Response Time Response Latency Timeto last byte Time to first byte
  • 39.
    Summary Report  Samples– the number of samples with same label A sample mean one sampler call, in our case – one login transaction  Average  The average time taken to receive the destination web page (where the user is redirected after login)  In our case there were 238 values of receiving time which were added and divided by 238
  • 40.
     Min andMax The minimum and maximum value of time required for receiving the destination web page  Std. Dev How many exceptional cases were found which were deviating from the average value of the receiving time. The lesser this value more consistent the time pattern is assumed Error % Indicates the percentage of error Avg. Bytes Average size of the sample response in bytes
  • 41.
     Throughput  Calculatedas requests/unit of time  The time is calculated from the start of the first sample to the end of the last sample. This includes any intervals between samples, as it is supposed to represent the load on the server
  • 42.
    In our case: TheAverage Bytes = 5167.7 Bytes ~ 5.046 KB  KB/sec = 30.18 Throughput = 30.18 /5.046 ~ 6 requests/seconds One transaction request has an average size of 5.046 KB and there were registered 30.18 KB/sec => this means there were about 6 requests per second
  • 43.
     Monitor theserver resources Add listener to Thread Group Add-> Listener-> Perf Monitor Collector On server configure a Server Agent to retrieve data for the report http://jmeter-plugins.org/wiki/PerfMonAgent/ CPU: between 77.37% and 100% Memory: between 27% and 80% Network I/O : between 0 and 19744 bytes/s
  • 44.
    Record TestCase Check operationsuccess Are you really doing the action you think you are? Add reports / graphics Check the number of concurrent users Are you really getting the desired load? Check transaction data in graphics Are the results referring to the entire transaction? Choose the execution time Re-run tests and analyze the results
  • 45.
    Bibliography: 1. http://jmeter-expert.blogspot.ro/ 2. http://www.slideshare.net/vivizam/how-to-analyze-reports-in-jmeter 3.http://stackoverflow.com/questions/346788/difference-between-baseline-and-benchmark-inperformance-of-an-application 4. http://www.performancetesting.co.za/Baseline%20Testing.htm 5. https://en.wikipedia.org/wiki/Load_testing 6. http://stackoverflow.com/questions/8397700/jmeter-response-time-calculation 7. http://stackoverflow.com/questions/12303535/meaning-and-calculation-formulas-for-processingtime-latency-and-response-time 8. http://blazemeter.com/blog/load-testing-mobile-apps-made-easy (mobile) 9. https://a.blazemeter.com/node/add/jcs?status=trial&rnd=1380662288 (mobile) 10. http://jmeter-plugins.org/wiki/PerfMonAgent/
  • 46.
    Please fill inyour evaluation form Performance testing for Web applications with JMeter Codruta Salomia codrutasalomia@yahoo.com 12th of October 2013