Download as PDF, PPTX

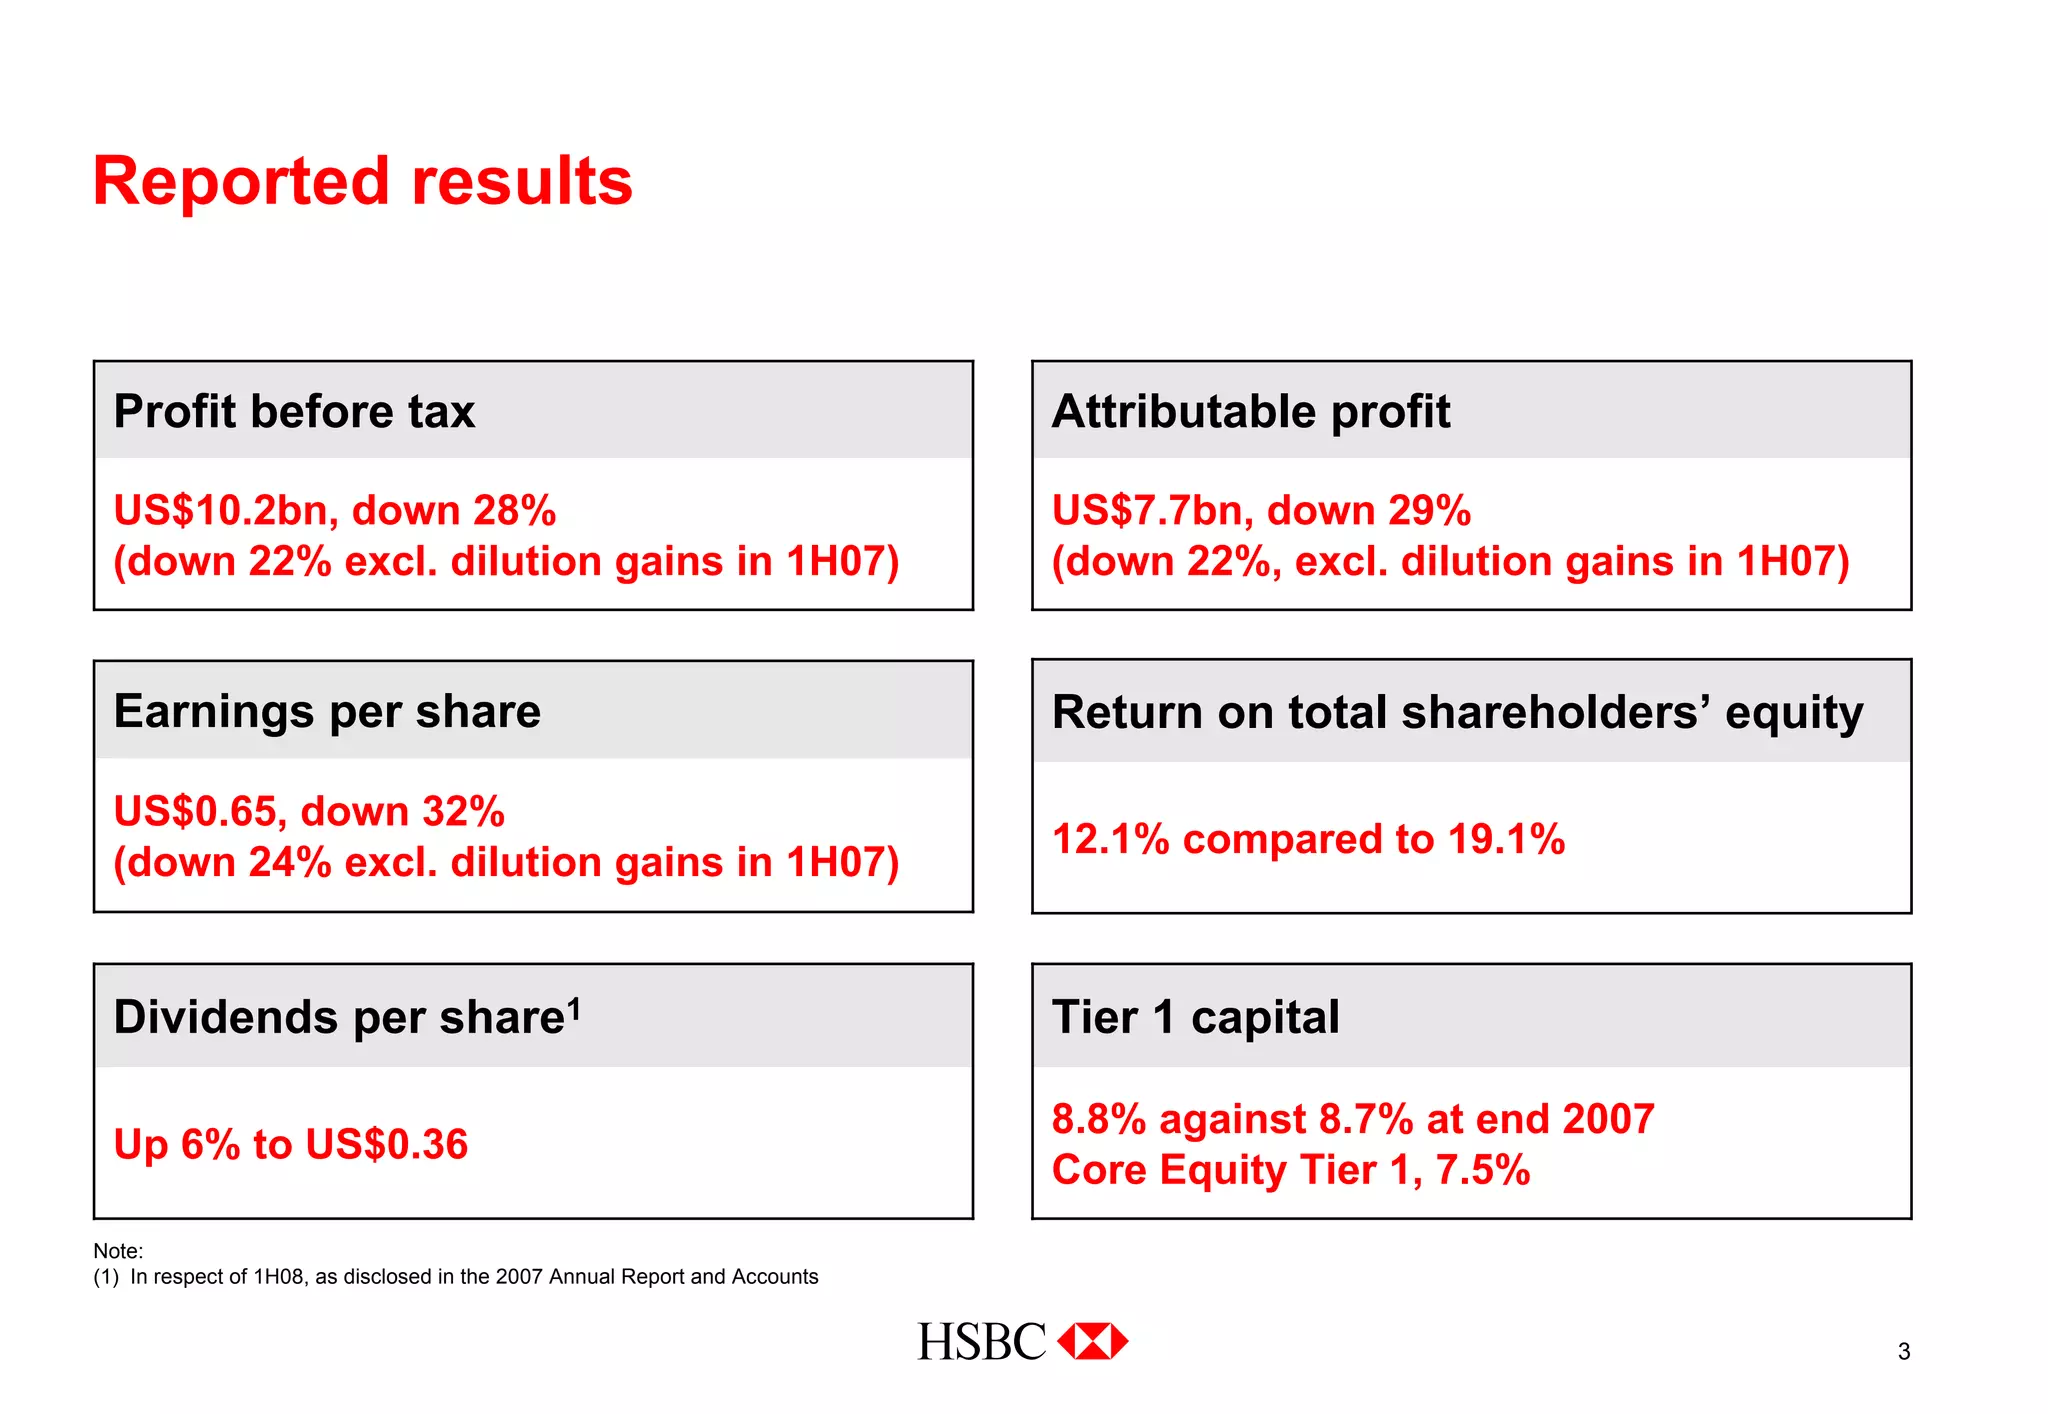
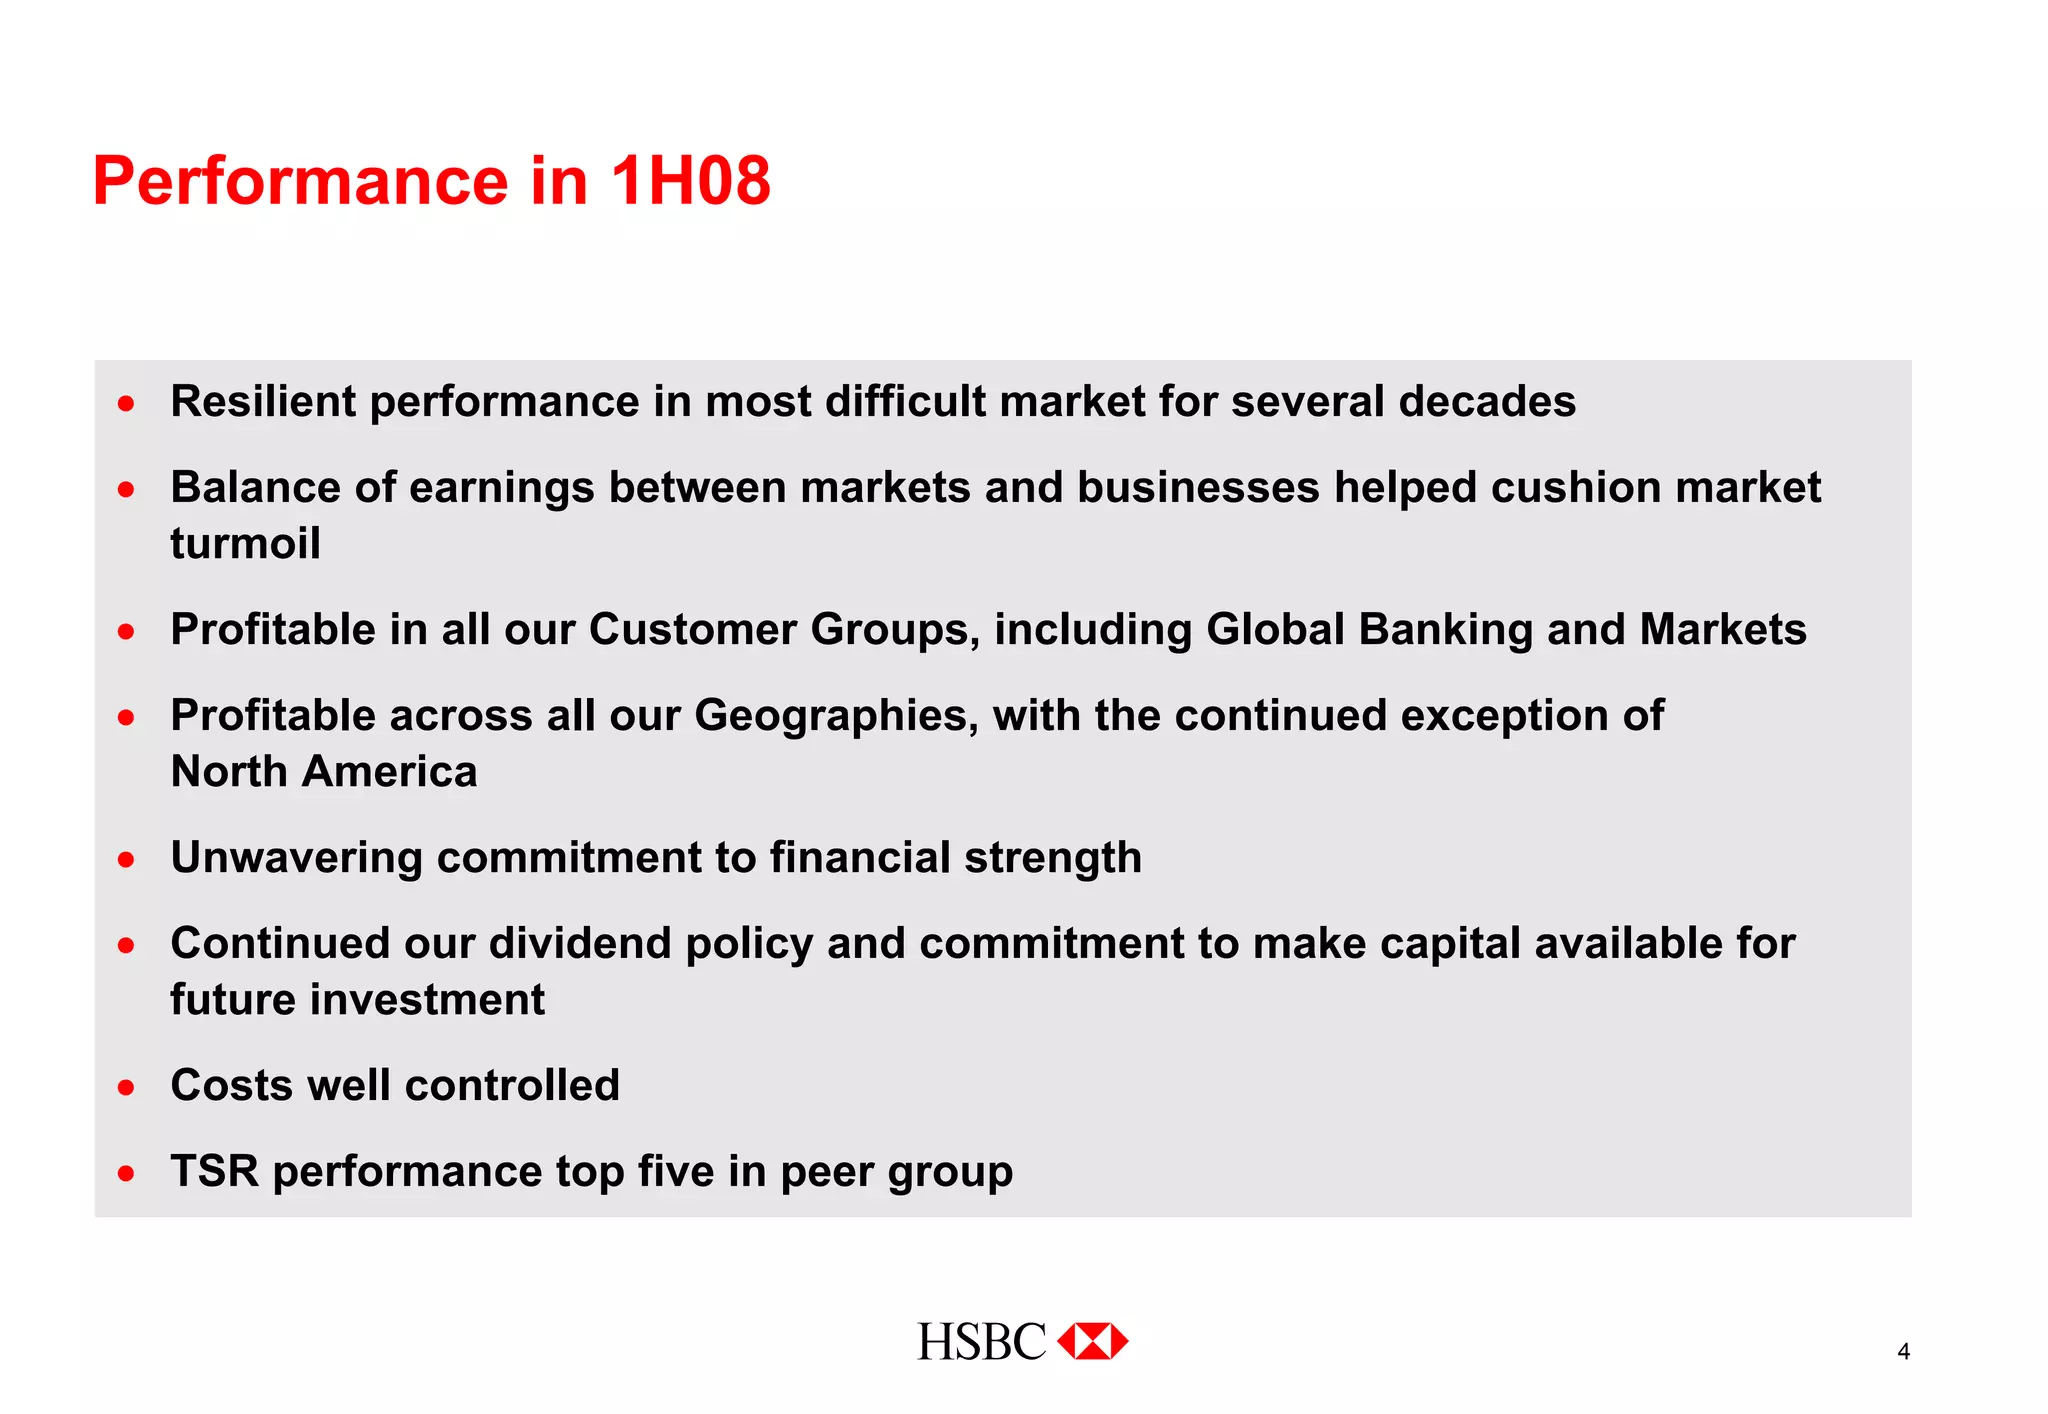
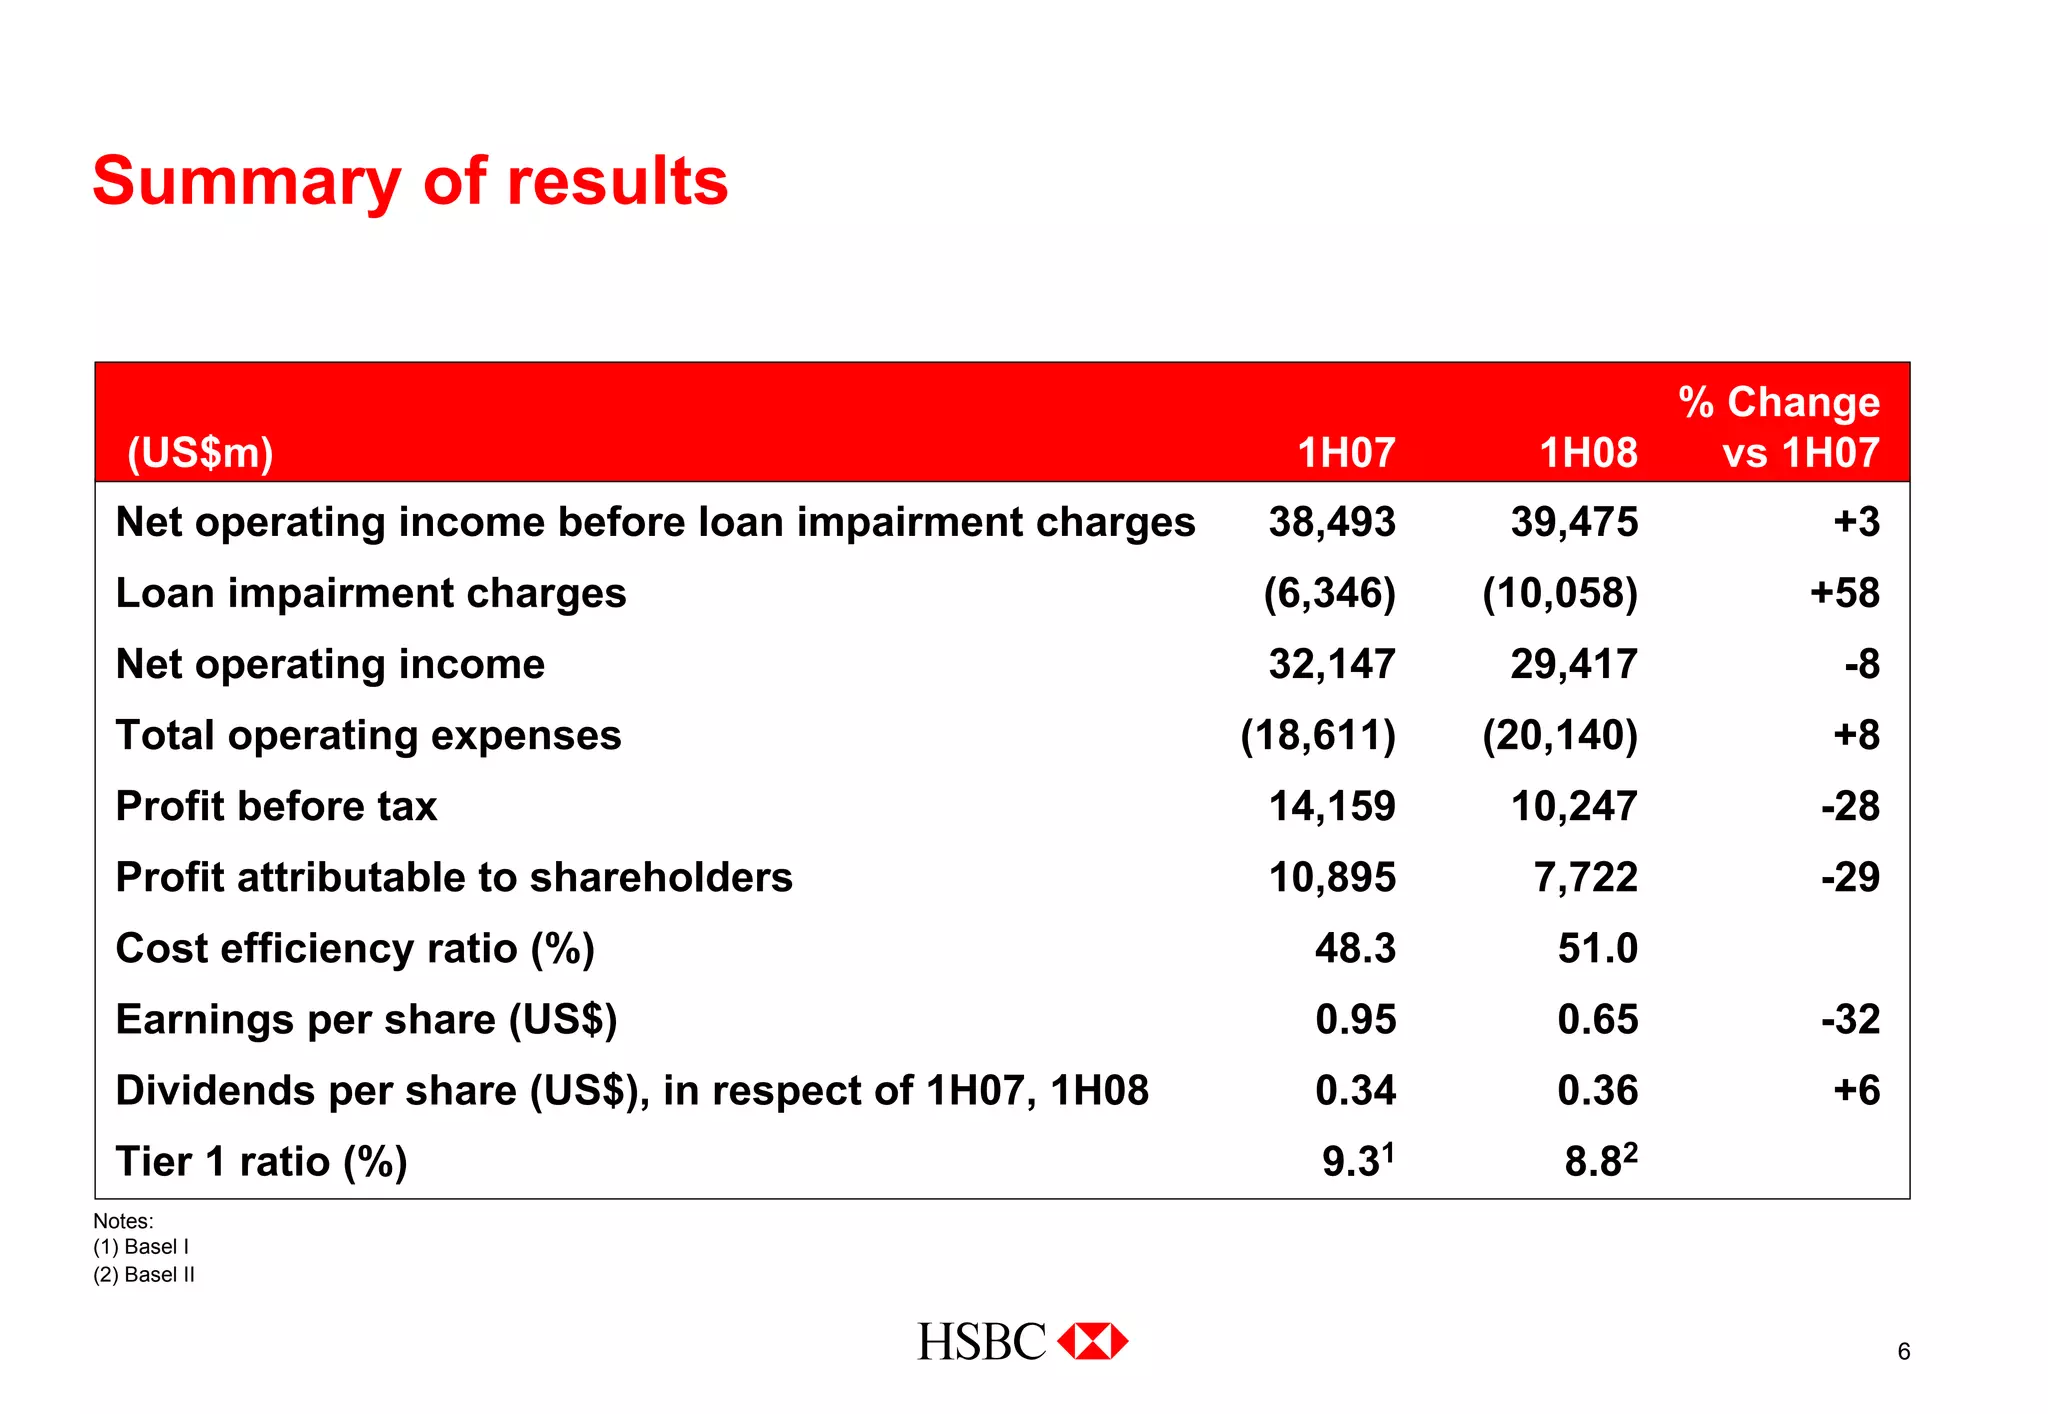
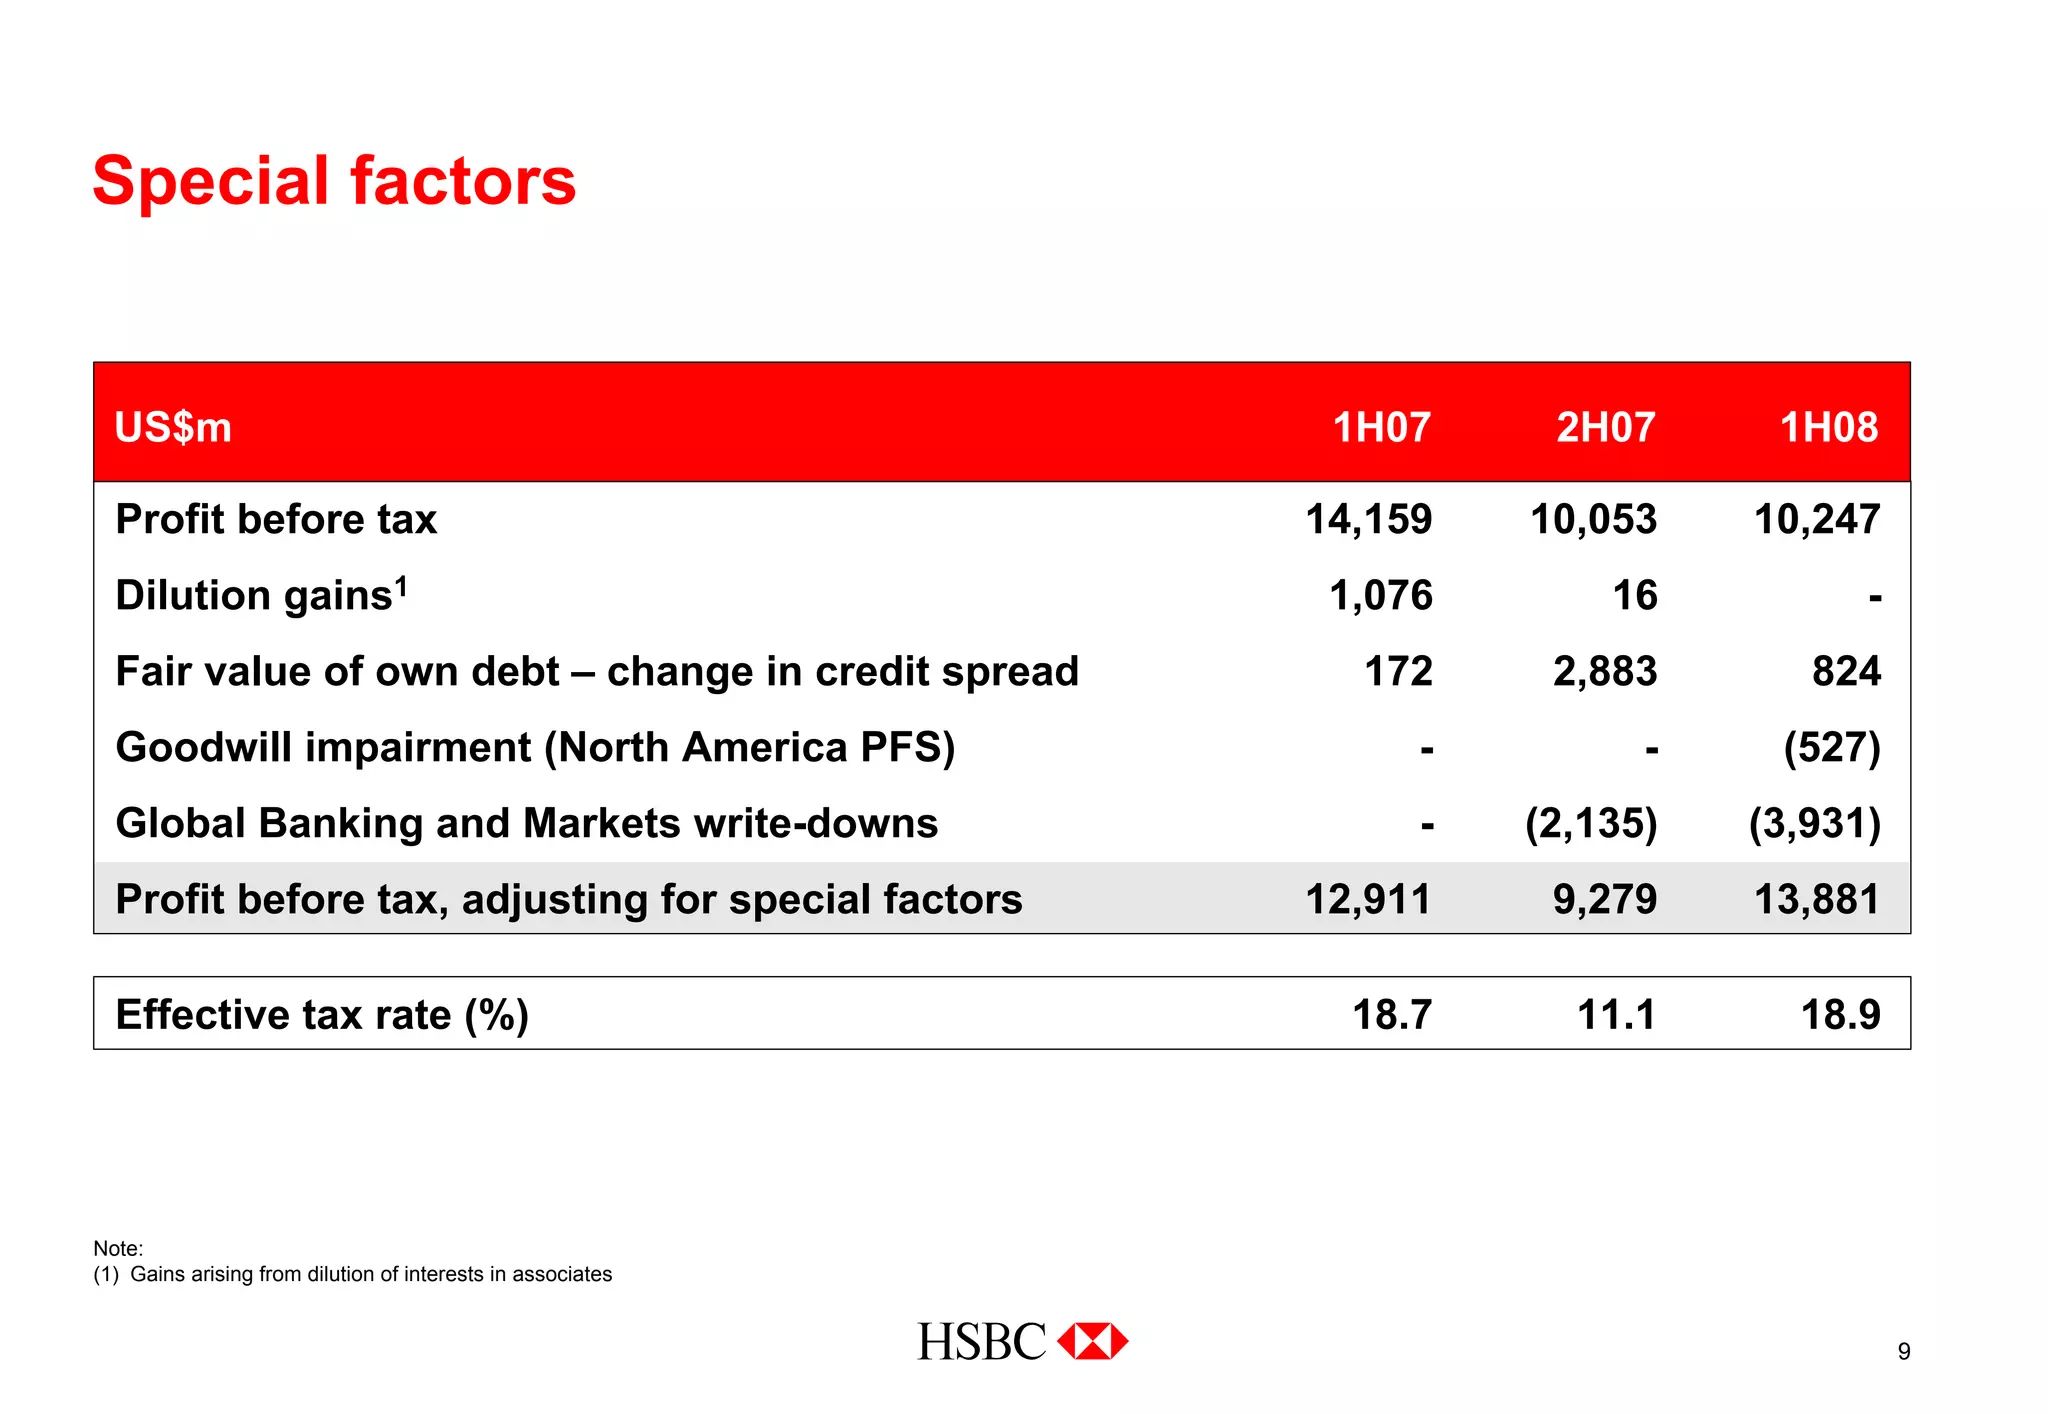


HSBC reported financial results for the first half of 2008. Profit before tax was $10.2 billion, down 28% from the first half of 2007. Earnings per share were $0.65, down 32% from the previous year. Loan impairment charges increased 58% to $10.1 billion due to deterioration in credit quality, particularly in North America. However, the bank remained profitable in all regions except North America and maintained a strong capital position with a Tier 1 capital ratio of 8.8%. Global Banking and Markets wrote down $3.9 billion related to subprime and credit market exposures.


