The HS 3073 health promotion program planning project aims to design effective health education/promotion programs by requiring teams or individuals to complete two draft reports that will contribute to a final project due at semester's end. Each draft must follow specified formatting, content, and citation guidelines, and students are expected to contribute fairly to their projects to avoid penalties. The reports should cover aspects such as stakeholder engagement, mission statements, goals, and objectives related to health issues identified within the community.
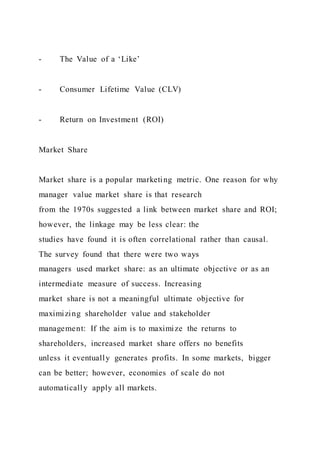
![reference list must adhere to APA format.
Also, tables, figures, and appendices should be formatted
according to APA. See the APA Publication
Manual (6th ed.) for details. Be careful not to plagiarize.
6) Cover Page: Each draft report should include a cover page
with the following information:
➢ Draft Report #[report number]: [Report Title] Example:
Draft Report #1: Needs
Assessment & Community Partner
➢ Key Health Issue & Target Population
➢ Student Names
➢ Course Number and Title
➢ Semester
➢ Date Submitted
DRAFT REPORT #2
STAKEHOLDERS, SUPPORTERS, & MARKETING
MISSION STATEMENT, GOALS, & OBJECTIVES](https://image.slidesharecdn.com/hs3073healthpromotionprogramplanningprojectdraft-220921190556-f906e55d/85/HS-3073-Health-Promotion-Program-Planning-Project-Draft-3-320.jpg)
![gram, where to launch it, which incentive structure to offer, and
how many
participants to include. Even more than other parts of the
marketing function,
this will require firms to follow and learn from academic
research. Given the
complexities and the non-linear effects of WOM, attempts to
create generaliza-
tions on how profit emerges from social influence are far from
trivial and may
become less based on managerial intuition. Yet managers,
consultants, and
research organizations should continue to monitor the emerging
research stream
on WOM and WOM marketing, examine the applicability of the
findings to their
specific case, and see how they can further use informed
decision making to
enhance customer equity.
Author Biographies
Michael Haenlein is a Professor of Marketing at the Paris
campus of ESCP Europe,
specialized in the fields of word-of-mouth, customer
relationship management,
social influence, and social media (email: [email protected]).
Barak Libai is a Professor of Marketing at the Arison School of
Business,
Interdisciplinary Center (IDC) Israel, and a recent co-author of
Innovation Equity
(The University of Chicago Press) (email: [email protected]).
Notes
1. Raj Sethuraman, Gerard J. Tellis, and Richard A. Briesch,](https://image.slidesharecdn.com/hs3073healthpromotionprogramplanningprojectdraft-220921190556-f906e55d/85/HS-3073-Health-Promotion-Program-Planning-Project-Draft-54-320.jpg)
![“How Well Does Advertising Work?
Generalizations from Meta-analysis of Brand Advertising
Elasticities,” Journal of Marketing
Research, 48/3 (June 2011): 457-471.
2. Nielsen, “Word-of-Mouth Recommendations Remain the
Most Credible,” Nielsen.com,
July 10 2015, http://www.nielsen.com/id/en/press-
room/2015/WORD-OF-MOUTH-
RECOMMENDATIONS-REMAIN-THE-MOST-
CREDIBLE.html.
3. Word of Mouth Marketing Association, Return on Word of
Mouth, (Chicago, Word of Mouth
Marketing Association, 2014).
4. Gabriel Weinberg and Justin Mares, Traction: How Any
Startup Can Achieve Explosive Customer
Growth (New York, NY: Portfolio, 2015).
5. Word of Mouth Marketing Association, op. cit.
6. Barak Libai, Eitan Muller, and Renana Peres, “Decomposing
the Value of Word-of-Mouth
Seeding Programs: Acceleration versus Expansion,” Journal of
Marketing Research, 50/2 (April
2013): 161-176.
7. “American Marketing Association 2013 Fact Book,”
Marketing Insights, 25/4 (Winter 2013):
24-28.
mailto:[email protected]
mailto:[email protected]
http://www.nielsen.com/id/en/press-room/2015/WORD-OF-](https://image.slidesharecdn.com/hs3073healthpromotionprogramplanningprojectdraft-220921190556-f906e55d/85/HS-3073-Health-Promotion-Program-Planning-Project-Draft-55-320.jpg)