Recommended

Recommended
More Related Content
What's hot
What's hot (20)
Viewers also liked
Similar to Point of Care Microfluidics Device for hr-HPV Detection
Similar to Point of Care Microfluidics Device for hr-HPV Detection (20)
More from CFTCC
More from CFTCC (20)
Recently uploaded
Recently uploaded (20)
Point of Care Microfluidics Device for hr-HPV Detection
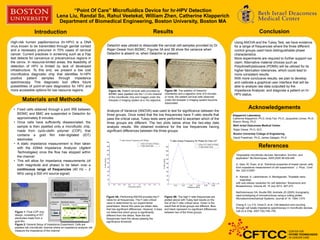
- 1. “Point Of Care” Microfluidics Device for hr-HPV Detection Lena Liu, Randal So, Rahul Veetekat, William Zhen, Catherine Klapperich Department of Biomedical Engineering, Boston University, Boston MA High-risk human papillomavirus (hr-HPV) is a DNA virus known to be transmitted through genital contact and a necessary precursor in 70% cases of cervical cancer. Current practices in screening such as a Pap test detects for cancerous or precancerous regions in the cervix. In resource-limited areas, the feasibility of detection of HPV is limited by lack of developed infrastructure. To this end, we present a low cost microfluidics diagnostic chip that identifies hr-HPV positive patient samples through impedance spectroscopy. This diagnostic tool offers future possibilities of point-of-care diagnostics for HPV and more accessible options for low resource regions. • Fixed cells obtained through a joint IRB between BIDMC and BMC are suspended in Detachin for approximately 8 minutes • Once cells have sufficiently disassociated, the sample is then pipetted onto a microfluidic chip, made from cyclo-olefin polymer (COP), that contains a gold film inter-digitated (IDT) electrodes • A static impedance measurement is then taken with the 4294A Impedance Analyzer (Agilent Technologies) once the flow has stopped within the channel • This will allow for impedance measurements (of both magnitude and phase) to be taken over a continuous range of frequencies (40 Hz – 2 MHz using a 500 mV source signal) Detachin was utilized to dissociate the cervical cell samples provided by Dr. Rajan Dewar from BIDMC. Figures 3A and 3B show the variance when Detachin is absent vs. when Detachin is present. Analysis of Variance (ANOVA) was used to test for significance between the three groups. Once noted that the low frequencies have F-ratio results that pass the critical value, Tukey tests were performed to ascertain which of the three groups are different. The two plots below show the two-step data analysis results. We obtained evidence for the low frequencies having significant differences between the three groups. “Disposable microfluidic devices: fabrication, function, and application” BioTechniques, 2005;2005:38:429-446 G. Qiao, W. Duan, et al. “Electrical properties of breast cancer cells from impedance measurement of cell suspensions” J. Phys.: Conf. Ser. 224 012081 A. Kanwal, S. Lakshmanan, A. Bendigavale. “Scalable nano- bioprobes with sub-cellular resolution for cell detection” Biosensors and Bioelectronics. Volume 45, 15 July 2013. 267-273 Bartholomeusz DA, Boutte RW, Andrade JD (2005) Xurography: rapid prototyping of microstructures using a cutting plotter. Microelectromechanical Systems, Journal of 14: 1364–1374. Cheng X, Liu Y-S, Irimia D, et al. Cell detection and counting through cell lysate impedance spectroscopy in microfluidic devices. Lab on a Chip. 2007;7(6):746–755. Klapperich Laboratory Catherine Klapperich, Ph.D, Andy Fan, Ph.D, Jacqueline Linnes, Ph.D, Sharon Wong, Ph.D Beth Israel Deaconess Medical Center Rajan Dewar, Ph.D, M.D. Boston University College of Engineering David Freedman, Ph.D, James Galagan, Ph.D Introduction Materials and Methods Results Figure 4A: Performing ANOVA provides the F- ratios for all frequencies. The F-ratio critical value is determined by our experimental parameters. Above this value we obtain data that has significant differences. However, it does not determine which group is significantly different from the others. Note the low frequencies have the values passing the significance threshold. Figure 4B: The high F-ratio frequencies are plotted above with Tukey test results on the line of the F-ratio critical value. Green is the result that all three groups are different. Blue and black represent no significant differences between two of the three groups. Using ANOVA and the Tukey Test, we have evidence for a range of frequencies where the three different control groups used have distinguishable phase characteristics. More experiments are required to further support our claim. Alternative material choices such as Polydimethylsiloxane (PDMS) will be utilized for its higher fabrication tolerances, which could lead to more consistent results. With more conclusive results, we plan to develop and calibrate a graphical user interface that will be able to analyze raw data outputted by the Impedance Analyzer, and diagnose a patient on hr- HPV status. Conclusion Figure 3A: Patient cervical cells provided by BIDMC were pipetted into the 1.2 mm channel of the microfluidic chip and imaged under the Axioplan 2 imaging system at a 10x objective. Figure 3B: The addition of Detachin (Genlantis) and a digestion time of 8 minutes or more, the patient cervical cells observed under the Axioplan 2 imaging system become dissociated Acknowledgements References Figure 1: Final COP chip design, consisting of IDT electrodes made from a gold film Figure 2: General Setup of Impedance Experiment; Cells are pipetted into microfluidic channel where an impedance analyzer will measure the impedance of the channel