Downloaded 12 times

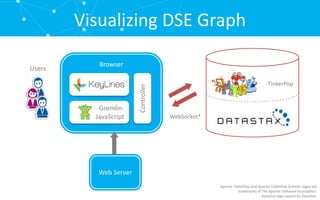
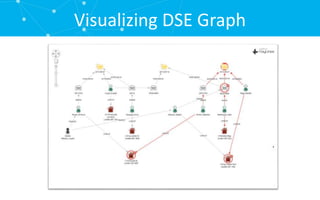
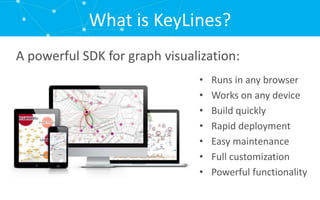


The document outlines the importance and methods of visualizing DSE graph data, emphasizing user engagement and insight discovery through effective visual representation. It highlights the key features of DSE graph, including browser compatibility, rapid development, and customization capabilities. Additionally, it introduces KeyLines, a powerful SDK for graph visualization.


![Seminar_PPT[1] MODIFY on data viualisation](https://cdn.slidesharecdn.com/ss_thumbnails/seminarppt1modify2222-250727055231-3da157b4-thumbnail.jpg?width=640&height=640&fit=bounds)
![Seminar_PPT[1] on data viualisation in machine learninig](https://cdn.slidesharecdn.com/ss_thumbnails/seminarppt1modify-250727055227-a38d6e30-thumbnail.jpg?width=640&height=640&fit=bounds)