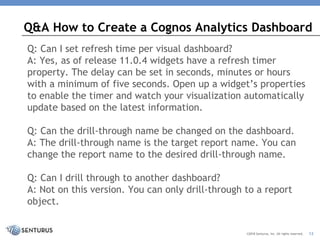
SlideShare a Scribd company logo
HOW TO CREATE A COGNOS
ANALYTICS DASHBOARD
Using the New Drill-Down Feature
• Introductions
• Cognos Analytics dashboard releases overview
• Demo
– Creating dashboards from a relational source
– Add drill through reports to dashboard
– Creating dashboards from files
• Senturus overview
• Additional resources
• Q&A
Agenda
©2018 Senturus, Inc. All rights reserved. 2
©2018 Senturus, Inc. All rights reserved.
Pedro Ining
Senior BI Architect
Senturus, Inc.
Presenters
Kay Knowles
Account Manager
Senturus, Inc.
3
Hundreds of Free Resources
http://www.senturus.com/resources/
RESOURCE LIBRARY
An extensive, free library of past webinars,
demonstrations, whitepapers, presentations, helpful
hints, and more.
©2018 Senturus, Inc. All rights reserved. 4
This slide deck is from the webinar
How to Create a Cognos Analytics
To view the FREE video recording or download this deck
go to:
https://www.senturus.com/resources/how-to-create-a-
cognos-analytics-dashboard/
Hear the Recording
Copyright 2017 Senturus, Inc. All Rights Reserved.
Cognos Analytics Dashboard Enhancements
6
R5 – November 2016
• FM packages in dashboards
• Mapping and new visualizations
R6 – March 2017
• OLAP support in dashboards
• Dashboard widget connectivity
• Mapping enhancements
• Storytelling enhancements
R7 – August 2017
• New UI for portal, dashboard
and modules
• Filter enhancements
• Additional visualizations
R9 – December 2017
• Latitude/longitude support
• Full screen mode
R10 – March 2018
• Drill-thru to reports
• PDF printing
R11 – May 2018
• Custom polygons for
mapping
• Data caching in dashboards
©2018 Senturus, Inc. All rights reserved.
See Demos at
https://www.senturus.com/resourc
es/how-to-create-a-cognos-
analytics-dashboard/
• Review dashboard drill-through concept
• Create a relational dashboard
– Review relational target report
– Connect relational dashboard to relational target
report
– Connect relational dashboard to an OLAP
PowerCube target report
Demo Outline
8©2018 Senturus, Inc. All rights reserved.
Bring us a dated, labor intensive, high-visibility report (in Excel
or other) and one of our senior BI architects will show you what
is possible with improved visualizations and self-service
capabilities in Cognos Analytics, Tableau or Power BI.
During this short engagement we will:
• Understand business needs
• Conduct a data preparation/architecture review and
provide recommendations
• Review deployment plans and security requirements
• Interpret requirements to optimize BI reporting
• Produce sample report or dashboard
• Discuss training options
Dashboard Art of the Possible
©2018 Senturus, Inc. All rights reserved. 9
http://www.senturus.com/training/course-schedule/
TM1, Cognos Analytics & Tableau Training
©2018 Senturus, Inc. All rights reserved. 10
Answers to Participant Questions
QUESTIONS & ANSWERS
Q: Can I set refresh time per visual dashboard?
A: Yes, as of release 11.0.4 widgets have a refresh timer
property. The delay can be set in seconds, minutes or hours
with a minimum of five seconds. Open up a widget’s properties
to enable the timer and watch your visualization automatically
update based on the latest information.
Q: Can the drill-through name be changed on the dashboard.
A: The drill-through name is the target report name. You can
change the report name to the desired drill-through name.
Q: Can I drill through to another dashboard?
A: Not on this version. You can only drill-through to a report
object.
Q&A How to Create a Cognos Analytics Dashboard
©2018 Senturus, Inc. All rights reserved. 12
Q: Can I still have full interactive reports in addition to
drill through at the same time?
A: Yes, the drill target can still be run independently.
Q: Can there be customized tooltips for more information
on the teams?
A: No, not on this version.
Q: Is there any way to enlarge the font size within the
visualization?
A: The fonts scale as the screen becomes larger. There is
currently not a method to have the fonts be a specific
size.
Q&A How to Create a Cognos Analytics Dashboard
©2018 Senturus, Inc. All rights reserved. 13
Q: What are the limitations on the navigation path?
A: The navigation path must be pre-defined on the data
source or data module.
Q: Is it possible for me to pick a template and then
change it to another (so to add another container)?
A: If you select a certain template to begin with you don't
have to use the containers. You can size objects any way
you want (and add more objects than containers) and not
use the template boxes at all. And yes, in the latest
version you can change to another template after you pick
an initial one. This is only available on tabbed templates.
In edit mode click on the tab and you will see an option to
select a different template.
Q&A How to Create a Cognos Analytics Dashboard
©2018 Senturus, Inc. All rights reserved. 14
Q: How do I export a visualization to PDF?
A: When viewing a dashboard, the latest version has a
new selection for Export to PDF in the upper right corner.
Q: Can I combine two data sources on a single
chart/widget?
A: No.
Q&A How to Create a Cognos Analytics Dashboard
©2018 Senturus, Inc. All rights reserved. 15
Q: With the reintroduction of Portal Tabs in 11.0.11, do
you have any comments about going back to using them?
We moved away from them and I'm wondering if we
should go back to using them?
A: This is a rather extensive topic, read about Cognos
Portal Tabs: Past, Present and Future in our blog post for
some guidance.
Q: If vizzes on a dashboard use different data sources will
their behavior still be linked if the column names are the
same?
A: No.
Q&A How to Create a Cognos Analytics Dashboard
©2018 Senturus, Inc. All rights reserved. 16
Q: In dashboards is there a gauge type visualization
available?
A: Not exactly, the closest would be the radial bar.
Q: Can I join filters across two different data sources, i.e
filter year?
A: This could be done by creating a data module to source
the dashboard instead that combines the different data
sources.
Q: Can we build dependent/cascading filters in the global
filters or ‘this tab’ filters?
A: No.
Q&A How to Create a Cognos Analytics Dashboard
©2018 Senturus, Inc. All rights reserved. 17
Q: In dashboards can we still use Framework Manager and
cube charts and if so can they be made interactive?
A: Dashboards can be sourced from packages and/or data
modules. Data modules can be sourced from packages,
flat files, data sets (can be sourced from cubes) and
direct server connections.
Q&A How to Create a Cognos Analytics Dashboard
©2018 Senturus, Inc. All rights reserved. 18
Business Analytics Consultants
WHO WE ARE
Bridging the Gap Between Data & Decision Making
Analysis
Ready
Data
DECISIONS
& ACTIONS
Business Needs
Analysis
Ready
Data
©2018 Senturus, Inc. All rights reserved. 20
• Dashboards, Reporting & Visualizations
• Data Preparation & Modern Data Warehousing
• Self-Service Business Analytics
• Big Data & Advanced Analytics
• Planning & Forecasting Systems
• Proprietary Analytics Connector
Software
Business Analytics Architects
©2018 Senturus, Inc. All rights reserved. 21
1200+ Clients, 2000+ Projects, 17+ Years
©2018 Senturus, Inc. All rights reserved. 22
Upcoming Events
©2018 Senturus, Inc. All rights reserved. 23
www.senturus.com/events
http://www.senturus.com/senturus-resources/
Visit Our Free Resource Library and Blog
©2018 Senturus, Inc. All rights reserved. 24
Thank You!
www.senturus.com
info@senturus.com
888 601 6010
Copyright 2018 by Senturus, Inc.
This entire presentation is copyrighted and may not be
reused or distributed without the written consent of
Senturus, Inc.
25©2018 Senturus, Inc. All rights reserved.

More Related Content

Similar to How to Create a Cognos Analytics Dashboard

Data Modeling Comparison: Tableau, Cognos and Power BI
Data Modeling Comparison: Tableau, Cognos and Power BIData Modeling Comparison: Tableau, Cognos and Power BI
Data Modeling Comparison: Tableau, Cognos and Power BI
Senturus
 
Questions Log: Tips for Intermediate Cognos Report Studio Authors
Questions Log: Tips for Intermediate Cognos Report Studio AuthorsQuestions Log: Tips for Intermediate Cognos Report Studio Authors
Questions Log: Tips for Intermediate Cognos Report Studio Authors
Senturus
 
Using Cognos as a Data Source for Tableau: Demo & Live Case Study with Ixia
Using Cognos as a Data Source for Tableau: Demo & Live Case Study with IxiaUsing Cognos as a Data Source for Tableau: Demo & Live Case Study with Ixia
Using Cognos as a Data Source for Tableau: Demo & Live Case Study with Ixia
Senturus
 
Transitioning to Cognos Workspace Advanced: Migrating from Query & Analysis S...
Transitioning to Cognos Workspace Advanced: Migrating from Query & Analysis S...Transitioning to Cognos Workspace Advanced: Migrating from Query & Analysis S...
Transitioning to Cognos Workspace Advanced: Migrating from Query & Analysis S...
Senturus
 
IBM Cognos Report Studio Version 10 Tips and Tricks – Webinar Q & A
IBM Cognos Report Studio Version 10 Tips and Tricks – Webinar Q & AIBM Cognos Report Studio Version 10 Tips and Tricks – Webinar Q & A
IBM Cognos Report Studio Version 10 Tips and Tricks – Webinar Q & A
Senturus
 
Cognos 11.1.6 New Features Demo with IBM Offering Manager
Cognos 11.1.6 New Features Demo with IBM Offering ManagerCognos 11.1.6 New Features Demo with IBM Offering Manager
Cognos 11.1.6 New Features Demo with IBM Offering Manager
Senturus
 
Connect Power BI & Tableau to Cognos Data
Connect Power BI & Tableau to Cognos DataConnect Power BI & Tableau to Cognos Data
Connect Power BI & Tableau to Cognos Data
Senturus
 
What’s New in Cognos Analytics 11.1.4
What’s New in Cognos Analytics 11.1.4What’s New in Cognos Analytics 11.1.4
What’s New in Cognos Analytics 11.1.4
Senturus
 
Tableau: 6 Ways to Publish & Share Dashboards
Tableau: 6 Ways to Publish & Share DashboardsTableau: 6 Ways to Publish & Share Dashboards
Tableau: 6 Ways to Publish & Share Dashboards
Senturus
 
Report Development Revolution with Cognos Analytics 11.1
Report Development Revolution with Cognos Analytics 11.1Report Development Revolution with Cognos Analytics 11.1
Report Development Revolution with Cognos Analytics 11.1
Senturus
 
Using Cognos Analytics Explorations
Using Cognos Analytics ExplorationsUsing Cognos Analytics Explorations
Using Cognos Analytics Explorations
Senturus
 
What's New in Cognos Analytics 11.0.5
What's New in Cognos Analytics 11.0.5What's New in Cognos Analytics 11.0.5
What's New in Cognos Analytics 11.0.5
Senturus
 
Questions Log: Transitioning to Cognos Workspace Advanced
Questions Log: Transitioning to Cognos Workspace AdvancedQuestions Log: Transitioning to Cognos Workspace Advanced
Questions Log: Transitioning to Cognos Workspace Advanced
Senturus
 
Questions Log: Installing Cognos BI 10.2.2
Questions Log: Installing Cognos BI 10.2.2Questions Log: Installing Cognos BI 10.2.2
Questions Log: Installing Cognos BI 10.2.2
Senturus
 
Making Tableau Dashboards Shareable
Making Tableau Dashboards ShareableMaking Tableau Dashboards Shareable
Making Tableau Dashboards Shareable
Senturus
 
Our Favorite Admin Features in Cognos Analytics 11.1
Our Favorite Admin Features in Cognos Analytics 11.1Our Favorite Admin Features in Cognos Analytics 11.1
Our Favorite Admin Features in Cognos Analytics 11.1
Senturus
 
Advanced Analytics in Tableau: Use the Force!, Built-In Functions and 3rd Par...
Advanced Analytics in Tableau: Use the Force!, Built-In Functions and 3rd Par...Advanced Analytics in Tableau: Use the Force!, Built-In Functions and 3rd Par...
Advanced Analytics in Tableau: Use the Force!, Built-In Functions and 3rd Par...
Senturus
 
Accelerate Report Migrations from Cognos Power BI & Tableau
Accelerate Report Migrations from Cognos Power BI & TableauAccelerate Report Migrations from Cognos Power BI & Tableau
Accelerate Report Migrations from Cognos Power BI & Tableau
Senturus
 
Preparing for Your Cognos Analytics Upgrade April 2017 Webinar - QueBIT Consu...
Preparing for Your Cognos Analytics Upgrade April 2017 Webinar - QueBIT Consu...Preparing for Your Cognos Analytics Upgrade April 2017 Webinar - QueBIT Consu...
Preparing for Your Cognos Analytics Upgrade April 2017 Webinar - QueBIT Consu...
QueBIT Consulting
 
Eladio Abquina on FOSS TOOL for Mining Big Data;OCC PORTAL Dashboard Story
Eladio Abquina on FOSS TOOL for Mining Big Data;OCC PORTAL Dashboard StoryEladio Abquina on FOSS TOOL for Mining Big Data;OCC PORTAL Dashboard Story
Eladio Abquina on FOSS TOOL for Mining Big Data;OCC PORTAL Dashboard Story
CP-Union
 

Similar to How to Create a Cognos Analytics Dashboard (20)

Data Modeling Comparison: Tableau, Cognos and Power BI
Data Modeling Comparison: Tableau, Cognos and Power BIData Modeling Comparison: Tableau, Cognos and Power BI
Data Modeling Comparison: Tableau, Cognos and Power BI
 
Questions Log: Tips for Intermediate Cognos Report Studio Authors
Questions Log: Tips for Intermediate Cognos Report Studio AuthorsQuestions Log: Tips for Intermediate Cognos Report Studio Authors
Questions Log: Tips for Intermediate Cognos Report Studio Authors
 
Using Cognos as a Data Source for Tableau: Demo & Live Case Study with Ixia
Using Cognos as a Data Source for Tableau: Demo & Live Case Study with IxiaUsing Cognos as a Data Source for Tableau: Demo & Live Case Study with Ixia
Using Cognos as a Data Source for Tableau: Demo & Live Case Study with Ixia
 
Transitioning to Cognos Workspace Advanced: Migrating from Query & Analysis S...
Transitioning to Cognos Workspace Advanced: Migrating from Query & Analysis S...Transitioning to Cognos Workspace Advanced: Migrating from Query & Analysis S...
Transitioning to Cognos Workspace Advanced: Migrating from Query & Analysis S...
 
IBM Cognos Report Studio Version 10 Tips and Tricks – Webinar Q & A
IBM Cognos Report Studio Version 10 Tips and Tricks – Webinar Q & AIBM Cognos Report Studio Version 10 Tips and Tricks – Webinar Q & A
IBM Cognos Report Studio Version 10 Tips and Tricks – Webinar Q & A
 
Cognos 11.1.6 New Features Demo with IBM Offering Manager
Cognos 11.1.6 New Features Demo with IBM Offering ManagerCognos 11.1.6 New Features Demo with IBM Offering Manager
Cognos 11.1.6 New Features Demo with IBM Offering Manager
 
Connect Power BI & Tableau to Cognos Data
Connect Power BI & Tableau to Cognos DataConnect Power BI & Tableau to Cognos Data
Connect Power BI & Tableau to Cognos Data
 
What’s New in Cognos Analytics 11.1.4
What’s New in Cognos Analytics 11.1.4What’s New in Cognos Analytics 11.1.4
What’s New in Cognos Analytics 11.1.4
 
Tableau: 6 Ways to Publish & Share Dashboards
Tableau: 6 Ways to Publish & Share DashboardsTableau: 6 Ways to Publish & Share Dashboards
Tableau: 6 Ways to Publish & Share Dashboards
 
Report Development Revolution with Cognos Analytics 11.1
Report Development Revolution with Cognos Analytics 11.1Report Development Revolution with Cognos Analytics 11.1
Report Development Revolution with Cognos Analytics 11.1
 
Using Cognos Analytics Explorations
Using Cognos Analytics ExplorationsUsing Cognos Analytics Explorations
Using Cognos Analytics Explorations
 
What's New in Cognos Analytics 11.0.5
What's New in Cognos Analytics 11.0.5What's New in Cognos Analytics 11.0.5
What's New in Cognos Analytics 11.0.5
 
Questions Log: Transitioning to Cognos Workspace Advanced
Questions Log: Transitioning to Cognos Workspace AdvancedQuestions Log: Transitioning to Cognos Workspace Advanced
Questions Log: Transitioning to Cognos Workspace Advanced
 
Questions Log: Installing Cognos BI 10.2.2
Questions Log: Installing Cognos BI 10.2.2Questions Log: Installing Cognos BI 10.2.2
Questions Log: Installing Cognos BI 10.2.2
 
Making Tableau Dashboards Shareable
Making Tableau Dashboards ShareableMaking Tableau Dashboards Shareable
Making Tableau Dashboards Shareable
 
Our Favorite Admin Features in Cognos Analytics 11.1
Our Favorite Admin Features in Cognos Analytics 11.1Our Favorite Admin Features in Cognos Analytics 11.1
Our Favorite Admin Features in Cognos Analytics 11.1
 
Advanced Analytics in Tableau: Use the Force!, Built-In Functions and 3rd Par...
Advanced Analytics in Tableau: Use the Force!, Built-In Functions and 3rd Par...Advanced Analytics in Tableau: Use the Force!, Built-In Functions and 3rd Par...
Advanced Analytics in Tableau: Use the Force!, Built-In Functions and 3rd Par...
 
Accelerate Report Migrations from Cognos Power BI & Tableau
Accelerate Report Migrations from Cognos Power BI & TableauAccelerate Report Migrations from Cognos Power BI & Tableau
Accelerate Report Migrations from Cognos Power BI & Tableau
 
Preparing for Your Cognos Analytics Upgrade April 2017 Webinar - QueBIT Consu...
Preparing for Your Cognos Analytics Upgrade April 2017 Webinar - QueBIT Consu...Preparing for Your Cognos Analytics Upgrade April 2017 Webinar - QueBIT Consu...
Preparing for Your Cognos Analytics Upgrade April 2017 Webinar - QueBIT Consu...
 
Eladio Abquina on FOSS TOOL for Mining Big Data;OCC PORTAL Dashboard Story
Eladio Abquina on FOSS TOOL for Mining Big Data;OCC PORTAL Dashboard StoryEladio Abquina on FOSS TOOL for Mining Big Data;OCC PORTAL Dashboard Story
Eladio Abquina on FOSS TOOL for Mining Big Data;OCC PORTAL Dashboard Story
 

More from Senturus

Power BI Gateway: Understanding, Installing, Configuring
Power BI Gateway: Understanding, Installing, ConfiguringPower BI Gateway: Understanding, Installing, Configuring
Power BI Gateway: Understanding, Installing, Configuring
Senturus
 
Cognos Performance Tuning Tips & Tricks
Cognos Performance Tuning Tips & TricksCognos Performance Tuning Tips & Tricks
Cognos Performance Tuning Tips & Tricks
Senturus
 
Power Automate for Power BI: Getting Started
Power Automate for Power BI: Getting StartedPower Automate for Power BI: Getting Started
Power Automate for Power BI: Getting Started
Senturus
 
Collaborative BI: 3 Ways to Use Cognos with Power BI & Tableau
Collaborative BI:  3 Ways to Use Cognos with Power BI & TableauCollaborative BI:  3 Ways to Use Cognos with Power BI & Tableau
Collaborative BI: 3 Ways to Use Cognos with Power BI & Tableau
Senturus
 
Tips for Installing Cognos Analytics 11.2.1x
Tips for Installing Cognos Analytics 11.2.1xTips for Installing Cognos Analytics 11.2.1x
Tips for Installing Cognos Analytics 11.2.1x
Senturus
 
How to Prepare for a BI Migration
How to Prepare for a BI MigrationHow to Prepare for a BI Migration
How to Prepare for a BI Migration
Senturus
 
4 Common Analytics Reporting Errors to Avoid
4 Common Analytics Reporting Errors to Avoid4 Common Analytics Reporting Errors to Avoid
4 Common Analytics Reporting Errors to Avoid
Senturus
 
Extending Power BI Functionality with R
Extending Power BI Functionality with RExtending Power BI Functionality with R
Extending Power BI Functionality with R
Senturus
 
Take Control of Your Cloud
Take Control of Your CloudTake Control of Your Cloud
Take Control of Your Cloud
Senturus
 
Using Python with Power BI
Using Python with Power BIUsing Python with Power BI
Using Python with Power BI
Senturus
 
User-Friendly Power BI Report Nav
User-Friendly Power BI Report NavUser-Friendly Power BI Report Nav
User-Friendly Power BI Report Nav
Senturus
 
Streamline Cognos Migrations & Consolidations
Streamline Cognos Migrations & ConsolidationsStreamline Cognos Migrations & Consolidations
Streamline Cognos Migrations & Consolidations
Senturus
 
What’s New in Cognos 11.2.1
What’s New in Cognos 11.2.1What’s New in Cognos 11.2.1
What’s New in Cognos 11.2.1
Senturus
 
Planning for a Power BI Enterprise Deployment
Planning for a Power BI Enterprise DeploymentPlanning for a Power BI Enterprise Deployment
Planning for a Power BI Enterprise Deployment
Senturus
 
Power BI Report Builder & Paginated Reports
Power BI Report Builder & Paginated Reports Power BI Report Builder & Paginated Reports
Power BI Report Builder & Paginated Reports
Senturus
 
Cognos Analytics 11.2 New Features
Cognos Analytics 11.2 New FeaturesCognos Analytics 11.2 New Features
Cognos Analytics 11.2 New Features
Senturus
 
Azure Synapse vs. Snowflake: The Data Warehouse Dating Game
Azure Synapse vs. Snowflake: The Data Warehouse Dating GameAzure Synapse vs. Snowflake: The Data Warehouse Dating Game
Azure Synapse vs. Snowflake: The Data Warehouse Dating Game
Senturus
 
Secrets of High Performing Report Development Teams
Secrets of High Performing Report Development TeamsSecrets of High Performing Report Development Teams
Secrets of High Performing Report Development Teams
Senturus
 
Power BI: Data Cleansing & Power Query Editor
Power BI: Data Cleansing & Power Query EditorPower BI: Data Cleansing & Power Query Editor
Power BI: Data Cleansing & Power Query Editor
Senturus
 
Cognos Data Module Architectures & Use Cases
Cognos Data Module Architectures & Use CasesCognos Data Module Architectures & Use Cases
Cognos Data Module Architectures & Use Cases
Senturus
 

More from Senturus (20)

Power BI Gateway: Understanding, Installing, Configuring
Power BI Gateway: Understanding, Installing, ConfiguringPower BI Gateway: Understanding, Installing, Configuring
Power BI Gateway: Understanding, Installing, Configuring
 
Cognos Performance Tuning Tips & Tricks
Cognos Performance Tuning Tips & TricksCognos Performance Tuning Tips & Tricks
Cognos Performance Tuning Tips & Tricks
 
Power Automate for Power BI: Getting Started
Power Automate for Power BI: Getting StartedPower Automate for Power BI: Getting Started
Power Automate for Power BI: Getting Started
 
Collaborative BI: 3 Ways to Use Cognos with Power BI & Tableau
Collaborative BI:  3 Ways to Use Cognos with Power BI & TableauCollaborative BI:  3 Ways to Use Cognos with Power BI & Tableau
Collaborative BI: 3 Ways to Use Cognos with Power BI & Tableau
 
Tips for Installing Cognos Analytics 11.2.1x
Tips for Installing Cognos Analytics 11.2.1xTips for Installing Cognos Analytics 11.2.1x
Tips for Installing Cognos Analytics 11.2.1x
 
How to Prepare for a BI Migration
How to Prepare for a BI MigrationHow to Prepare for a BI Migration
How to Prepare for a BI Migration
 
4 Common Analytics Reporting Errors to Avoid
4 Common Analytics Reporting Errors to Avoid4 Common Analytics Reporting Errors to Avoid
4 Common Analytics Reporting Errors to Avoid
 
Extending Power BI Functionality with R
Extending Power BI Functionality with RExtending Power BI Functionality with R
Extending Power BI Functionality with R
 
Take Control of Your Cloud
Take Control of Your CloudTake Control of Your Cloud
Take Control of Your Cloud
 
Using Python with Power BI
Using Python with Power BIUsing Python with Power BI
Using Python with Power BI
 
User-Friendly Power BI Report Nav
User-Friendly Power BI Report NavUser-Friendly Power BI Report Nav
User-Friendly Power BI Report Nav
 
Streamline Cognos Migrations & Consolidations
Streamline Cognos Migrations & ConsolidationsStreamline Cognos Migrations & Consolidations
Streamline Cognos Migrations & Consolidations
 
What’s New in Cognos 11.2.1
What’s New in Cognos 11.2.1What’s New in Cognos 11.2.1
What’s New in Cognos 11.2.1
 
Planning for a Power BI Enterprise Deployment
Planning for a Power BI Enterprise DeploymentPlanning for a Power BI Enterprise Deployment
Planning for a Power BI Enterprise Deployment
 
Power BI Report Builder & Paginated Reports
Power BI Report Builder & Paginated Reports Power BI Report Builder & Paginated Reports
Power BI Report Builder & Paginated Reports
 
Cognos Analytics 11.2 New Features
Cognos Analytics 11.2 New FeaturesCognos Analytics 11.2 New Features
Cognos Analytics 11.2 New Features
 
Azure Synapse vs. Snowflake: The Data Warehouse Dating Game
Azure Synapse vs. Snowflake: The Data Warehouse Dating GameAzure Synapse vs. Snowflake: The Data Warehouse Dating Game
Azure Synapse vs. Snowflake: The Data Warehouse Dating Game
 
Secrets of High Performing Report Development Teams
Secrets of High Performing Report Development TeamsSecrets of High Performing Report Development Teams
Secrets of High Performing Report Development Teams
 
Power BI: Data Cleansing & Power Query Editor
Power BI: Data Cleansing & Power Query EditorPower BI: Data Cleansing & Power Query Editor
Power BI: Data Cleansing & Power Query Editor
 
Cognos Data Module Architectures & Use Cases
Cognos Data Module Architectures & Use CasesCognos Data Module Architectures & Use Cases
Cognos Data Module Architectures & Use Cases
 

Recently uploaded

一比一原版(UofS毕业证书)萨省大学毕业证如何办理
一比一原版(UofS毕业证书)萨省大学毕业证如何办理一比一原版(UofS毕业证书)萨省大学毕业证如何办理
一比一原版(UofS毕业证书)萨省大学毕业证如何办理
v3tuleee
 
Enhanced Enterprise Intelligence with your personal AI Data Copilot.pdf
Enhanced Enterprise Intelligence with your personal AI Data Copilot.pdfEnhanced Enterprise Intelligence with your personal AI Data Copilot.pdf
Enhanced Enterprise Intelligence with your personal AI Data Copilot.pdf
GetInData
 
一比一原版(UIUC毕业证)伊利诺伊大学|厄巴纳-香槟分校毕业证如何办理
一比一原版(UIUC毕业证)伊利诺伊大学|厄巴纳-香槟分校毕业证如何办理一比一原版(UIUC毕业证)伊利诺伊大学|厄巴纳-香槟分校毕业证如何办理
一比一原版(UIUC毕业证)伊利诺伊大学|厄巴纳-香槟分校毕业证如何办理
ahzuo
 
Nanandann Nilekani's ppt On India's .pdf
Nanandann Nilekani's ppt On India's .pdfNanandann Nilekani's ppt On India's .pdf
Nanandann Nilekani's ppt On India's .pdf
eddie19851
 
STATATHON: Unleashing the Power of Statistics in a 48-Hour Knowledge Extravag...
STATATHON: Unleashing the Power of Statistics in a 48-Hour Knowledge Extravag...STATATHON: Unleashing the Power of Statistics in a 48-Hour Knowledge Extravag...
STATATHON: Unleashing the Power of Statistics in a 48-Hour Knowledge Extravag...
sameer shah
 
Unleashing the Power of Data_ Choosing a Trusted Analytics Platform.pdf
Unleashing the Power of Data_ Choosing a Trusted Analytics Platform.pdfUnleashing the Power of Data_ Choosing a Trusted Analytics Platform.pdf
Unleashing the Power of Data_ Choosing a Trusted Analytics Platform.pdf
Enterprise Wired
 
哪里卖(usq毕业证书)南昆士兰大学毕业证研究生文凭证书托福证书原版一模一样
哪里卖(usq毕业证书)南昆士兰大学毕业证研究生文凭证书托福证书原版一模一样哪里卖(usq毕业证书)南昆士兰大学毕业证研究生文凭证书托福证书原版一模一样
哪里卖(usq毕业证书)南昆士兰大学毕业证研究生文凭证书托福证书原版一模一样
axoqas
 
Malana- Gimlet Market Analysis (Portfolio 2)
Malana- Gimlet Market Analysis (Portfolio 2)Malana- Gimlet Market Analysis (Portfolio 2)
Malana- Gimlet Market Analysis (Portfolio 2)
TravisMalana
 
Algorithmic optimizations for Dynamic Levelwise PageRank (from STICD) : SHORT...
Algorithmic optimizations for Dynamic Levelwise PageRank (from STICD) : SHORT...Algorithmic optimizations for Dynamic Levelwise PageRank (from STICD) : SHORT...
Algorithmic optimizations for Dynamic Levelwise PageRank (from STICD) : SHORT...
Subhajit Sahu
 
06-04-2024 - NYC Tech Week - Discussion on Vector Databases, Unstructured Dat...
06-04-2024 - NYC Tech Week - Discussion on Vector Databases, Unstructured Dat...06-04-2024 - NYC Tech Week - Discussion on Vector Databases, Unstructured Dat...
06-04-2024 - NYC Tech Week - Discussion on Vector Databases, Unstructured Dat...
Timothy Spann
 
ViewShift: Hassle-free Dynamic Policy Enforcement for Every Data Lake
ViewShift: Hassle-free Dynamic Policy Enforcement for Every Data LakeViewShift: Hassle-free Dynamic Policy Enforcement for Every Data Lake
ViewShift: Hassle-free Dynamic Policy Enforcement for Every Data Lake
Walaa Eldin Moustafa
 
一比一原版(Dalhousie毕业证书)达尔豪斯大学毕业证如何办理
一比一原版(Dalhousie毕业证书)达尔豪斯大学毕业证如何办理一比一原版(Dalhousie毕业证书)达尔豪斯大学毕业证如何办理
一比一原版(Dalhousie毕业证书)达尔豪斯大学毕业证如何办理
mzpolocfi
 
一比一原版(爱大毕业证书)爱丁堡大学毕业证如何办理
一比一原版(爱大毕业证书)爱丁堡大学毕业证如何办理一比一原版(爱大毕业证书)爱丁堡大学毕业证如何办理
一比一原版(爱大毕业证书)爱丁堡大学毕业证如何办理
g4dpvqap0
 
一比一原版(CBU毕业证)卡普顿大学毕业证如何办理
一比一原版(CBU毕业证)卡普顿大学毕业证如何办理一比一原版(CBU毕业证)卡普顿大学毕业证如何办理
一比一原版(CBU毕业证)卡普顿大学毕业证如何办理
ahzuo
 
一比一原版(Deakin毕业证书)迪肯大学毕业证如何办理
一比一原版(Deakin毕业证书)迪肯大学毕业证如何办理一比一原版(Deakin毕业证书)迪肯大学毕业证如何办理
一比一原版(Deakin毕业证书)迪肯大学毕业证如何办理
oz8q3jxlp
 
06-04-2024 - NYC Tech Week - Discussion on Vector Databases, Unstructured Dat...
06-04-2024 - NYC Tech Week - Discussion on Vector Databases, Unstructured Dat...06-04-2024 - NYC Tech Week - Discussion on Vector Databases, Unstructured Dat...
06-04-2024 - NYC Tech Week - Discussion on Vector Databases, Unstructured Dat...
Timothy Spann
 
Chatty Kathy - UNC Bootcamp Final Project Presentation - Final Version - 5.23...
Chatty Kathy - UNC Bootcamp Final Project Presentation - Final Version - 5.23...Chatty Kathy - UNC Bootcamp Final Project Presentation - Final Version - 5.23...
Chatty Kathy - UNC Bootcamp Final Project Presentation - Final Version - 5.23...
John Andrews
 
Analysis insight about a Flyball dog competition team's performance
Analysis insight about a Flyball dog competition team's performanceAnalysis insight about a Flyball dog competition team's performance
Analysis insight about a Flyball dog competition team's performance
roli9797
 
My burning issue is homelessness K.C.M.O.
My burning issue is homelessness K.C.M.O.My burning issue is homelessness K.C.M.O.
My burning issue is homelessness K.C.M.O.
rwarrenll
 
Global Situational Awareness of A.I. and where its headed
Global Situational Awareness of A.I. and where its headedGlobal Situational Awareness of A.I. and where its headed
Global Situational Awareness of A.I. and where its headed
vikram sood
 

Recently uploaded (20)

一比一原版(UofS毕业证书)萨省大学毕业证如何办理
一比一原版(UofS毕业证书)萨省大学毕业证如何办理一比一原版(UofS毕业证书)萨省大学毕业证如何办理
一比一原版(UofS毕业证书)萨省大学毕业证如何办理
 
Enhanced Enterprise Intelligence with your personal AI Data Copilot.pdf
Enhanced Enterprise Intelligence with your personal AI Data Copilot.pdfEnhanced Enterprise Intelligence with your personal AI Data Copilot.pdf
Enhanced Enterprise Intelligence with your personal AI Data Copilot.pdf
 
一比一原版(UIUC毕业证)伊利诺伊大学|厄巴纳-香槟分校毕业证如何办理
一比一原版(UIUC毕业证)伊利诺伊大学|厄巴纳-香槟分校毕业证如何办理一比一原版(UIUC毕业证)伊利诺伊大学|厄巴纳-香槟分校毕业证如何办理
一比一原版(UIUC毕业证)伊利诺伊大学|厄巴纳-香槟分校毕业证如何办理
 
Nanandann Nilekani's ppt On India's .pdf
Nanandann Nilekani's ppt On India's .pdfNanandann Nilekani's ppt On India's .pdf
Nanandann Nilekani's ppt On India's .pdf
 
STATATHON: Unleashing the Power of Statistics in a 48-Hour Knowledge Extravag...
STATATHON: Unleashing the Power of Statistics in a 48-Hour Knowledge Extravag...STATATHON: Unleashing the Power of Statistics in a 48-Hour Knowledge Extravag...
STATATHON: Unleashing the Power of Statistics in a 48-Hour Knowledge Extravag...
 
Unleashing the Power of Data_ Choosing a Trusted Analytics Platform.pdf
Unleashing the Power of Data_ Choosing a Trusted Analytics Platform.pdfUnleashing the Power of Data_ Choosing a Trusted Analytics Platform.pdf
Unleashing the Power of Data_ Choosing a Trusted Analytics Platform.pdf
 
哪里卖(usq毕业证书)南昆士兰大学毕业证研究生文凭证书托福证书原版一模一样
哪里卖(usq毕业证书)南昆士兰大学毕业证研究生文凭证书托福证书原版一模一样哪里卖(usq毕业证书)南昆士兰大学毕业证研究生文凭证书托福证书原版一模一样
哪里卖(usq毕业证书)南昆士兰大学毕业证研究生文凭证书托福证书原版一模一样
 
Malana- Gimlet Market Analysis (Portfolio 2)
Malana- Gimlet Market Analysis (Portfolio 2)Malana- Gimlet Market Analysis (Portfolio 2)
Malana- Gimlet Market Analysis (Portfolio 2)
 
Algorithmic optimizations for Dynamic Levelwise PageRank (from STICD) : SHORT...
Algorithmic optimizations for Dynamic Levelwise PageRank (from STICD) : SHORT...Algorithmic optimizations for Dynamic Levelwise PageRank (from STICD) : SHORT...
Algorithmic optimizations for Dynamic Levelwise PageRank (from STICD) : SHORT...
 
06-04-2024 - NYC Tech Week - Discussion on Vector Databases, Unstructured Dat...
06-04-2024 - NYC Tech Week - Discussion on Vector Databases, Unstructured Dat...06-04-2024 - NYC Tech Week - Discussion on Vector Databases, Unstructured Dat...
06-04-2024 - NYC Tech Week - Discussion on Vector Databases, Unstructured Dat...
 
ViewShift: Hassle-free Dynamic Policy Enforcement for Every Data Lake
ViewShift: Hassle-free Dynamic Policy Enforcement for Every Data LakeViewShift: Hassle-free Dynamic Policy Enforcement for Every Data Lake
ViewShift: Hassle-free Dynamic Policy Enforcement for Every Data Lake
 
一比一原版(Dalhousie毕业证书)达尔豪斯大学毕业证如何办理
一比一原版(Dalhousie毕业证书)达尔豪斯大学毕业证如何办理一比一原版(Dalhousie毕业证书)达尔豪斯大学毕业证如何办理
一比一原版(Dalhousie毕业证书)达尔豪斯大学毕业证如何办理
 
一比一原版(爱大毕业证书)爱丁堡大学毕业证如何办理
一比一原版(爱大毕业证书)爱丁堡大学毕业证如何办理一比一原版(爱大毕业证书)爱丁堡大学毕业证如何办理
一比一原版(爱大毕业证书)爱丁堡大学毕业证如何办理
 
一比一原版(CBU毕业证)卡普顿大学毕业证如何办理
一比一原版(CBU毕业证)卡普顿大学毕业证如何办理一比一原版(CBU毕业证)卡普顿大学毕业证如何办理
一比一原版(CBU毕业证)卡普顿大学毕业证如何办理
 
一比一原版(Deakin毕业证书)迪肯大学毕业证如何办理
一比一原版(Deakin毕业证书)迪肯大学毕业证如何办理一比一原版(Deakin毕业证书)迪肯大学毕业证如何办理
一比一原版(Deakin毕业证书)迪肯大学毕业证如何办理
 
06-04-2024 - NYC Tech Week - Discussion on Vector Databases, Unstructured Dat...
06-04-2024 - NYC Tech Week - Discussion on Vector Databases, Unstructured Dat...06-04-2024 - NYC Tech Week - Discussion on Vector Databases, Unstructured Dat...
06-04-2024 - NYC Tech Week - Discussion on Vector Databases, Unstructured Dat...
 
Chatty Kathy - UNC Bootcamp Final Project Presentation - Final Version - 5.23...
Chatty Kathy - UNC Bootcamp Final Project Presentation - Final Version - 5.23...Chatty Kathy - UNC Bootcamp Final Project Presentation - Final Version - 5.23...
Chatty Kathy - UNC Bootcamp Final Project Presentation - Final Version - 5.23...
 
Analysis insight about a Flyball dog competition team's performance
Analysis insight about a Flyball dog competition team's performanceAnalysis insight about a Flyball dog competition team's performance
Analysis insight about a Flyball dog competition team's performance
 
My burning issue is homelessness K.C.M.O.
My burning issue is homelessness K.C.M.O.My burning issue is homelessness K.C.M.O.
My burning issue is homelessness K.C.M.O.
 
Global Situational Awareness of A.I. and where its headed
Global Situational Awareness of A.I. and where its headedGlobal Situational Awareness of A.I. and where its headed
Global Situational Awareness of A.I. and where its headed
 

How to Create a Cognos Analytics Dashboard

  • 1. HOW TO CREATE A COGNOS ANALYTICS DASHBOARD Using the New Drill-Down Feature
  • 2. • Introductions • Cognos Analytics dashboard releases overview • Demo – Creating dashboards from a relational source – Add drill through reports to dashboard – Creating dashboards from files • Senturus overview • Additional resources • Q&A Agenda ©2018 Senturus, Inc. All rights reserved. 2
  • 3. ©2018 Senturus, Inc. All rights reserved. Pedro Ining Senior BI Architect Senturus, Inc. Presenters Kay Knowles Account Manager Senturus, Inc. 3
  • 4. Hundreds of Free Resources http://www.senturus.com/resources/ RESOURCE LIBRARY An extensive, free library of past webinars, demonstrations, whitepapers, presentations, helpful hints, and more. ©2018 Senturus, Inc. All rights reserved. 4
  • 5. This slide deck is from the webinar How to Create a Cognos Analytics To view the FREE video recording or download this deck go to: https://www.senturus.com/resources/how-to-create-a- cognos-analytics-dashboard/ Hear the Recording Copyright 2017 Senturus, Inc. All Rights Reserved.
  • 6. Cognos Analytics Dashboard Enhancements 6 R5 – November 2016 • FM packages in dashboards • Mapping and new visualizations R6 – March 2017 • OLAP support in dashboards • Dashboard widget connectivity • Mapping enhancements • Storytelling enhancements R7 – August 2017 • New UI for portal, dashboard and modules • Filter enhancements • Additional visualizations R9 – December 2017 • Latitude/longitude support • Full screen mode R10 – March 2018 • Drill-thru to reports • PDF printing R11 – May 2018 • Custom polygons for mapping • Data caching in dashboards ©2018 Senturus, Inc. All rights reserved.
  • 8. • Review dashboard drill-through concept • Create a relational dashboard – Review relational target report – Connect relational dashboard to relational target report – Connect relational dashboard to an OLAP PowerCube target report Demo Outline 8©2018 Senturus, Inc. All rights reserved.
  • 9. Bring us a dated, labor intensive, high-visibility report (in Excel or other) and one of our senior BI architects will show you what is possible with improved visualizations and self-service capabilities in Cognos Analytics, Tableau or Power BI. During this short engagement we will: • Understand business needs • Conduct a data preparation/architecture review and provide recommendations • Review deployment plans and security requirements • Interpret requirements to optimize BI reporting • Produce sample report or dashboard • Discuss training options Dashboard Art of the Possible ©2018 Senturus, Inc. All rights reserved. 9
  • 10. http://www.senturus.com/training/course-schedule/ TM1, Cognos Analytics & Tableau Training ©2018 Senturus, Inc. All rights reserved. 10
  • 11. Answers to Participant Questions QUESTIONS & ANSWERS
  • 12. Q: Can I set refresh time per visual dashboard? A: Yes, as of release 11.0.4 widgets have a refresh timer property. The delay can be set in seconds, minutes or hours with a minimum of five seconds. Open up a widget’s properties to enable the timer and watch your visualization automatically update based on the latest information. Q: Can the drill-through name be changed on the dashboard. A: The drill-through name is the target report name. You can change the report name to the desired drill-through name. Q: Can I drill through to another dashboard? A: Not on this version. You can only drill-through to a report object. Q&A How to Create a Cognos Analytics Dashboard ©2018 Senturus, Inc. All rights reserved. 12
  • 13. Q: Can I still have full interactive reports in addition to drill through at the same time? A: Yes, the drill target can still be run independently. Q: Can there be customized tooltips for more information on the teams? A: No, not on this version. Q: Is there any way to enlarge the font size within the visualization? A: The fonts scale as the screen becomes larger. There is currently not a method to have the fonts be a specific size. Q&A How to Create a Cognos Analytics Dashboard ©2018 Senturus, Inc. All rights reserved. 13
  • 14. Q: What are the limitations on the navigation path? A: The navigation path must be pre-defined on the data source or data module. Q: Is it possible for me to pick a template and then change it to another (so to add another container)? A: If you select a certain template to begin with you don't have to use the containers. You can size objects any way you want (and add more objects than containers) and not use the template boxes at all. And yes, in the latest version you can change to another template after you pick an initial one. This is only available on tabbed templates. In edit mode click on the tab and you will see an option to select a different template. Q&A How to Create a Cognos Analytics Dashboard ©2018 Senturus, Inc. All rights reserved. 14
  • 15. Q: How do I export a visualization to PDF? A: When viewing a dashboard, the latest version has a new selection for Export to PDF in the upper right corner. Q: Can I combine two data sources on a single chart/widget? A: No. Q&A How to Create a Cognos Analytics Dashboard ©2018 Senturus, Inc. All rights reserved. 15
  • 16. Q: With the reintroduction of Portal Tabs in 11.0.11, do you have any comments about going back to using them? We moved away from them and I'm wondering if we should go back to using them? A: This is a rather extensive topic, read about Cognos Portal Tabs: Past, Present and Future in our blog post for some guidance. Q: If vizzes on a dashboard use different data sources will their behavior still be linked if the column names are the same? A: No. Q&A How to Create a Cognos Analytics Dashboard ©2018 Senturus, Inc. All rights reserved. 16
  • 17. Q: In dashboards is there a gauge type visualization available? A: Not exactly, the closest would be the radial bar. Q: Can I join filters across two different data sources, i.e filter year? A: This could be done by creating a data module to source the dashboard instead that combines the different data sources. Q: Can we build dependent/cascading filters in the global filters or ‘this tab’ filters? A: No. Q&A How to Create a Cognos Analytics Dashboard ©2018 Senturus, Inc. All rights reserved. 17
  • 18. Q: In dashboards can we still use Framework Manager and cube charts and if so can they be made interactive? A: Dashboards can be sourced from packages and/or data modules. Data modules can be sourced from packages, flat files, data sets (can be sourced from cubes) and direct server connections. Q&A How to Create a Cognos Analytics Dashboard ©2018 Senturus, Inc. All rights reserved. 18
  • 20. Bridging the Gap Between Data & Decision Making Analysis Ready Data DECISIONS & ACTIONS Business Needs Analysis Ready Data ©2018 Senturus, Inc. All rights reserved. 20
  • 21. • Dashboards, Reporting & Visualizations • Data Preparation & Modern Data Warehousing • Self-Service Business Analytics • Big Data & Advanced Analytics • Planning & Forecasting Systems • Proprietary Analytics Connector Software Business Analytics Architects ©2018 Senturus, Inc. All rights reserved. 21
  • 22. 1200+ Clients, 2000+ Projects, 17+ Years ©2018 Senturus, Inc. All rights reserved. 22
  • 23. Upcoming Events ©2018 Senturus, Inc. All rights reserved. 23 www.senturus.com/events
  • 24. http://www.senturus.com/senturus-resources/ Visit Our Free Resource Library and Blog ©2018 Senturus, Inc. All rights reserved. 24
  • 25. Thank You! www.senturus.com info@senturus.com 888 601 6010 Copyright 2018 by Senturus, Inc. This entire presentation is copyrighted and may not be reused or distributed without the written consent of Senturus, Inc. 25©2018 Senturus, Inc. All rights reserved.