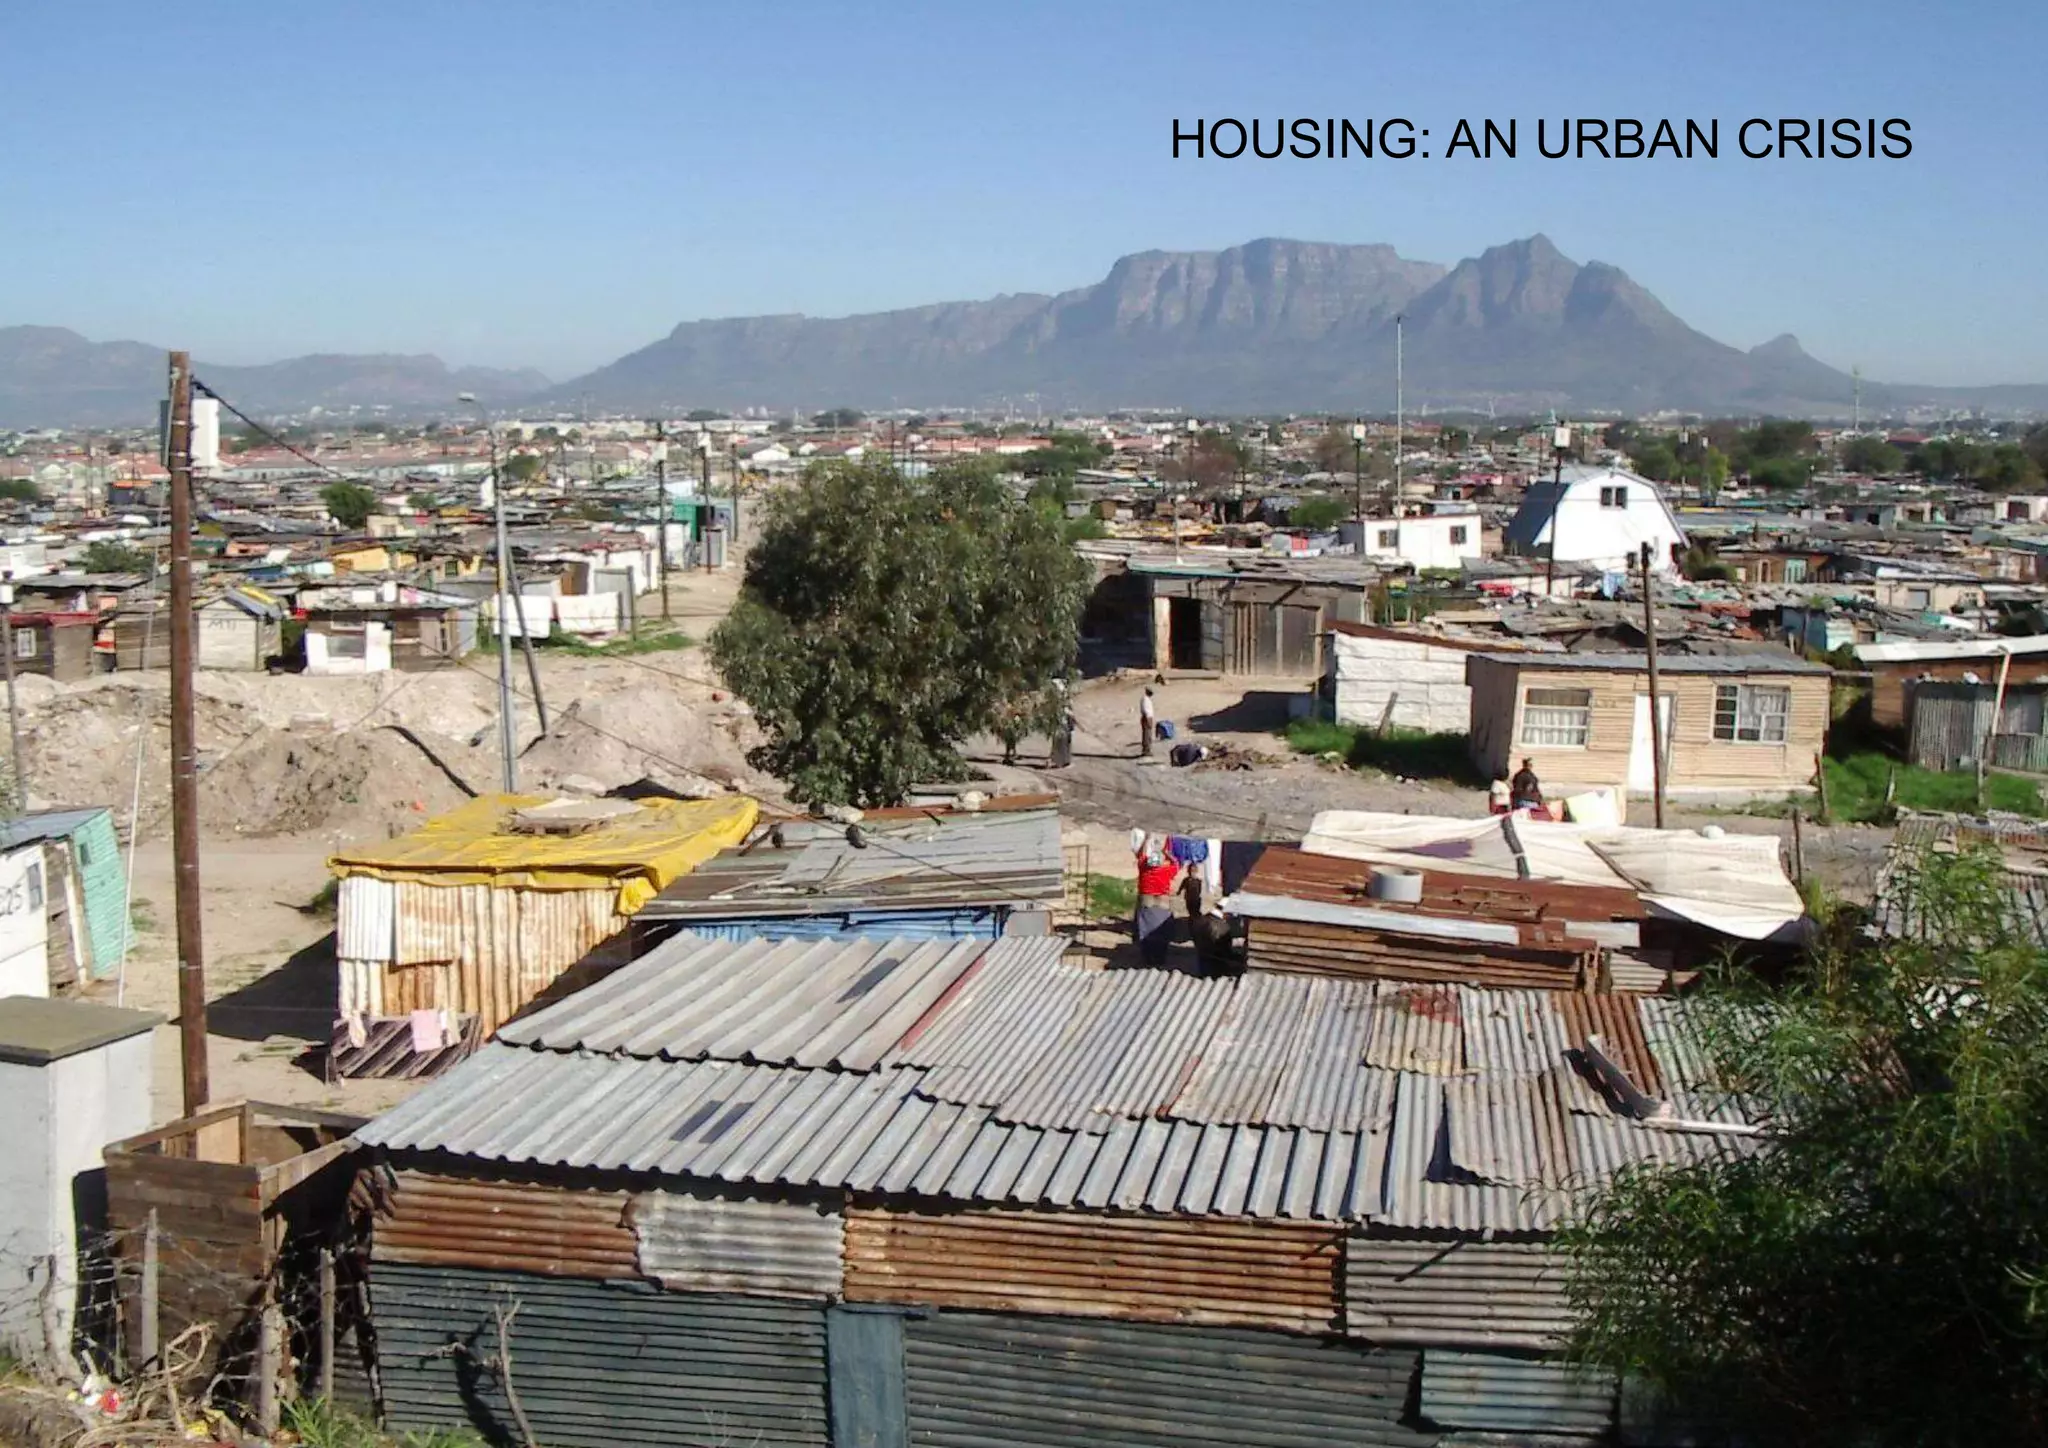
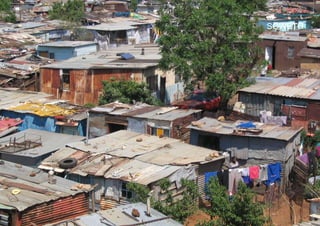
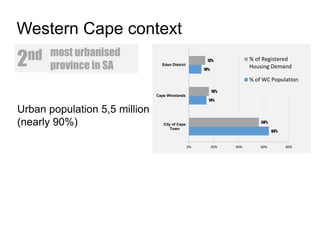
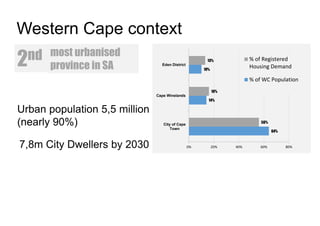
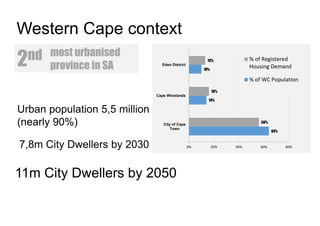
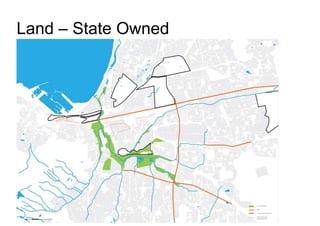
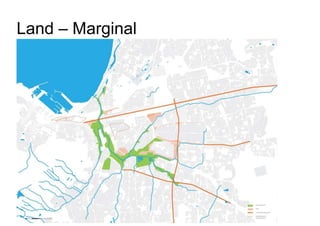
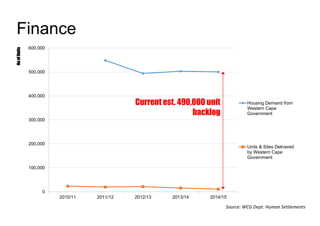
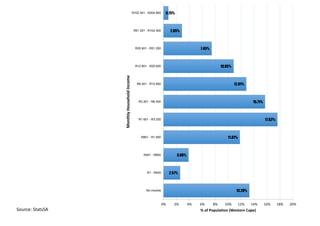
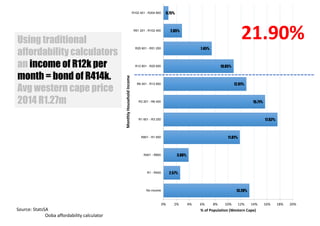
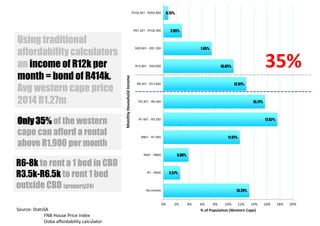
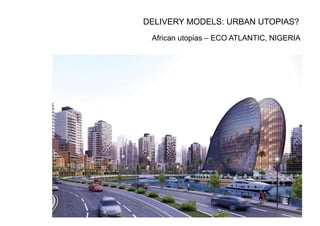
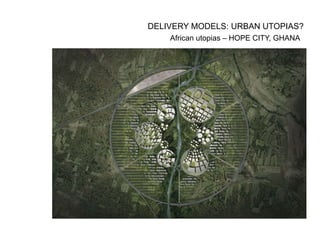
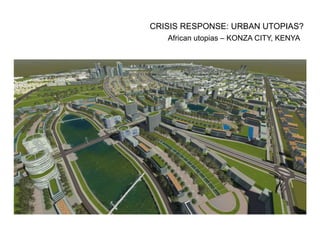
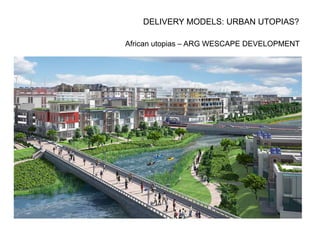
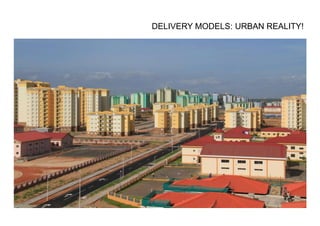
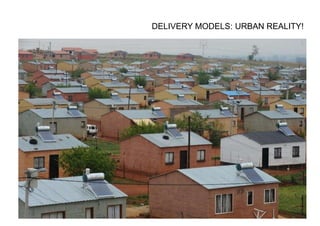
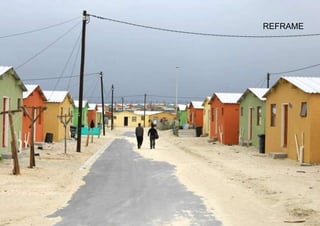
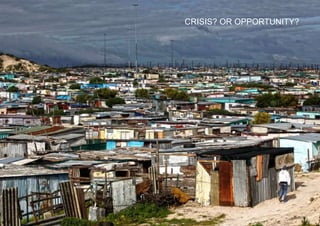
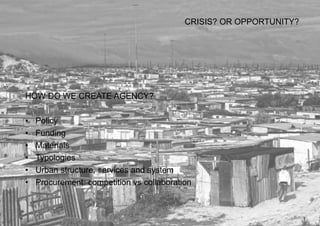
HOUSING: AN URBAN CRISIS
SOWETO
NAIROBI
LAGOS
The GLOBAL Challenge …
Source: McKinsey Institute
the challenge today …
The challenge today:
The GLOBAL Challenge …
Source: McKinsey Institute
the challenge today …
The challenge today:
The GLOBAL Challenge …
Source: McKinsey Institute
the challenge today …
The challenge today:
and projected to 2025 …
Affordability gap
Source: McKinsey Institute
The LOCAL Western Cape Challenge
2nd most urbanised
province in SA
64%
14%
10%
56%
16%
13%
0% 20% 40% 60% 80%
City of Cape
Town
Cape Winelands
Eden District
% of Registered
Housing Demand
% of WC Population
Western Cape context
Urban population 5,5 million
(nearly 90%)
Urban population 5,5 million
(nearly 90%)
The LOCAL Western Cape Challenge
2nd most urbanised
province in SA
64%
14%
10%
56%
16%
13%
0% 20% 40% 60% 80%
City of Cape
Town
Cape Winelands
Eden District
% of Registered
Housing Demand
% of WC Population
Western Cape context
7,8m City Dwellers by 2030
11m City Dwellers by 2050
The LOCAL Western Cape Challenge
2nd most urbanised
province in SA
64%
14%
10%
56%
16%
13%
0% 20% 40% 60% 80%
City of Cape
Town
Cape Winelands
Eden District
% of Registered
Housing Demand
% of WC Population
Western Cape context
7,8m City Dwellers by 2030
Urban population 5,5 million
(nearly 90%)
The LOCAL Western Cape Challenge
Issues
• Land
• Finance
• Delivery Models
The LOCAL Western Cape Challenge
Land – State Owned
The LOCAL Western Cape Challenge
Land – Marginal
Housing Demand vs. Supply
Source: WCG Dept. Human Settlements
0
100,000
200,000
300,000
400,000
500,000
600,000
2010/11 2011/12 2012/13 2013/14 2014/15
NoofUnits
Housing Demand from
Western Cape
Government
Units & Sites Delivered
by Western Cape
Government
Current est. 490,000 unit
backlog
Finance
Affordability
13.28%
2.57%
3.88%
11.81%
17.62%
15.71%
12.81%
10.85%
7.45%
2.85%
0.75%
0% 2% 4% 6% 8% 10% 12% 14% 16% 18% 20%
No income
R1 - R400
R401 - R800
R801 - R1 600
R1 601 - R3 200
R3 201 - R6 400
R6 401 - R12 800
R12 801 - R25 600
R25 601 - R51 200
R51 201 - R102 400
R102 401 - R204 800
% of Population (Western Cape)
MonthlyHouseholdIncome
Source: StatsSA
Affordability
13.28%
2.57%
3.88%
11.81%
17.62%
15.71%
12.81%
10.85%
7.45%
2.85%
0.75%
0% 2% 4% 6% 8% 10% 12% 14% 16% 18% 20%
No income
R1 - R400
R401 - R800
R801 - R1 600
R1 601 - R3 200
R3 201 - R6 400
R6 401 - R12 800
R12 801 - R25 600
R25 601 - R51 200
R51 201 - R102 400
R102 401 - R204 800
% of Population (Western Cape)
MonthlyHouseholdIncome
21.90%Using traditional
affordability calculators
an income of R12k per
month = bond of R414k.
Avg western cape price
2014 R1.27m
Source: StatsSA
Ooba affordability calculator
Affordability
13.28%
2.57%
3.88%
11.81%
17.62%
15.71%
12.81%
10.85%
7.45%
2.85%
0.75%
0% 2% 4% 6% 8% 10% 12% 14% 16% 18% 20%
No income
R1 - R400
R401 - R800
R801 - R1 600
R1 601 - R3 200
R3 201 - R6 400
R6 401 - R12 800
R12 801 - R25 600
R25 601 - R51 200
R51 201 - R102 400
R102 401 - R204 800
% of Population (Western Cape)
MonthlyHouseholdIncome
Only 35% of the western
cape can afford a rental
above R1,900 per month
R6-8k to rent a 1 bed in CBD
R3.5k-R6.5k to rent 1 bed
outside CBD (property24)
Using traditional
affordability calculators
an income of R12k per
month = bond of R414k.
Avg western cape price
2014 R1.27m
35%
Source: StatsSA
FNB House Price Index
Ooba affordability calculator
African utopias – ECO ATLANTIC, NIGERIA
DELIVERY MODELS: URBAN UTOPIAS?
African utopias – HOPE CITY, GHANA
DELIVERY MODELS: URBAN UTOPIAS?
African utopias – KONZA CITY, KENYA
CRISIS RESPONSE: URBAN UTOPIAS?
African utopias – ARG WESCAPE DEVELOPMENT
DELIVERY MODELS: URBAN UTOPIAS?
DELIVERY MODELS: URBAN REALITY!
REFRAME
DEFINITION
“There exists a specific aspect of the housing issue that is intimately
bound up with the problem of the city, its way of life, its physical form and
its image – that is with its structure.”
Rossi, A. 1982. The Architecture of the City
URBAN HOUSING | PUBLIC REALM
REDEFINING HOUSING:
• is the fundamental building block of cities
• plays a dual role – facilitating private life, shaping public life
• a is through shelter & privacy
• b is through shaping public space
• Structure of public space is a function of / and shapes the structure of
our communities
URBAN HOUSING | PUBLIC REALM
MEASURING QUALITY:
1. density & connectivity (urban efficiency)
2. relationship with public realm (spatial quality)
3. liveability (social quality)
4. environmental impact (urban resilience)
URBAN HOUSING | PUBLIC REALM
MEASURING QUALITY:
1. density & connectivity (urban efficiency)
2. relationship with public realm (spatial quality)
3. liveability (social quality)
4. environmental impact (urban resilience)
WCG’s Better Living Model?
CRISIS? OR OPPORTUNITY?
HOW DO WE CREATE AGENCY?
• Policy
• Funding
• Materials
• Typologies
• Urban structure, services and system
• Procurement: competition vs collaboration

Housing Forum_16 March 2016_Guy Briggs

  • 1.
  • 2.
  • 3.
  • 4.
  • 5.
    The GLOBAL Challenge… Source: McKinsey Institute the challenge today … The challenge today:
  • 6.
    The GLOBAL Challenge… Source: McKinsey Institute the challenge today … The challenge today:
  • 7.
    The GLOBAL Challenge… Source: McKinsey Institute the challenge today … The challenge today: and projected to 2025 …
  • 8.
  • 9.
    The LOCAL WesternCape Challenge 2nd most urbanised province in SA 64% 14% 10% 56% 16% 13% 0% 20% 40% 60% 80% City of Cape Town Cape Winelands Eden District % of Registered Housing Demand % of WC Population Western Cape context Urban population 5,5 million (nearly 90%)
  • 10.
    Urban population 5,5million (nearly 90%) The LOCAL Western Cape Challenge 2nd most urbanised province in SA 64% 14% 10% 56% 16% 13% 0% 20% 40% 60% 80% City of Cape Town Cape Winelands Eden District % of Registered Housing Demand % of WC Population Western Cape context 7,8m City Dwellers by 2030
  • 11.
    11m City Dwellersby 2050 The LOCAL Western Cape Challenge 2nd most urbanised province in SA 64% 14% 10% 56% 16% 13% 0% 20% 40% 60% 80% City of Cape Town Cape Winelands Eden District % of Registered Housing Demand % of WC Population Western Cape context 7,8m City Dwellers by 2030 Urban population 5,5 million (nearly 90%)
  • 12.
    The LOCAL WesternCape Challenge Issues • Land • Finance • Delivery Models
  • 13.
    The LOCAL WesternCape Challenge Land – State Owned
  • 14.
    The LOCAL WesternCape Challenge Land – Marginal
  • 15.
    Housing Demand vs.Supply Source: WCG Dept. Human Settlements 0 100,000 200,000 300,000 400,000 500,000 600,000 2010/11 2011/12 2012/13 2013/14 2014/15 NoofUnits Housing Demand from Western Cape Government Units & Sites Delivered by Western Cape Government Current est. 490,000 unit backlog Finance
  • 16.
    Affordability 13.28% 2.57% 3.88% 11.81% 17.62% 15.71% 12.81% 10.85% 7.45% 2.85% 0.75% 0% 2% 4%6% 8% 10% 12% 14% 16% 18% 20% No income R1 - R400 R401 - R800 R801 - R1 600 R1 601 - R3 200 R3 201 - R6 400 R6 401 - R12 800 R12 801 - R25 600 R25 601 - R51 200 R51 201 - R102 400 R102 401 - R204 800 % of Population (Western Cape) MonthlyHouseholdIncome Source: StatsSA
  • 17.
    Affordability 13.28% 2.57% 3.88% 11.81% 17.62% 15.71% 12.81% 10.85% 7.45% 2.85% 0.75% 0% 2% 4%6% 8% 10% 12% 14% 16% 18% 20% No income R1 - R400 R401 - R800 R801 - R1 600 R1 601 - R3 200 R3 201 - R6 400 R6 401 - R12 800 R12 801 - R25 600 R25 601 - R51 200 R51 201 - R102 400 R102 401 - R204 800 % of Population (Western Cape) MonthlyHouseholdIncome 21.90%Using traditional affordability calculators an income of R12k per month = bond of R414k. Avg western cape price 2014 R1.27m Source: StatsSA Ooba affordability calculator
  • 18.
    Affordability 13.28% 2.57% 3.88% 11.81% 17.62% 15.71% 12.81% 10.85% 7.45% 2.85% 0.75% 0% 2% 4%6% 8% 10% 12% 14% 16% 18% 20% No income R1 - R400 R401 - R800 R801 - R1 600 R1 601 - R3 200 R3 201 - R6 400 R6 401 - R12 800 R12 801 - R25 600 R25 601 - R51 200 R51 201 - R102 400 R102 401 - R204 800 % of Population (Western Cape) MonthlyHouseholdIncome Only 35% of the western cape can afford a rental above R1,900 per month R6-8k to rent a 1 bed in CBD R3.5k-R6.5k to rent 1 bed outside CBD (property24) Using traditional affordability calculators an income of R12k per month = bond of R414k. Avg western cape price 2014 R1.27m 35% Source: StatsSA FNB House Price Index Ooba affordability calculator
  • 19.
    African utopias –ECO ATLANTIC, NIGERIA DELIVERY MODELS: URBAN UTOPIAS?
  • 20.
    African utopias –HOPE CITY, GHANA DELIVERY MODELS: URBAN UTOPIAS?
  • 21.
    African utopias –KONZA CITY, KENYA CRISIS RESPONSE: URBAN UTOPIAS?
  • 22.
    African utopias –ARG WESCAPE DEVELOPMENT DELIVERY MODELS: URBAN UTOPIAS?
  • 23.
  • 24.
  • 25.
  • 26.
    DEFINITION “There exists aspecific aspect of the housing issue that is intimately bound up with the problem of the city, its way of life, its physical form and its image – that is with its structure.” Rossi, A. 1982. The Architecture of the City
  • 27.
    URBAN HOUSING |PUBLIC REALM REDEFINING HOUSING: • is the fundamental building block of cities • plays a dual role – facilitating private life, shaping public life • a is through shelter & privacy • b is through shaping public space • Structure of public space is a function of / and shapes the structure of our communities
  • 28.
    URBAN HOUSING |PUBLIC REALM MEASURING QUALITY: 1. density & connectivity (urban efficiency) 2. relationship with public realm (spatial quality) 3. liveability (social quality) 4. environmental impact (urban resilience)
  • 29.
    URBAN HOUSING |PUBLIC REALM MEASURING QUALITY: 1. density & connectivity (urban efficiency) 2. relationship with public realm (spatial quality) 3. liveability (social quality) 4. environmental impact (urban resilience) WCG’s Better Living Model?
  • 30.
  • 31.
    CRISIS? OR OPPORTUNITY? HOWDO WE CREATE AGENCY? • Policy • Funding • Materials • Typologies • Urban structure, services and system • Procurement: competition vs collaboration

Editor's Notes

  • #2 Some shacklands are better
  • #6 96 million households financially overstretched and by 2025 106m ADDITIONAL low income households will face affordability housing challenge. But this issue is not just about the number of Houses … some 235m urban households currently live in substandard housing.
  • #7 96 million households financially overstretched and by 2025 106m ADDITIONAL low income households will face affordability housing challenge. But this issue is not just about the number of Houses … some 235m urban households currently live in substandard housing.
  • #8 96 million households financially overstretched and by 2025 106m ADDITIONAL low income households will face affordability housing challenge. But this issue is not just about the number of Houses … some 235m urban households currently live in substandard housing.
  • #9 Interesting in looking to the global stage, both High middle and Low income countries will face affordability Gaps. Cape Town not mentioned but at a population of 4million we looking at a possible
  • #10 90% of population comes from 3 urban & semi-urban districts (5,5 million of WC population 6,1 million, CT population 3,75 million) 85% of registered housing demand comes from those three districts City Dwellers to increase to 7.8m by 2030 (42% increase; SA pop 63 – 68m, WC pop 8,8m – International Futures) Further 3,2 million by 2050 (SA pop 78 – 88 million, WC pop 12,2m) POPULATION FUTURES: REVISITING SOUTH AFRICA’S NATIONAL DEVELOPMENT PLAN 2030, October 2013, International Futures @ Uni Denver
  • #11 90% of population comes from 3 urban & semi-urban districts (5,5 million of WC population 6,1 million, CT population 3,75 million) 85% of registered housing demand comes from those three districts City Dwellers to increase to 7.8m by 2030 (42% increase; SA pop 63 – 68m, WC pop 8,8m – International Futures) Further 3,2 million by 2050 (SA pop 78 – 88 million, WC pop 12,2m) POPULATION FUTURES: REVISITING SOUTH AFRICA’S NATIONAL DEVELOPMENT PLAN 2030, October 2013, International Futures @ Uni Denver
  • #12 90% of population comes from 3 urban & semi-urban districts (5,5 million of WC population 6,1 million, CT population 3,75 million) 85% of registered housing demand comes from those three districts City Dwellers to increase to 7.8m by 2030 (42% increase; SA pop 63 – 68m, WC pop 8,8m – International Futures) Further 3,2 million by 2050 (SA pop 78 – 88 million, WC pop 12,2m) POPULATION FUTURES: REVISITING SOUTH AFRICA’S NATIONAL DEVELOPMENT PLAN 2030, October 2013, International Futures @ Uni Denver
  • #13 90% of population comes from 3 urban & semi-urban districts (5,5 million of WC population 6,1 million, CT population 3,75 million) 85% of registered housing demand comes from those three districts City Dwellers to increase to 7.8m by 2030 (42% increase; SA pop 63 – 68m, WC pop 8,8m – International Futures) Further 3,2 million by 2050 (SA pop 78 – 88 million, WC pop 12,2m) POPULATION FUTURES: REVISITING SOUTH AFRICA’S NATIONAL DEVELOPMENT PLAN 2030, October 2013, International Futures @ Uni Denver
  • #14 90% of population comes from 3 urban & semi-urban districts (5,5 million of WC population 6,1 million, CT population 3,75 million) 85% of registered housing demand comes from those three districts City Dwellers to increase to 7.8m by 2030 (42% increase; SA pop 63 – 68m, WC pop 8,8m – International Futures) Further 3,2 million by 2050 (SA pop 78 – 88 million, WC pop 12,2m) POPULATION FUTURES: REVISITING SOUTH AFRICA’S NATIONAL DEVELOPMENT PLAN 2030, October 2013, International Futures @ Uni Denver
  • #15 90% of population comes from 3 urban & semi-urban districts (5,5 million of WC population 6,1 million, CT population 3,75 million) 85% of registered housing demand comes from those three districts City Dwellers to increase to 7.8m by 2030 (42% increase; SA pop 63 – 68m, WC pop 8,8m – International Futures) Further 3,2 million by 2050 (SA pop 78 – 88 million, WC pop 12,2m) POPULATION FUTURES: REVISITING SOUTH AFRICA’S NATIONAL DEVELOPMENT PLAN 2030, October 2013, International Futures @ Uni Denver
  • #17 The context of Human settlements
  • #18 FNB Also recorded the fact that only 12% of buyers in 2014 were first time home buyers.. Bond calc assumes Gross monthly salary of 12k net of 9k and expenses of R4k per month. Average price of Western cape house was sourced from FNB
  • #26 For poorer communities – no choice to withdraw: lives are lived in the public realm THEREFORE the quality of the public realm is fundamental to the quality of their lives. HOUSING therefore MUST play a dual function: shelter & privacy + positive public space definition. RDP housing fails to do this …