
Recommended
More Related Content
Viewers also liked
Similar to Housing
Similar to Housing (20)
More from Julie Pal
More from Julie Pal (20)
Housing
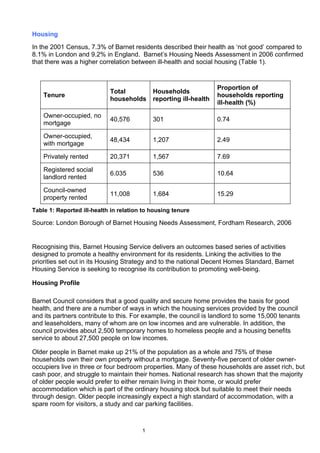
- 1. Housing In the 2001 Census, 7.3% of Barnet residents described their health as ‘not good’ compared to 8.1% in London and 9.2% in England. Barnet’s Housing Needs Assessment in 2006 confirmed that there was a higher correlation between ill-health and social housing (Table 1). Proportion of Total Households Tenure households reporting households reporting ill-health ill-health (%) Owner-occupied, no 40,576 301 0.74 mortgage Owner-occupied, 48,434 1,207 2.49 with mortgage Privately rented 20,371 1,567 7.69 Registered social 6.035 536 10.64 landlord rented Council-owned 11,008 1,684 15.29 property rented Table 1: Reported ill-health in relation to housing tenure Source: London Borough of Barnet Housing Needs Assessment, Fordham Research, 2006 Recognising this, Barnet Housing Service delivers an outcomes based series of activities designed to promote a healthy environment for its residents. Linking the activities to the priorities set out in its Housing Strategy and to the national Decent Homes Standard, Barnet Housing Service is seeking to recognise its contribution to promoting well-being. Housing Profile Barnet Council considers that a good quality and secure home provides the basis for good health, and there are a number of ways in which the housing services provided by the council and its partners contribute to this. For example, the council is landlord to some 15,000 tenants and leaseholders, many of whom are on low incomes and are vulnerable. In addition, the council provides about 2,500 temporary homes to homeless people and a housing benefits service to about 27,500 people on low incomes. Older people in Barnet make up 21% of the population as a whole and 75% of these households own their own property without a mortgage. Seventy-five percent of older owner- occupiers live in three or four bedroom properties. Many of these households are asset rich, but cash poor, and struggle to maintain their homes. National research has shown that the majority of older people would prefer to either remain living in their home, or would prefer accommodation which is part of the ordinary housing stock but suitable to meet their needs through design. Older people increasingly expect a high standard of accommodation, with a spare room for visitors, a study and car parking facilities. 1
- 2. Leasehold sheltered/retirement housing in Barnet is generally provided by the independent sector, where existing properties tend to be in the more affluent areas of the Borough. A number of new schemes are planned and this may be an indication that the supply is not yet sufficient to meet demand. People moving into such schemes are likely to be downsizing from larger properties, and therefore access to funding is not significant issue. What may be significant is the type of support and care that is based on site in the private schemes and a comparison with the type of product on offer for tenants in terms of care and support and where possible the strategy needs to refer to the research being carried out by the independent sector and /or commission Housing Needs Survey Barnet’s 2006 Housing Needs Survey (HNS) found that 5.7% of single pensioner and 8.1% households were living in unsuitable housing. The main reasons cited included: • Cost of maintaining an expensive property • restricted mobility • property falling into major disrepair or unfitness • Fuel poverty The HNS survey data revealed that fewer than 5% of older people living in the borough had difficulty maintaining their home, and they defined this as a problem. However, for 0.48% this was a serious problem. Nevertheless, it is worth noting the number of older person households without central heating. Table 4 indicates the figures collected at the last census. The proportion of such households was just over 7%. Table 1: People aged 65 and over by age (65-74, 75-84, 85 and over) living in a dwelling with no central heating, year 2001 Total 65 and Number of 65 and Percentage of 65 and over over population with over population with no population no central heating central heating (%) People aged 65-74 22,809 1,392 3.06 People aged 75-84 15,626 1,207 2.65 People aged 85 and over 7,059 626 1.38 Total population aged 65 + 45,494 3,225 7.09 Figures may not sum due to rounding. Crown copyright 2007 Figures are taken from Office for National Statistics (ONS) 2001 Census, Standard Tables, Table SO54 Shared / unshared dwelling and central heating and occupancy rating by age. Figures in this table have not been projected forward as the figures would not be reliable. 2
- 3. Supporting Healthier Barnet Homes Gardening Scheme Analysis of Life Styles correlation Health improvement West Hendon healthy sports weeks in August 07 for between poor under 11's Existing Activities Potential health and social Barnet Homes Silver Surfers Scheme HH&S housing Tackle environmental Decent Homes Programme (includes Application of factors underlying legislation assessment on safety within the home) lifetime homes Barnet Homes Youth Group Dancing Research into health and well being standard for new access to health Estate Regeneration Schemes homes and services Improvements to thermal efficiency of council physical activity dwellings Tackling decent homes in the private sector, inc. improvements to thermal efficiency Housing Health and Safety Rating System to tackle poor housing conditions in the private sector HMO registration scheme Providing more suitable temporary accommodation for households with dependant children. Reducing the use of temporary accommodation Working with Housing Associations to provide high quality new affordable homes Health West Hendon Healthy living Day July 07 Targeted Promotion/Education communications Barnet Homes Healthy eating programme campaigns Fire safety campaigns (LPSA concluded March 06) Barnet Homes Health and Safety Promotion (Nov 06) (e) Table 2 Current and potential contributions by Housing Services in Barnet to improving health 3
- 4. Table 5 continued Health improvement Existing Activities Potential Improving access to quality health services Champion the Needs of Older persons housing needs Tenant/Leaseholder Local Communities strategy group (includes consultation framework representation from the PCT) Residents associations Use Planning policy to Consultation with residents on support PCT Community regeneration estates on and Primary Care planned health facilities developments Targeted Client Groups Falls prevention in sheltered Development of Sheltered housing Housing as community resource Exercise classes in sheltered Providing better information on housing local health services to homeless people and new Nottingham University project tenants on water softeners and eczema Identify specific needs of BME communities Reducing unscheduled care Improved planned care Adaptations Reduce unscheduled care Lifeline and Telecare schemes Housing Support Officers Fire safety checks carried out by Barnet Homes Health and housing data • Barnet ranks as a relatively healthy borough with low levels of disability, according to the 2001 Census. 7.3% of people described their health as not good, lower than the London average of 8.1% and England average of 9.2%. This is at least in part due to the fact that Barnet has a comparatively young age structure and relatively higher levels of affluence than the average for England, although there are still areas of deprivation. • The following table, Table 1, shows each of Barnet’s 21 wards, their percentages of social housing and flatted accommodation, along with a series of health related data sets. • Colindale, Burnt Oak, West Hendon and Edgware wards are the most deprived areas in Barnet according to the 2004 Indices of Deprivation. They all have relatively higher levels of social housing as these are the wards where much of the council housing is concentrated within the borough. The table shows that these wards 4
- 5. contain most of the households in the borough that Mosaic has categorised as being deprived: municipal dependency, welfare borderline and twilight subsistence groups. 7,335 households have been categorised under the welfare borderline group, 482 under municipal dependency and 1,111 under twilight subsistence. There seems to be a correlation between levels of social housing, deprivation and related health indicators. • The data on binge drinking does not appear to match the overall pattern as the wards with the highest percentage here are Totteridge, Garden Suburb and High Barnet, i.e.: not the wards with the largest concentration of social housing. • The data on fruit and vegetable consumption shows that Burnt Oak and Underhill have relatively lower fruit/veg consumption than Garden Suburb and Finchley Church End. Colindale and West Hendon wards, however, do not come out in the bottom 5 wards. • There does appear to be some link between wards with high levels of flatted accommodation and higher levels of deprivation and health problems although this is not as clear as with social housing. • Table 2 shows data taken from the 2006 Housing Needs Assessment. It estimates that 4.14% of all households, or 5294 households, suffer from ill-health due to the condition of their home. 15.3% of households living in council rented accommodation suffer from ill-health because of the condition of their home. 8.88% of households living in RSL rented accommodation and 7.69% of households living in private rentals also suffer from ill-health because of the condition of their home. The data also shows that 9.27% of households living in a non-purpose built flat and 6.93% of household living in a purpose-built flat suffers from ill-health because of house condition. 7.36% of households in Hendon suffer from ill-health because of house condition. The assessment also estimates that these households are more likely to contain no older people and to have support needs. Further work is required on reviewing the reasons why people said their house condition was causing their ill- health. It might be that they are under notice of eviction or that the house is difficult to heat or that the home suffers from major disrepair. • Table 3 shows data on support needs households taken from the Housing Needs Assessment. The assessment estimated that there are 18,734 households with support needs and that 73.6% of the households require support because of physical disability and 24.2% because they are frail/elderly. Both of these categories are likely to have an impact on health. 23.9% of support needs households are in unsuitable housing compared to 76.1% of no support needs households live in unsuitable housing. A majority of support needs households contain older people and most requirements relate to needs and adaptations. Some of these households must also suffer from ill-health because of the condition of their home and more work needs to be done to identify and link the data on support needs households and ill- health households. 5
- 6. Health and Housing data (Table 1) Ward % % flat, Municipal Welfare Metro multi- Families on Twilight Smokin Binge Obesity Fruit/veg social maisonett dependency borderline culture benefit subsistence g % * drinking %* consumption housing e or %* apartment No % No % No % No % No % Adults Childre % n% Burnt Oak 38.6 31.3 95 19.7% 557 7.6% 550 8.0% 95 21.4% 172 15.5% 27 10.9 23.3 27.3 48.5 Colindale 36.7 49.5 56 11.6% 1,723 23.5% 1627 23.7% 50 11.3% 89 8.0% 26.8 10 21.7 32.5 56.9 Underhill 26.3 30.4 156 32.4% 323 4.4% 316 4.6% 144 32.5% 165 14.9% 23.6 13.8 20.9 23.9 48.8 East Finchley 22.3 55.4 24 5.0% 1,022 13.9% 996 14.5% 22 5.0% 131 11.8% 23.3 16.8 18.1 30.2 59.9 West Hendon 18.3 40.7 14 2.9% 619 8.4% 528 7.7% 14 3.2% 73 6.6% 23.8 9.5 19 34.2 56.9 Coppetts 15.8 49.5 18 3.7% 499 6.8% 487 7.1% 16 3.6% 18 1.6% 23 15.5 18.9 30.1 59.7 Edgware 15.1 32.7 12 2.5% 630 8.6% 536 7.8% 11 2.5% 29 2.6% 16.7 11.7 17.4 34.8 62.1 Childs Hill 15.1 51.3 4 0.8% 525 7.2% 516 7.5% 4 0.9% 16 1.4% 23.1 16 16 29.6 52.2 Hale 14.9 22.2 20 4.1% 5 0.1% 4 0.1% 20 4.5% 62 5.6% 18.3 11.6 19.6 28.4 52.6 Golders Green 14.4 33.6 11 2.3% 308 4.2% 278 4.0% 10 2.3% 2 0.2% 19.9 15.1 16.9 32.3 59.9 Hendon 11.7 53.2 2 0.4% 383 5.2% 354 5.2% 2 0.5% 30 2.7% 20.1 14.7 17.4 33.4 59.9 Mill Hill 11.3 28.1 12 2.5% 175 2.4% 175 2.5% 12 2.7% 62 5.6% 19 13.4 17.4 30.7 53.1 Woodhouse 11.1 43.6 27 5.6% 123 1.7% 114 1.7% 18 4.1% 7 0.6% 20.5 14.2 18.6 31.7 56.8 East Barnet 10.1 34.4 2 0.4% 0 0.0% 0 0.0% 2 0.5% 0 0.0% 22.4 16.9 19.5 25.9 50.6 Brunswick Park 9.7 17.3 20 4.1% 226 3.1% 226 3.3% 20 4.5% 65 5.9% 21.3 13.8 19.9 29.9 51 West Finchley 8.3 51.2 0 0.0% 1 0.0% 0 0.0% 0 0.0% 30 2.7% 20.7 13.6 17 36.2 60.7 Oakleigh 8 37.5 7 1.5% 71 1.0% 60 0.9% 1 0.2% 70 6.3% 17.4 15 17 35.3 56.9 Totteridge 8 32.1 1 0.2% 56 0.8% 46 0.7% 1 0.2% 35 3.2% 14.8 11.7 15.6 30 52.9 High Barnet 7.3 35.9 0 0.0% 24 0.3% 0 0.0% 0 0.0% 31 2.8% 18.1 15.8 16.9 29.9 55.5 Garden Suburb 5.7 37.2 0 0.0% 10 0.1% 0 0.0% 0 0.0% 16 1.4% 15.9 15.5 13.9 37.1 62.8 Finchley Church 5.6 49.9 1 0.2% 55 0.8% 52 0.8% 1 0.2% 8 0.7% 17.8 14.4 14.8 36.8 62.3 End Totals 482 100.0% 7335 100.0% 6865 100.0% 443 100.0% 1111 100.0% For mosaic, Top 5 wards For fruit/veg Lowest 5 wards smoking consumption Binge drinking Next 5 wards Next 5 wards and Obesity Bottom 5 wards Highest 5 wards Social housing and flat data from 2001 Census 6
- 7. Mosaic categories: Social housing and flat data from 2001 Census 7
- 8. Health and Housing – Table 2 Municipal dependency is a Mosaic group- low income families on large council estates, above average for permanently sick, heavy smokers, alcohol/drug abuse, teenage pregnancy Welfare borderline is a Mosaic group- low incomes, most rely on council housing, above average for singles, BME households, permanently sick, Schizophrenia, mental health, drug/alcohol abuse, teenage pregnancy Metro multi-culture is a Mosaic type within in welfare dependency group- people who rent high density social housing, many from BME communities, above average for anaemia, schizophrenia, abortions Families on benefit is a Mosaic type within municipal dependency group- young families on very low incomes living in extensive areas of low rise social housing, above average for mixed ethnicity heavy drinking, acute respiratory infections, abortions, alcohol/drug abuse, teenage pregnancy Twilight subsistence-is a Mosaic group- well above average for over 65s, well above average for widowed pensioners, social housing, well above average on wide range of hospital emergencies * - Synthetic estimates of healthy lifestyle From Health and Social Care Information Centre behaviours at ward level 200-2002 Households suffering Remaining All Households suffering Remaining All from ill health households in Barnet households from ill health households in Barnet households No of % of No of % of % of No of % of No of % of % of household household household household households household household household household households s s s s s s s s TENURE AGE Owner- 301 5.70% 40,546 33.10% 0.74% No older 4,200 79.30% 82,445 67.30% 4.85% occupied no persons mortgage Owner- 1,207 22.80% 48,307 39.40% 2.44% Both older 406 7.70% 13,397 10.90% 2.94% occupied with and non- mortgage older persons Council 1,684 31.80% 9,324 7.60% 15.30% Older 688 13.00% 26,637 21.70% 2.52% persons only RSL 536 10.10% 5,499 4.50% 8.88% TOTAL 5,294 100.00% 122,479 100.00% 4.14% Private rented 1,567 29.60% 18,804 15.40% 7.69% SUPPORT NEEDS TOTAL 5,294 100.00% 122,479 100.00% 4.14% Support 2,317 43.80% 16,416 13.40% 12.37% needs HOUSE TYPE No support 2,976 56.20% 106,063 86.60% 2.73% needs 8
- 9. Detached 583 11.00% 14,307 11.70% 3.92% TOTAL 5,294 100.00% 122,479 100.00% 4.14% house/ bungalow Semi-detached 607 11.50% 39,610 32.30% 1.51% house/bungalo w Terraced 406 7.70% 23,103 18.90% 1.73% house/bungalo w Purpose-built 2,539 48.00% 34,110 27.80% 6.93% flat/maisonette Other 1,159 21.90% 11,350 9.30% 9.27% flat/maisonette TOTAL 5,294 100.00% 122,479 100.00% 4.14% LOCATION Chipping 1,590 30.00% 34,929 28.50% 4.35% Barnet Finchley & 693 13.10% 49,690 40.60% 1.38% Golders Green Hendon 3,010 56.90% 37,861 30.90% 7.36% TOTAL 5,294 100.00% 122,479 100.00% 4.14% Source: London Borough of Barnet Housing Needs Assessment, Fordham Research, 2006 9
- 10. Health and Housing Data – Table 3 Category Number of % of all % of support needs households households households Support needs households and unsuitable housing Frail elderly 4528 3.5% 24.2% In unsuitable Not in Number of % of total % of those housing unsuitable h'holds h'holds in in housing unsuitable unsuitable housing housing Physical disability 13785 10.8% 73.6% Learning disability 1274 1.0% 6.8% Mental health problem 2504 2.0% 13.4% Severe sensory disability 927 0.7% 4.9% Support needs 3,760 14,974 18,734 20.1% 23.9% Other 854 0.7% 4.6% No support needs 11,959 97,081 109,040 11.0% 76.1% TOTAL 15,719 112,055 127,774 12.3% 100.0% Requirements of support needs households Requirements of support needs households No of households Support needs households and age Level access shower unit 3,086 Support No Number of % of total % of those needs support h'holds h'holds in in needs unsuitable unsuitable housing housing Lift/stair lift 2,457 Extra handrails 2,230 Car parking space near to front door 2,034 Downstairs WC 1,923 No older people 5,820 80,825 86,645 6.70% 31.1% Single-level accommodation 1,884 Both older & non 2,839 10,964 13,803 20.60% 15.2% older people Other alterations/adaptations 1,828 10
- 11. Emergency alarm 1,734 Older people only 10,075 17,250 27,325 36.90% 53.8% Wheelchair access 1,342 TOTAL 18,734 109,039 127,773 14.70% 100.0% More support services to maintain home 1,225 Move to alternative housing with specialist care/support 708 Low level kitchen units, sink or lever taps 622 Low level light switches or raised power points 473 11
- 12. 12