This document is Philip Hofmeyer's doctoral thesis submitted to the University of Maine in 2008. It examines the ecology and silviculture of northern white-cedar in Maine. The thesis contains three chapters: 1) A literature review synthesizing northern white-cedar research findings across its northeastern North American range; 2) An analysis of the influence of soil site class on northern white-cedar growth and decay patterns using field data from 60 sites in Maine; and 3) Development of models to predict northern white-cedar leaf area and stemwood growth efficiency.


![ix
LIST OF FIGURES
Figure 1.1 Distribution of northern white-cedar………………………..…………….3
Figure 2.1 Study site locations throughout central and northern Maine………..…...20
Figure 2.2 Basal area (BA) growth as a function of sapwood area (SA) by
species……………………………………………………………………28
Figure 2.3 Proportion of sample tree basal area decayed by site class in
northern white-cedar, balsam fir, and red spruce………………………..30
Figure 3.1 Site locations of the 25 destructively sampled northern white-
cedar trees………………………………………………………………..46
Figure 3.2 Observed and predicted branch leaf area as a function of branch
diameter (A) and relative distance of the branch into the crown
(B) with model [2a]……………………………………………………...57
Figure 3.3 Branch leaf area (A) and foliage mass (B) as a function of relative
distance into the crown and branch diameter as predicted by
model [2a]………………………………………………………………..57
Figure 3.4 Projected leaf area and crown foliage mass values calculated by
branch summation for 25 stem-analyzed cedar trees and estimated
from their respective tree core data with model [BA 4]…………………59
Figure 3.5 Observed stemwood volume analyzed in WinDendro with the
estimated volume from Honer’s (1967) equation with refit
parameter coefficients…………………………………………………...61](https://image.slidesharecdn.com/a6196abb-3f5a-49c5-839d-630298d5700b-160218150905/85/Hofmeyer-2008-Dissertation-final-12-320.jpg)
![x
Figure 3.6 Comparison of monotonic decreasing regression model [4]
relating annual stemwood volume increment to projected leaf area
for 25 stem-analyzed and 256 cored northern white-cedar trees……...…62
Figure 3.7 Growth efficiency as a function of projected leaf area (A) and
crown foliage mass (B) by light exposure class in 296 cored
northern white-cedar trees……………………………….………...…….64
Figure 3.8 Growth efficiency as a function of breast height age……………………68
Figure 4.1 Timberland area (A) and growing stock volume (B) of northern
white-cedar by stand size class in Maine………………………………..75
Figure 4.2 Site locations of the destructively sampled northern white-cedar
stems from Maibec Industries (◊) and the growth efficiency
study (□)…………................................................................................…78
Figure 4.3 Typical pattern of suppression followed by a release and relatively
constant radial growth in the stump height disc (top) and no signs
of a suppressed core at the mid height disc (bottom)……………………83
Figure 4.4 Stem profile of sample tree M 42. Each line represents one year
of height and diameter growth……………….…….……………………84
Figure 4.5 Breast height ring chronologies of four northern white-cedar trees
in Maine…………………..…………………………………………….85
Figure 4.6 Mean annual area and radial increment for Tree LA 6 consistent
with Pressler’s Law……………………………………………………...90
Figure A.1 Ring chronologies of the sample trees selected to quantify site
index…………………………………………………………………....106](https://image.slidesharecdn.com/a6196abb-3f5a-49c5-839d-630298d5700b-160218150905/85/Hofmeyer-2008-Dissertation-final-13-320.jpg)


![7
NWC stands are commonly used by white-tailed deer for overwintering; in
regions with significant snowfall, browse opportunities are often limited to tree shoots.
NWC has been found to be more palatable than several associated species, including
aspen (Populus spp.), jack pine (Pinus banksiana Lamb.) and balsam fir [Abies balsamea
(L.) Mill.] (Ullrey et al. 1964, 1967, 1968). Though deer often lose body mass on a
single-species diet, NWC can support them through harsh winters if there is at least 2 kg
of cedar browse per animal per day (Aldous 1941). In addition to browse opportunities,
deer frequently congregate in deeryards when there is more than 30 cm of snow to benefit
from reduced snow cover and wind, communal trails, more stable, warmer temperatures,
and predator avoidance (Sabine et al. 2001). Many of the challenges faced regarding
managing NWC deeryards are related to the use patterns of deer herds.
Historically, NWC swamps in northern Michigan were multi-storied stands that
had plentiful browse opportunities for deer, but sparse winter cover (Verme 1965). Many
NWC communities in the Lake States today originated after clearcutting in the early
1900s, a time period with relatively low deer populations (Heitzman et al. 1997, 1999).
These even-aged stands offer more protection but less available browse, though deer
populations in the Lake States are much higher than they have been in the past (Heitzman
et al. 1997). An increase in deer populations, coupled with NWC’s palatability, has led to
difficulties regenerating NWC stands in that region.
Multiple studies have documented slow NWC seedling and sapling height growth
rates (e.g. Johnston 1990, Heitzman et al. 1997, Davis et al. 1998). White-tailed deer
have been observed in wintering areas until April, preferentially browsing on NWC (Van
Deelen et al. 1999). Because of this browse preference and slow seedling growth rate, up](https://image.slidesharecdn.com/a6196abb-3f5a-49c5-839d-630298d5700b-160218150905/85/Hofmeyer-2008-Dissertation-final-21-320.jpg)


![16
Chapter 2:
INFLUENCE OF SOIL SITE CLASS ON GROWTH AND DECAY OF
NORTHERN WHITE-CEDAR
2.1 ABSTRACT
Basal area growth of outwardly sound northern white-cedar (Thuja occidentalis
L.) was compared to that of balsam fir [Abies balsamea (L.) Mill.] and red spruce (Picea
rubens Sarg.) on 60 sites throughout northern Maine across site and light exposure class
gradients. Once adjusted for sapwood area, northern white-cedar basal area growth was
not strongly affected by site or light exposure class; growth was similar to that of red
spruce but generally lower than that of balsam fir. Site index did not differ appreciably
among soil drainage classes for red spruce and northern white-cedar, though small
sample size on upland site classes limited analysis. Incidence of central decay was higher
in northern white-cedar than balsam fir, which was higher than red spruce. Incidence of
decay in outwardly sound northern white-cedar and balsam fir was highest on well-
drained mineral soils. Mean proportion of breast height area decayed increased in
outwardly sound northern white-cedar as drainage improved from poorly to well-drained
soils. These data suggest that northern white-cedar on lowland organic and poorly
drained mineral soils in Maine have superior stem soundness, similar basal area growth,
and similar site index relative to upland communities.](https://image.slidesharecdn.com/a6196abb-3f5a-49c5-839d-630298d5700b-160218150905/85/Hofmeyer-2008-Dissertation-final-30-320.jpg)
![17
2.2 INTRODUCTION
Northern white-cedar (Thuja occidentalis L.) is a common tree species in mixed
transitional forests of southeastern Canada and northeastern United States (Johnston
1990). In Maine, it is commonly found in association with balsam fir [Abies balsamea
(L.) Mill.], red spruce (Picea rubens Sarg.), black spruce [Picea mariana (Mill.) B.S.P.],
and eastern larch [Larix laricina (Du Roi) K. Koch]. Northern white-cedar is the third
most abundant conifer in Maine, after balsam fir and red spruce; these species account for
6.3, 21.7, and 12.7 million cubic meters, respectively (McWilliams et al. 2005). Though
northern white-cedar is prevalent on the landscape, it has historically been under
represented in ecology and silviculture research throughout its native range, particularly
in the northeastern United States (Hofmeyer et al. 2007).
Red spruce and balsam fir are commonly associated species in the spruce-fir
forests of Maine. These species occupy similar sites, are both shallow-rooted (though fir
slightly deeper than spruce), very shade tolerant, and can be considered climax species in
that they reproduce under their own shade (Zon 1914, Murphy 1917). The most common
and widespread occurrence of the spruce-fir type occurs on “spruce flats:” relatively
shallow soils extending from swamp sites to lower slopes (Westveld 1931). These soils
are generally moist with perched water tables during the active growing season. Above-
ground growth of spruce and fir is related to site class; growth increases as soil drainage
improves from poorly to well-drained (Williams et al. 1990, Briggs 1994). Little research
has been conducted regarding growth on organic soils because red spruce-balsam fir
forests have less importance on these soil types.](https://image.slidesharecdn.com/a6196abb-3f5a-49c5-839d-630298d5700b-160218150905/85/Hofmeyer-2008-Dissertation-final-31-320.jpg)


![25
and averaged for tree-level values. A no-intercept least-squares general linear model was
used to describe the relationship of basal area growth as a function of sapwood area.
Analysis of covariance (ANCOVA) was used to test differences in basal area growth
among site classes and light exposures for each species at α=0.05. Sapwood area was
used as a covariate in these analyses because of the allometric relationships between
breast height sapwood area and foliage mass or area in coniferous tree species (e.g. Grier
and Waring 1974, Gilmore and Seymour 1996, Maguire et al. 1998). Independent class
variables were species, site, and light exposure; all independent variables were tested for
interactions. Mean separations were analyzed with Tukey’s HSD test.
Tree decay was investigated with two metrics: the proportion of trees with central
decay, and the proportion of basal area that was centrally decayed. Trees were considered
“decayed” if either of the two cores showed evidence of decay (i.e. cells decomposed)
before the pith. Proportion of basal area decayed was quantified as:
[1] Decayed area (m2
) = 00007854.02
2
2
×⎥
⎦
⎤
⎢
⎣
⎡
×
⎭
⎬
⎫
⎩
⎨
⎧
−⎟
⎠
⎞
⎜
⎝
⎛
CL
DBHib
where DBHib is the diameter inside bark (cm) and CL is the core length (cm). Decayed
area was quantified for each core and averaged over both cores to determine the tree
basal area decayed. The mean value from [1] was divided by the inside bark basal area to
determine the proportion of basal area that was decayed. Analysis of variance (ANOVA)
was used to test for differences in the proportion of basal area decayed by site class and
light exposure class for each species at α=0.05.
Tree cores with no evidence of decay were selected for site index analysis. Site
index trees should be dominant or codominant and free from suppression (Avery and](https://image.slidesharecdn.com/a6196abb-3f5a-49c5-839d-630298d5700b-160218150905/85/Hofmeyer-2008-Dissertation-final-39-320.jpg)


![50
Table 3.2. Mean specific leaf area, branch foliage mass, and branch leaf area for the
lower, mid, and top crown sections of 25 northern white-cedar sample trees.
Crown section Min Mean Max SE
Specific Leaf Area (cm2
/g)
Lower 41.62 61.68 79.44 1.86
Mid 41.76 55.59 68.53 1.44
Top 31.81 46.02 68.85 1.94
Branch Foliage Mass (g)
Lower 29.45 230.28 657.02 32.78
Mid 10.80 170.30 559.61 31.90
Top 1.55 100.77 369.17 17.61
Branch Leaf Area (cm2
)
Lower 2041.59 14257.02 42765.61 2187.72
Mid 538.37 9313.18 29656.56 1698.85
Top 55.79 4549.61 17083.46 770.93
diameter, incremental height, and volume analysis. WinStem calculates stem volume
(dm3
) with an additive cone volume function:
[1] cone volume = (R1
2
+R1*R2+R2
2
)*H*π/3
[1a] tree volume = Σ(cone volume/1000)
where R1 is the radius at one end of the cone (mm), R2 is the radius at the other end of the
cone (mm), and H is the height of the cross-sectional disc. Function [1] is calculated for
each 1-m section, and summed for the tree volume.
3.3.3 Statistical analysis
Analysis of variance (ANOVA) was used to test for SLA differences among
crown sections (lower, mid, top), light exposure classes, and site classes (α=0.05). Three](https://image.slidesharecdn.com/a6196abb-3f5a-49c5-839d-630298d5700b-160218150905/85/Hofmeyer-2008-Dissertation-final-64-320.jpg)
![51
regression models were investigated to predict branch leaf area (BLA) and branch foliage
mass (BFM):
[2] LN(y) = b0 + b1D
[2a] y = (b1Db2
) * (RDb4-1
) * (EXP-(b3RDb4
))
[2b] LN(y) = b0 + b1LN(D) + b2LN(RD) + b3RD
where the dependent variable y is either projected leaf area (BLA, cm2
) or branch foliage
mass (BFM, g), D is the branch basal diameter (mm), and RD is the relative distance of
the branch into the crown. RD ranges from 0 to 1; 0 is the crown leader, 1 is the lowest
live branch. The summation of BLA for all branches of each tree is the tree-level
projected leaf area (PLA, m2
). The summation of BFM for all branches is the tree-level
total crown foliage mass (CFM, kg). Models were compared by their generalized r2
(after
Kvalseth 1985), Furnival’s (1961) index of fit (FI), and residual analysis.
Model [2a], a modified Weibull function, has been used to predict leaf area in
white pine (Pinus strobus L.) (R.S. Seymour, unpublished data), balsam fir and red
spruce (Meyer 2005), and Douglas-fir (Pseudotsuga menziesii (Mirb.) Franco) (Maguire
and Bennett 1996). The latter study used a dependent variable of BLA, as opposed to the
square root of BLA used in this study. Model [2b] has been used to determine red spruce
PLA in uneven-aged stands in Maine (Maguire et al. 1998).
A series of linear and non-linear, weighted and unweighted, transformed and
untransformed models were fit to the 25 tree-level PLA and CFM values (Table 3.3).
Many of these models were screened in Meyer (2005) for thinned and unthinned stands
of red spruce and balsam fir. Three main effect weights were screened for each
untransformed model (x-1
, x-2
, x-3
). Model weights were screened to reduce the influence](https://image.slidesharecdn.com/a6196abb-3f5a-49c5-839d-630298d5700b-160218150905/85/Hofmeyer-2008-Dissertation-final-65-320.jpg)

![53
crown; LCRLLB, live crown ratio at the lowest live branch; mLCR, modified live crown
ratio (ratio of CL to distance from leader to breast height) (Valentine et al. 1994); SA,
sapwood area; SABH, sapwood area at breast height; SALLB, sapwood area at the lowest
live branch.
of heteroscedasticity in the error variances. Log bias was determined for each of the log-
transformed models and a correction factor was calculated for each (after Snowdon
1991). Snowdon’s (1991) correction factor is the ratio of the arithmetic mean of the
dependent variable sample to the mean of the back-transformed predicted dependent
variables. Models were compared by their generalized r2
, FI score, and residual analysis
for both dependent variables.
Honer’s (1967) volume equation and parameter estimates were evaluated for
model bias against the observed stem volume from the 25 destructively sampled trees in
this study. The model fit was:
[3] V = DBH2
/ (4.167 + (244.906/H))
where V is the total stem volume inside bark, DBH is the outside bark diameter at breast
height in inches at 4.5 feet off the ground, and H is the total tree height in feet. Model [3]
was refit to the data to generate new parameter coefficients.
Mean annual volume increment (VINC, dm3
) for the two most recent complete
growth years was computed for the stem-analyzed trees in WinStem. Two nonlinear
models were fit to describe the relationship of VINC with respect to PLA and CFM:
[4] VINC = β1 x β2
[4a] VINC = β1
⎟⎟
⎟
⎠
⎞
⎜⎜
⎜
⎝
⎛
⎥
⎥
⎦
⎤
⎢
⎢
⎣
⎡
⎟⎟
⎠
⎞
⎜⎜
⎝
⎛
−
3β
2β
x
-EXP1](https://image.slidesharecdn.com/a6196abb-3f5a-49c5-839d-630298d5700b-160218150905/85/Hofmeyer-2008-Dissertation-final-67-320.jpg)
![54
where VINC is the mean annual volume increment (dm3
) for the 2004 and 2005 growth
years, x is the independent variable PLA (m2
) or CFM (kg), and βi are regression
coefficients. Three weights (x-1
, x-2
, x-3
) were considered for each model.
Growth efficiency (GE) was quantified as VINC per unit leaf area (GEPLA,
dm3
/m2
) or VINC per unit crown foliage mass (GECFM, dm3
/kg). Both relationships
assume that crown attributes did not differ markedly between 2004 and the sampling
date. ANOVA was used to test for differences in GE among light exposure classes, soil
site classes, and presence of central decay. A significance level of α=0.10 was used due
to the low sample size in each categorical variable level.
Stem volume was estimated for the 296 northern white-cedar trees that were cored
(and described in Hofmeyer (2008), Ch.2) with model [3] and refit parameter
coefficients. Diameter outside bark and total height were back-grown two complete years
plus the partial ring that occurred during the season of sampling. Diameter increment was
analyzed in WinDendro and a constant proportion of tree-specific bark thickness to
diameter was assumed to estimate volume. Several regression models were screened to
predict height growth by diameter, height, live crown ratio, light exposure class, and/or
site class from the stem-analyzed stems; all resulted in nonsignificant parameters.
Therefore, the average annual height increment for the top meter of the destructively
sampled stems (0.08 m) was used to back-grow height two years in the cored tree sample.
Volume was estimated for the back-grown cored trees with model [3] with refit
regression coefficients. VINC was determined by subtracting the back-grown volume
from the most recent full year’s volume and dividing by 2 to get annual VINC.](https://image.slidesharecdn.com/a6196abb-3f5a-49c5-839d-630298d5700b-160218150905/85/Hofmeyer-2008-Dissertation-final-68-320.jpg)
![55
PLA and CFM were estimated for 296 cored northern white-cedar trees using
model [BA4]. This model had a low FI, a high r2
, and little bias in the residual analysis
for both dependent variables. Following the same protocol as above, models [4] and [4a]
were fit to describe the relationship between VINC and PLA or CFM. Log-linear VINC
models were screened for inclusion of age and site class into nonlinear models [4] and
[4a]. Stepwise log-linear least-squares regression rejected the inclusion of age (p=0.197)
and indicated that the VINC to PLA relationship was not appreciably affected by site
class (p=0.144). A second degree polynomial (Seymour and Kenefic 2002, Eq. 3) was
screened for influences of age and PLA on GE; both the age and the PLA coefficients did
not differ from 0. GEPLA and GECFM were quantified as the estimated VINC over the
estimated PLA and CFM for each cored tree. ANOVA was used to test for differences in
GE among light exposure classes, soil site classes, and presence of central decay at
α=0.05 using SYSTAT version 12. Models with multiple categorical independent
variables were tested for interactions among variable terms.
3.4 RESULTS
3.4.1 Branch Leaf Area and Foliage Mass
SLA ranged from 31.8 to 79.4 cm2
/g and differed by foliage location within the
crown (p<0.001). SLA was not different among site classes (p=0.465) or LECs (p=0.108)
(Table 3.4). The best-fit BFM and PLA model was [BLA 2] due to its low FI value, high
r2
, and normally distributed residuals (Table 3.5). This model had little bias in predicting
BLA from RD and branch diameter (Figure 3.2). For a given branch diameter, model [2a]
predicts a maximum BLA at 0.75 RD (Figure 3.3). Interestingly, this peak does not](https://image.slidesharecdn.com/a6196abb-3f5a-49c5-839d-630298d5700b-160218150905/85/Hofmeyer-2008-Dissertation-final-69-320.jpg)

![57
Branch basal diameter (cm)
0 2 4 6
Branchleafarea(m2
)
0
1
2
3
4
5
Predicted
Observed
A B
Relative distance into crown
0.0 0.2 0.4 0.6 0.8 1.0
B
Figure 3.2. Observed and predicted branch leaf area as a function of branch diameter (A)
and relative distance of the branch into the crown (B) with model [2a].
0 20 40 60 80
0.0
0.2
0.4
0.6
0.8
1.0
0 40 80 120 160 200
1 cm
2 cm
3 cm
Relativedistanceintocrown
Branch leaf area (cm2
) Branch foliage mass (g)
Top
Base
A B
Figure 3.3. Branch leaf area (A) and foliage mass (B) as a function of relative distance
into the crown and branch diameter as predicted by model [2a].](https://image.slidesharecdn.com/a6196abb-3f5a-49c5-839d-630298d5700b-160218150905/85/Hofmeyer-2008-Dissertation-final-71-320.jpg)
![58
3.4.2 Projected Leaf Area and Crown Foliage Mass
Fit statistics for all PLA and CFM models are presented in Appendix B. The best-
fit PLA and CFM model screened was [BA4], a modified Valentine et al. (1994) function
with basal area outside bark and modified live crown ratio as independent variables
(Table 3.6). Model [BA4] had the lowest FI and highest r2
of the CFM models, though
model [SA3] had the lowest FI of the PLA models. Model [SA3] had a b3 coefficient not
different from zero, limiting its applicability as a predictive model. [BA4] had the least
bias comparing observed PLA and CFM values from the 25 stem-analyzed trees with
values estimated from their respective tree core data (Figure 3.4). The remaining models
had poorer consistency among the two datasets. PLA of the 256 cored trees estimated
with model [BA 4] ranged from 9.11 to 161.17 m2
(mean= 57.91 m2
, SE=1.49) and CFM
ranged from 1.62 to 36.18 kg (mean=12.05 kg, SE=0.34).
Table 3.6. Best-fit area inside bark (AIB), basal area outside bark (BA), crown length
(CL), and sapwood area (SA) model for estimating projected leaf area (PLA) and crown
foliage mass (CFM), ranked by FI values. Refer to Table 3.3 for model forms.
Model Weight FI r2
b0 b1 b2 b3
PLA
SA3 SAbh
-2
12.61 0.747 -17.677* 0.415 2.634* -
BA4 BA-2
12.65 0.797 - 326.540 0.548 0.982
AIB2 AIBllb
-1
13.77 0.705 22.488 900.87 - -
CL1 n/a 14.73 0.665 0.012* 0.895 - -
CFM
BA4 BA-2
2.33 0.849 - 77.688 0.593 1.062
SA3 SAbh
-2
2.47 0.790 -4.924 0.077 0.755 -
AIB2 AIBllb
-1
2.86 0.719 4.364 193.589 - -
CL3 unweighted 3.16 0.715 - 0.130 0.468 -
* denotes a parameter coefficient not different than 0
Note: Furnival (1967) index value for model [CL3] is the rMSE value from the
unweighted model. Generalized r2
values were calculated after Kvalseth (1985).](https://image.slidesharecdn.com/a6196abb-3f5a-49c5-839d-630298d5700b-160218150905/85/Hofmeyer-2008-Dissertation-final-72-320.jpg)
![59
Basal area outside bark (m
2
)
0.00 0.04 0.08 0.12 0.16 0.20
Crownfoliagemass(kg)
0
10
20
Projectedleafarea(m2
)
0
30
60
90
120
Branch sum
Core data
A
B
Figure 3.4. Projected leaf area and crown foliage mass values calculated by branch
summation for 25 stem-analyzed cedar trees and estimated from their respective tree core
data with model [BA 4].](https://image.slidesharecdn.com/a6196abb-3f5a-49c5-839d-630298d5700b-160218150905/85/Hofmeyer-2008-Dissertation-final-73-320.jpg)
![60
3.4.3 Stem Volume
Refitting Honer’s (1967) model to the observed volume data resulted in new
regression coefficients of a1=2.139 and b1=301.634 (Imperial units). The refit model had
a generalized r2
of 0.970 and a residual sum of 6.88. Observed volume of the stem-
analyzed trees had a mean of 0.512 m3
(range of 0.075 to 1.237 m3
) while predicted
volume from the new coefficients had a mean of 0.504 m3
(range of 0.075 to 1.232 m3
).
The refit equation captured stem volume variation across all observed diameters (Figure
3.5). Estimated mean volume for the cored trees was 0.511 m3
(range of 0.053 to 2.511
m3
).
3.4.4 Volume Increment and Growth Efficiency
Mean annual VINC was 8.44 dm3
(range of 3.83 to 15.46 dm3
, SE=0.748) in the
25 stem-analyzed samples and 8.79 dm3
in the 256 cored trees (range of 0.99 to 34.29
dm3
, SE=0.312). Screened VINC models suggest that the relationship between VINC and
PLA/CFM was nearly linear in both the stem-analyzed and cored trees. The β2 coefficient
in [4] was significant for the stem-analyzed trees, but was not different from 1 with the
cored tree data (Table 3.7). [4a] models resulted in β3 coefficients that were not different
from 1 in any screened model, suggesting that the relationship between VINC and
PLA/CFM was not sigmoid. Estimated VINC from stem-analyzed and cored data is quite
similar over the range of PLAs observed in this study (Figure 3.6). Models were weighted
to reduce the influence of heteroscedacity, which resulted in a better fit with higher r2
values and lower FI values.](https://image.slidesharecdn.com/a6196abb-3f5a-49c5-839d-630298d5700b-160218150905/85/Hofmeyer-2008-Dissertation-final-74-320.jpg)

![62
Cored
Cored
Projected leaf area (m2
)
0 30 60 90 120 150 180
Annualstemwoodvolumeincrement(m2
)
0
10
20
30
40
Stem-analyzed
Stem-analyzed
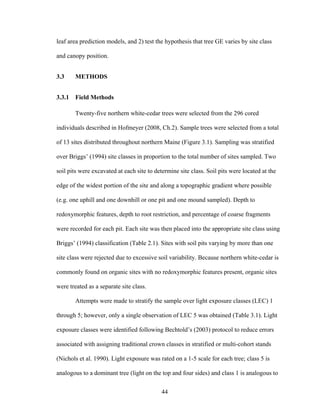
Figure 3.6. Comparison of monotonic decreasing regression model [4] relating annual
stemwood volume increment to projected leaf area for 25 stem-analyzed and 256 cored
northern white-cedar trees.
ANOVA detected no differences in GEPLA and GECFM by site class or light
exposure class in the stem-analyzed trees (Table 3.8). No differences were detected in
GEPLA or GECFM among decayed and sound sample trees (p=0.24 and p=0.13,
respectively). No interaction was observed in the ANOVA model with the decay*site
term (p=0.465). Growth efficiency showed no trend with respect to increasing PLA or
CFM in the cored trees (Figure 3.7). ANOVA detected no differences in GEPLA or
GECFM by site or LEC in the cored trees (Table 3.9). GEPLA and GECFM were not
different among decay classes (presence/absence) (p=0.377 and p=0.283, respectively).](https://image.slidesharecdn.com/a6196abb-3f5a-49c5-839d-630298d5700b-160218150905/85/Hofmeyer-2008-Dissertation-final-76-320.jpg)


![66
Projected leaf area and foliage mass models may have been somewhat imprecise
given the high level of crown variability in the sample trees. Even the best-fit model
accounted for less than 80% of the variation in BLA and BFM. Model [2a] predicted a
peak in leaf area slightly below the midpoint of the crown, though branch leaf area was
relatively constant below 0.4 RD. Meyer (2005) used model [2a] to predict leaf area in
thinned and unthinned balsam fir and red spruce stands. Balsam fir branch leaf area
peaked at a RD of 0.6 (slightly below the crown midpoint) while red spruce peaked near
the crown top (0.25 RD). Gilmore and Seymour (1997) predicted peaks in balsam fir leaf
area at RD of 0.4, 0.55, 0.65, and 0.7 in balsam fir intermediate, suppressed, codominant,
and open-grown trees, respectively. This pattern suggests that balsam fir trees have leaf
area concentrations closer to the crown base in codominant and open-grown trees, while
those of inferior canopy positions have leaf area concentrations higher in the crowns.
Upper canopy northern white-cedar branch leaf area distribution appears to follow a
pattern more similar to balsam fir than red spruce.
In addition to a strong fit to the BLA summation data, model [BA 4] has the
benefit of requiring easily measured variables (dbh and LCR) to predict leaf area and
crown foliage mass. This allows for cost effective and efficient data collection, without
the need for coring trees in future northern white-cedar research.
3.5.2 Volume Increment and Growth Efficiency
Refitting Honer’s (1967) volume equation increased estimated volume by an
average 2.31 dm3
per tree (range of 0.097 to 7.08 dm3
), a 10.0% mean volume increase
(range of 3.4 to 14.7%). Annual VINC estimated from breast height cores with the refit
Honer’s (1967) equation was comparable to observed VINC measured using WinStem](https://image.slidesharecdn.com/a6196abb-3f5a-49c5-839d-630298d5700b-160218150905/85/Hofmeyer-2008-Dissertation-final-80-320.jpg)


