SlideShare a Scribd company logo
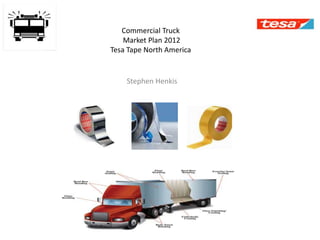
Commercial Truck
Market Plan 2012
Tesa Tape North America
Stephen Henkis
Table Of Contents
1.Executive Summary
2.Current Situation
3. Top OEM Profiles
4.Competitive Situation
5.Distribution Situation
6. Supply Chain Maps
7. Macro-Environment Situation
8. Opportunity/Issue Analysis
9.Strengths/Weaknesses
10.Issues
11.Objectives
12.Maketing Strategy
13.Execution Programs
14.ProForma P&L
15. Controls
16. Summary
17.Sources
1. Executive Summary
Goal:
To maintain current business and focus on solutions and problem-solving
concepts for applications in the North American truck industry, with
Emphasis on ACX Plus, PE foam & D/S opportunities.
Commercial Market:
The North American Commercial Heavy Truck Market produced 383,009
units in 2011 up 13.5% since 2010. There are 140 Businesses Globally with
Sales Over 30 Million who manufacture trucks and buses. There are 28
businesses in North America that manufacture Semi-trucks with over a billion
in Revenue. Some of the Top companies include but are not limited to
PACCAR( Peterbilt and Kenworth); Navistar International; Daimler Trucks
North America (Freightliner); Volvo Trucks North America; and the
commercial Truck Division of Ford. The industry is highly concentrated: the
Top Companies account for 95% of the revenue. The Industry includes
companies that manufacture and assemble complete vehicles and
companies that supply vehicle chassis to assembly plants.
1.Executive Summary
Commercial Market(continued):
Economic pressure from EPA regulations will continue to have a direct effect on truck
purchases with a gradual decrease after the release date.(See Graph). North American
Companies are starting to increase focus to new developing areas to balance the costs
of new manufacturing laws that will take effect soon.
Competition:
Major Competitors in the Truck industry include 3m Co., IPG, STM Industries INC.,
Morgan Adhesives, Nitto America’s INC., Celia Corporation, M&C Specialties Co.
and Scapa Tapes
2) Current Situation
• There are cTruck Manufacturers. B&T annual growth between years
2007-12 has risen 2.6%. The output of US heavy duty truck
production is forecast to grow at an annual compounded rate of 5%
between 2012 and 2016.
• The Department of Commerce Industry Annual Assessment showed
in 4th Quarter 2011 good strength in sales with class 8 trucks doing
much better than lighter (4-7) due to weakness in construction.
• The Heavy Truck (6-8)industry will continue to manufacture trucks
but at a gradual rate due to 62% of GDP Growth coming from
rebuilding of inventories. Commerce or GDp in April
• The 2011 Annual Fleet Study completed by CK Commercial Research
showed a 47 percent increase in the number of fleets planning new
class 8 and medium duty power unit purchases versus planned
orders in 2010. The strongest demand was from class 8 units.
2(Current Situation
• Purchasing new fuel efficient trucks models is a top priority for
truck manufacturers due to high and volatile fuel costs as well as
EPA Emission standards enacted by the Obama administration to
be in effect by 2014. Currently The Majority Top Companies
Models have Been appoved by the EPA Emission Board except
Navistar.
• Hybrid commercial trucks are not efficient enough yet due to
heavier loads. This will stop many Truck manufacturers from
shifting to new technology and Rely mostly on current distributors
and suppliers. Only Choosing to change based upon lower price.
• Longer Tank fleets are in full economic recovery during 2011 and
top tank fleet uses were in chemical production with big gains in
organic chemicals, pharmaceuticals, manmade fibers, pesticides,
adhesives, and industrial gases.
• Flatbed lengths come in 53', 48', 45', 40', 24'. The most common is
the 48ft and the 53ft'. Some Refrigerated Trailers use a 37 Ksi
Foam (vanguard Reefer trailers) A AC foam to keep the cool
temperature in for refrigerated trailers. This May be a opportunity
to compete in a quality driven market with refrigerated trucks.
2(Current Situation
• U.S Durable goods manufacturers’ shipments of motor vehicles
and parts, rose 13.8 percent YTD. in May 2012 Compared to the
same period in 2011.
• U.S Steel mill product prices fell 3.2 percent in June 2012
Compared to the same month in 2011.
• EPA is making changes to its heavy-duty diesel regulations that will
exempt emergency vehicles, such as dedicated ambulances and
fire trucks, to not have to follow EPA Regulations. This rule was
effective on August 7, 2012.
• For many years the largest economies in the world were the
United States, Europe and Japan, which have come to be known
as the ‘Triad’ economies. These three economies have been
mature for many years and growth is likely to be modest in the
longer term. Investors and businesses have been focusing on the
‘new growth’ economies of the so-called ‘BRIC’ countries – Brazil,
Russia, India and China–
0%
20%
40%
60%
80%
100%
2007 2008 2009 2010 2011
CANADA
MEXICO
US
Heavy Truck Production in NAFTA
44.40%
10.30%
6.90%
3.30%
8.30%
10.80%
11.10%
4.70%
Global Commercial vehicle Sales
by Country/Region, 2011
China
India
Brazil
Russia
N. America
Europe
Japan
S.Korea
bg
Target Segment Profile Summary
Primary Decision Maker OEM and OEM Suppliers
Role In Buying Center Negotiate Size and Price/ Modify Price to Increase Revenue
Organization Size U.S Market share: AB Volvo(23.6%), Paccar (21.0%), Daimler AG
(19.8%), Navistar(12.3%)
Organization Locations CA,OH,IN,OR,WA,OK,MN,MI,FL,SC,NY,PA,CO,TX,NC Locations List
Aftermarket East Coast And Near Water
Most Important Needs Masking
High Heat Resistance Masking (460ºF)
• Corrosive, and chemical resistant • Conformability
• Variety of backings • Clean edge • No curl during oven cure
• No residue • No shrinkage
Surface Protection
• Ability to stick to High gloss dashboards
Most Important Product Features (EPA) Stop Use Of Heavy tools,(Power drills) Faster/Simpler production
line.
(Logo &designPass Oven test
Tapes that Can handle High speeds and Heavy weight tests
Double Sided tape to bond metal Panels
Rating of Top Competitors 3m++, Tesa ++, Shurtape+
Competitor Shares 3m(19.5%),Shurtape(2%) Tesa(5%)
Distribution Channel Direct/Indirect
Sales Force Receptivity Very supportive, Testing for information awareness
Touch Points (Non-interruptive Advertising) More Integrated Advertising through
Free Social Media(LinkedIn & Blogs) Commercials, Newspaper
23.60%
21.00%
19.80%
12.30%
United States Truck Market
Share 2011
AB VOLVO
PACCAR
DAIMLER AG
NAVISTAR
32.70%
14.60%
19.40%
13.70%
10.70%
7.70%
Freightliner
Kenworth
International
Peterbilt
Volvo
Mack
0.00% 10.00% 20.00% 30.00% 40.00%
March 2012 Class 8 Sales
Class 8 Sales
Legend
• AB Volvo
• Mack
• Volvo
• Paccar
• Peterbilt
• Kenworth
• Daimler
• Freightliner
• Navistar
• International
Table: US Class 4 to Class 8 Truck sales, 2007-2011*
2007 2008 2009 2010 2011
Class 4 50,991 36,374 19,858 12,081 10,459
Class 5 44,922 40,300 23,942 30,976 42,483
Class 6 53,789 39,397 22,001 29,143 40,677
Class 7 70,426 48,880 39,087 38,350 41,212
Class 8 150,965 133,473 94,798 107,152 171,358
Total 371.093 298,424 199,686 217,702 306,189
Market Situation
U.S Purchase Breakdown
• U.S Class 8 Trucks 33,001lbs + up 59.9% 48.1%
U.S Class 7 Trucks 26,001 to 33,000lbs. 22.4%
U.S Class 6 Trucks 19,501 lbs. to 26,000lbs. 17%
Sales Production Charts
• EPA Regulations Since 1987 Show direct effect on purchasing for Class 8 trucks . During Serious Events effecting the
United States economy Epa Regulations has helped to increase purchasing up until the effective date.
• This in turn does help overall purchases of Commercial Trucks but only to decrease later after the release date as shown
above.
• Epa Effecive dates too close to recession times such as The September 11 attacks, which were responsible for the 01
recession, or in 2008 where the recession was caused by people buying houses they couldn’t afford which led to the fall of
the house market, leads to not having a high amount of sales and leads to extremely low sales after EPA Regulation
Effective Dates.
USA and Canada Market Locations
Legend
• AB Volvo
• Volvo
Trucks
• Mack
• Paccar
Peterbilt
Kenworth
• Daimler
Freightliner
• Navistar
International
Locations
Mexico Plant Locations
Legend
• Daimler
Freightliner
• Navistar
International
3) Top OEM Profiles
• AB VOLVO
– Volvo Trucks and Mack
• PACCAR
– Peterbilt and Kenworth
• DAIMLER
– Freightliner
• NAVISTAR
– International
AB Volvo
Founded: 1915
Headquarters: Torslanda, Sweden
CEO: Dennis Slagle
2011 Revenues: 310,367 Million
Employees:15,427 (North America)
Brands: Volvo Trucks, Mack
Na Mfg. Locations: 6 (U.S) 1(Canada)
Strategy: Volvo’s Reorganization of the companies structure to place increased focus
on its sales and marketing of its units. The group is continuously focused on
developing new high technology products for hybrid electric vehicles. Volvo I-shift and
Mack mDrive gearboxes to be produced in the U.S engine plant in third quarter of
2012 Volvo
AB Volvo
• Volvo’s North American truck range includes all the Mack models and two heavy
duty tractor series designed specifically for North America. Mack offers natural
gas-powered versions of the Pinnacle, TerraPro and Granite models.
• Volvo’s truck deliveries in North America, just like most Companies, follow a
pattern of a steep decline in 2007 and a further decline during the 2008/09
recession before increasing again in 2010 and 2011. The Group increased its
market share in North America in 2011 with the combined Volvo and Mack brands
recording Just above 20% of the US heavy-duty market.
• AB Volvo has Implemented improvements by having CEO focus on sales and
marketing deparments.
Paccar
Founded:1905
Headquarters: Bellevue Washington(1969)
CEO: Mark C. Pigott
2011 Revenues:15.3 Billion
Employees:23,400 (All sites)
Brands: Kenworth, Peterbilt, Daf, Leland
NA Mfg. Locations: U.S.(3) Canada(1) Mexico(1)
Strategy:
Paccar promotes itself as a technology leader through the development and launch of hybrid-
electric and hybrid-hydraulic trucks .Paccar is also focused on Developing Countries and
Emerging markets in Asia, India, Brazil, and Russia (60% revenue is generated outside U.S)
• A Major part of the company’s approach to developing its products and delivering its
services has been the adoption of the ‘Six Sigma’ lean manufacturing programme which
the company estimates had saved it more than US$1.5bn since 1997 when it first
launched it. Paccar has implemented more than 7,600 Six Sigma projects and has also
assisted several key suppliers to adopt the system. Paccar
Paccar
• Paccar is a leader in the design and manufacture of medium to heavy duty trucks.
– The company has 73 consecutive years of net income
– Commercial trucks and related replacement parts make up 90% of Revenue
– Kenworth and Peterbilt have Options to have Day Cabs, and Sleeper Cabs .Peterbilt
going even further to offer Extended cabs and Hybrid Models.
• North American Sales
– Paccar peaked in North America in 2006 and Europe in 2007, Paccar’s new truck
deliveries fell dramatically to 48.5% of 2008 volume in 2009 before recovering to only
62.6% of 2008 volume in 2010. However, 2011 volume exceeded 2008 volume by
nearly 10% to total 138,000 units in North America.
Daimler Ag
Founded: 1998
Headquarters: Auburn Hills, Michigan
CEO: Dieter Zetsche
2011 Revenue:106,540
Brands: Freightliner, Western Star, Sterling, Thomas Built
Employees:77,295
Strategy: Increase production in brazil, china, India and Russia as well as other
emerging economies. Daimler Key Ratios
Daimler Ag
• Daimler Trucks North America manufactures and markets medium and heavy
trucks under the Freightliner and Western Star brands as well as Mercedes-Benz
Unimog special-duty trucks and Sprinter vans.
– Daimler Truck Sales Climbed 47% In NA In 2011
– Daimler’s North American truck sales declined in 2008 and 2009 but increased
24.3% in 2010 and a further 87.7% in 2011 to return to 2007 volume again.
Navistar
Founded: 1902
Headquarters: Lisle, IL
CEO: Daniel Ustian
2011 Revenues: 2,576.6 (U.S.)
Employees: 19,000
Brands: International, MaxxForce, Monaco Coach, IC, and Work Horse
Mfg. Locations:
Strategy: Brand Strength. Portfolio expansion. Military. The percentage of revenue
generated by the military declined 14% between 2009 and 2010, due in part to the
switch in government spending priorities -- less for traditional combat vehicles and
more for high-tech ISR (intelligence, surveillance, and reconnaissance) equipment.
Navistar Key Ratios
Navistar
• Navistar has improved its cost structure and efficiency in each of its operational
areas including the distribution systems in its parts business. It has also increased
its manufacturing flexibility so that each manufacturing facility is capable of
producing nearly every truck model. this reduces logistics costs, and also enables
trucks to be manufactured close to customers.
Navistar Truck Deliveries In the U.S. And Canada
2007 2008 2009 2010 2011
Military 1,700 8,700 7,900 4,600 3,700
Class 6 & 7 88,500 59,600 39,800 46,400 64,600
Class 8 (SD) 61,400 50,100 40,500 34,600 39400
Class 8 142,900 102,500 77,700 92,600 139,700
Total 294,500 220,900 159,600 175,000 247,400
0%
5%
10%
15%
20%
25%
30%
35%
40%
2007 2008 2009 2010 2011
Daimler
Navistar
Paccar
Volvo
US Class 8 Truck Market Shares
0%
10%
20%
30%
40%
50%
2007 2008 2009 2010 2011
Daimler
Navistar
Paccar
Ford
US Class 6&7 Market Shares
Global Top 50 Manufacturers
Company Sales Employees
Gross Profit
Margin
Location
Hyundai Motor Company 98,858.27M 57,857 Seoul, South Korea
Chrysler Group LLC 54,981.00M 55,687 Auburn Hills, MI
AB Volvo 45,003.22M 102,248 23.89%Torslanda, Sweden
Mitsubishi Heavy Industries, Ltd. 34,993.66M 68,887 15.71%Tokyo, Japan
Kia Motors Corporation 23,916.62M 32,636 Seoul, South Korea
MAN SE 21,329.59M 52,542 21.56%Munich, Germany
Isuzu Motors Limited 17,367.92M 24,656 15.23%Tokyo, Japan
PACCAR Inc 16,355.20M 23,400 18.06%Bellevue, WA
Hino Motors, Ltd. 16,307.46M 25,820 13.38%Hino, Tokyo, Japan
Navistar International Corporatiom 13,958.00M 20,800 14.59%Lisle, IL
Scania AB 12,714.47M 37,496 27.21%Södertälje, Sweden
Beiqi Foton Motor Company Limited 8,113.54M 37,575 9.66%Beijing, China
Oshkosh Corporation 7,584.70M 13,100 11.55%Oshkosh, WI
Mitsubishi Fuso Truck & Bus Corporation 7,091.70M 12,000
Kawasaki, Kanagawa,
Japan
Mahindra & Mahindra Limited 6,366.30M 17,847 Mumbai, India
Nissan Shatai Co., Ltd. 5,641.24M 4,310
Hiratsuka, Kanagawa,
Japan
Great Wall Motor Company Limited 4,772.19M 45,737 24.91%Baoding, Hebei, China
Daimler Trucks North America LLC 3,823.40M 20,000 Portland, OR
EvoBus GmbH 3,288.00M 8,000
Kirchheim Unter Teck,
Baden-Württemberg,
Germany
Volvo Group Belgium NV 2,726.97M 2,962
Gent, Oost-Vlaanderen,
Belgium
UD Trucks Corporation 2,601.41M 3,377 Ageo, Saitama, Japan
Ashok Leyland Limited 2,589.64M 15,734 Chennai, India
Randon S.A. Implementos e Participaçoes 2,226.58M 4,321 22.36%
Caxias Do Sul, Rio Grande
do Sul, Brazil
Bénéteau S.A. 1,333.64M 7,032 46.41%
Saint-Gilles-Croix-Vie,
France
Zhengzhou Yutong Bus Co., Ltd. 1,312.47M 7,116 Zhengzhou, Henan, China
Global Top 50 Manufacturers (cont.)
Company Sales Employees Gross Profit Margin Location
Marcopolo S.A. 1,171.92M 11,898
Caxias Do Sul, Rio
Grande do Sul, Brazil
Kenworth Mexicana, S.A. de C.V. 1,066.44M 1,992
Mexicali, B.C.,
Mexico
New Flyer Industries Inc. 926.42M 2,100 11.01%
Winnipeg, MB,
Canada
Pierce Manufacturing Inc. 916.00M 1,900 Appleton, WI
Federal Signal Corporation 795.60M 2,900 24.87%Oak Brook, IL
Rosenbauer International AG 789.40M 2,123
Leonding,
Oberösterreich,
Austria
Mack Trucks, Inc. 736.00M 4,500 Greensboro, NC
Scania (Great Britain) Limited 730.06M 1,439
Milton Keynes,
United Kingdom
Forest River, Inc. 716.60M 6,000 Elkhart, IN
Iveco Czech Republic, a. s. 646.38M 1,989
Vysoke Myto, Czech
Republic
Volvo Trucks North America 563.90M 3,700 Greensboro, NC
The Scott Fetzer Company 556.40M 4,609 Westlake, OH
VOLVO POLSKA SP Z O O 550.08M 2,600 Wroclaw, Poland
IVECO ARGENTINA S.A. 508.60M 951
Ciudad De Buenos
Aires, Argentina
Motor Coach Industries Limited 501.04M 2,400
Winnipeg, MB,
Canada
SOLARIS BUS & COACH S A 460.44M 2,200 Owinska, Poland
New Flyer Industries Canada ULC 438.40M 2,100
Winnipeg, MB,
Canada
Spartan Motors, Inc. 426.01M 1,635 14.52%Charlotte, MI
Iveco Limited 421.16M 158
Watford,
Hertfordshire, United
Kingdom
Utility Trailer Manufacturing
Company
412.70M 2,500 City Of Industry, CA
Miller Industries, Inc. 412.66M 760 13.73%Ooltewah, TN
Beijing General Coach Factory 411.87M 3,500 Beijing, China
Daewoo Bus Corporation 354.16M 962
Buchon, Kyo, South
Korea
Sichuan Tengzhong Heavy
Industrial Machinery Co., Ltd.
354.15M 1,930
Chengdu, Sichuan,
China
Sypris Solutions, Inc. 335.63M 1,360 12.08%Louisville, KY
Top NA
Tier Manufacturers
• Robert Bosch
– Starter, Control, and Injection systems
• Johnson Controls
– Optima Batteries
– Varta Batteries
– LTH Batteries
– Heliar Batteries
• Denso International America, Inc.
• Magna International
– Complete Seat systems
– Cab-in-white stampings and assemblies made
from aluminum and steel including design
and development support
– Composite products (hood, roof and exterior
trim) and interior trim
– Fuel & Battery Systems: Innovative fuel &
battery systems
• Cummins Inc.
• Lear Corporation
• Visteon Corporation
• Tenneco
• BorgWarner INC.
• Federal Mogul Corporation
Top Tier 1 Customers by Revenue
Corporate Name Company Name
Total North American Aftermarket
Automotive Sales
Total Global Automotive
Aftermarket Sales
Total Global Automotive
Sales
Bridgestone Corp. Bridgestone Americas Inc. $ 15.6 Billion (e) Not Available $ 36.70 Billion (e)
Goodyear Tire & Rubber
Co. Goodyear Tire & Rubber Co. $ 9.9 Billion (e) Not Available $ 22.80 Billion (e)
The Michelin Group Michelin North America $ 7.2 Billion (e) Not Available $ 27.20 Billion (e)
ExxonMobil ExxonMobil $ 6 Billion (e) $ 16.6 Billion (e) $ 19.50 Billion (e)
Royal Dutch Shell plc Shell Oil Co. $ 4.59 Billion (e) $ 12.51 Billion (e) $ 15.31 Billion (e)
Continental Corp.
Continental Tire North
America $ 3 Billion (e) Not Available $ 40.00 Billion (e)
Cooper Tire & Rubber Co. Cooper Tire & Rubber Co. $ 2.8 Billion (e) Not Available $ 3.90 Billion (e)
BP America BP $ 2.71 Billion (e) $ 9.63 Billion (e) $ 11.74 Billion (e)
PPG Industries PPG Industries $ 2.38 Billion (e) $ 3.66 Billion (e) $ 5.08 Billion (e)
Affinia Group Inc. Affinia Group Inc. $ 1.7 Billion (e) $ 2.4 Billion (e) $ 2.50 Billion (e)
UCI-FRAM Group UCI-FRAM Group $ 1.68 Billion $ 1.81 Billion $ 2.00 Billion
Federal-Mogul Corp. Federal-Mogul Corp. $ 1.6 Billion $ 2.3 Billion $ 6.90 Billion
East Penn Manufacturing
Co.
East Penn Manufacturing
Co. $ 1.25 Billion (e) Not Available Not Available
Tenneco Inc. Tenneco Inc. $ 1.2 Billion $ 700 Million $ 7.20 Billion
Exide Technologies Exide Technologies $ 900 Million $ 1.6 Billion $ 1.90 Billion
The Sherwin-Williams Co. The Sherwin-Williams Co. $ 819.05 Million (e) $ 920.28 Million (e) $ 1.19 Billion (e)
3M
3M Automotive Aftermarket
Division $ 793.25 Million (e) $ 2.07 Billion (e) $ 2.76 Billion (e)
Standard Motor Products
Inc.
Standard Motor Products
Inc. (SMP) $ 776 Million $ 794 Million $ 875.00 Million
Tomkins Ltd. Gates Corp. $ 540 Million $ 1.01 Billion $ 2.00 Billion
Dorman Products Inc. Dorman Products Inc. $ 529 Million $ 529 Million $ 529.00 Million
Pirelli Tyre
Pirelli Tire North America
(PTNA) $ 500 Million (e) Not Available $ 7.40 Billion (e)
Warren Distribution Inc. Warren Distribution Inc. $ 459 Million $ 459 Million $ 459.00 Million
Remy International Inc. Remy International Inc. $ 458 Million (e) $ 556 Million (e) $ 1.20 Billion (e)
NGK Spark Plug Co. Ltd. NGK Spark Plugs (U.S.A.) Inc. $ 450 Million Not Available $ 1.70 Billion
Motorcar Parts of America
Inc. MPA $ 400 Million $ 400 Million $ 400.00 Million
SKF
SKF VSM North AmericaSKF
Automotive Division VSM
Business Unit N.A. $ 350 Million $ 1 Billion $ 2.60 Billion
Current Product Situation
• Sales
– We have gained small entry in the truck market and our
requested products by sales as of June 2012 include:
• Tesa 4174 High temperature Fine line Tape for design
masking Backing PVC Film, natural rubber adhesive
• Tesa 4244 Fine line tape for design masking Backing PVC,
natural Rubber Adhesive
• Tesa 54339 Precision Die Cuts for permanent Hole Covering
applications, backing PET Film, acrylic adhesive
• Tesa 4848 Surface Protection Film, PE film Backing, Acrylic
adhesive,
• Tesa 51136 Surface Protection and masking Tape, Acrylic
Adhesive, PE Film Backing
• Tesa 50530 Temporary protection tape for freshly painted
surfaces Polyolefin film backing, EVA Adhesive
Current Product Situation
• Benefits
– Manufacturers will buy our products in order to save money
with quality products that could end up costing later down the
road. A thorough testing for each customer and personal
relations with customer contacts allow us to promise to give
our customers the right to change the dimensions of our
offerings according to their specific needs. Personal
relationships with our customers allow us to continue having
the right products and builds trust with every customer.
Current Product Situation
ttNABU Masking Automotive
Data
BU APG ITEM CUSTOMER NAMEFocus market Sales CM
SALES
LYCM
Sales
Dev to
LYCM M1% CM SALES YTD SALES LYTD
Sales
Dev. to
LYTD M1% YTD
M1$ dev
to LYTD
45 20 4174 FERGUSON ENTERPRISES -PORTLANDRV/Bus/Trucks & Other 1,013$ 955$ 106.0% 68.8% 4,950$ 3,694$ 134.0% 68.1% 130.4%
FERGUSON ENTERPRISES -PORTLAND Total 1,013$ 955$ 106.0% 68.8% 4,950$ 3,694$ 134.0% 68.1% 130.4%
PRECISION INDUSTRIES INC -TULSRV/Bus/Trucks & Other 1,133$ 2,095$ 54.1% 61.3% 4,404$ 7,742$ 56.9% 60.1% 57.1%
PRECISION INDUSTRIES INC -TULS Total 1,133$ 2,095$ 54.1% 61.3% 4,404$ 7,742$ 56.9% 60.1% 57.1%
4174 Total 2,146$ 3,051$ 70.4% 64.8% 9,354$ 11,436$ 81.8% 64.3% 83.3%
4244 REPLENEX INCRV/Bus/Trucks & Other 4,147$ 3,131$ 132.5% 47.5% 19,485$ 17,602$ 110.7% 46.4% 108.3%
REPLENEX INC Total 4,147$ 3,131$ 132.5% 47.5% 19,485$ 17,602$ 110.7% 46.4% 108.3%
4244 Total 4,147$ 3,131$ 132.5% 47.5% 19,485$ 17,602$ 110.7% 46.4% 108.3%
20 Total 6,294$ 6,181$ 101.8% 53.4% 28,839$ 29,038$ 99.3% 52.2% 96.7%
31 54339 NAVISTAR INC - BLUE DIAMOND TRRV/Bus/Trucks & Other -$ -$ 0.0% 0.0% -$ 11,363$ 0.0% 0.0% 0.0%
NAVISTAR INC - BLUE DIAMOND TR Total -$ -$ 0.0% 0.0% -$ 11,363$ 0.0% 0.0% 0.0%
54339 Total -$ -$ 0.0% 0.0% -$ 11,363$ 0.0% 0.0% 0.0%
31 Total -$ -$ 0.0% 0.0% -$ 11,363$ 0.0% 0.0% 0.0%
32 4848 AB'S GLOVES & ABRASIVESRV/Bus/Trucks & Other 1,247$ 173$ 721.1% 49.0% 8,522$ 3,045$ 279.9% 48.1% 254.2%
AB'S GLOVES & ABRASIVES Total 1,247$ 173$ 721.1% 49.0% 8,522$ 3,045$ 279.9% 48.1% 254.2%
PRECISION INDUSTRIES INC -TULSRV/Bus/Trucks & Other -$ -$ 0.0% 0.0% -$ -$ 0.0% 0.0% 0.0%
PRECISION INDUSTRIES INC -TULS Total -$ -$ 0.0% 0.0% -$ -$ 0.0% 0.0% 0.0%
4848 Total 1,247$ 173$ 721.1% 49.0% 8,522$ 3,045$ 279.9% 48.1% 254.2%
51136 BRON TAPES - SALT LAKE CITYRV/Bus/Trucks & Other 339$ -$ 0.0% 37.6% 2,829$ 2,958$ 95.7% 36.5% 86.0%
BRON TAPES - SALT LAKE CITY Total 339$ -$ 0.0% 37.6% 2,829$ 2,958$ 95.7% 36.5% 86.0%
BRON TAPES - SAN DIEGORV/Bus/Trucks & Other 438$ -$ 0.0% 49.3% 438$ -$ 0.0% 49.3% 0.0%
BRON TAPES - SAN DIEGO Total 438$ -$ 0.0% 49.3% 438$ -$ 0.0% 49.3% 0.0%
LOWRY MANUFACTURING - RICHMONDRV/Bus/Trucks & Other 4,051$ 1,840$ 220.1% 34.8% 20,017$ 5,745$ 348.4% 34.0% 282.2%
LOWRY MANUFACTURING - RICHMOND Total 4,051$ 1,840$ 220.1% 34.8% 20,017$ 5,745$ 348.4% 34.0% 282.2%
51136 Total 4,827$ 1,840$ 262.3% 36.3% 23,284$ 8,702$ 267.6% 34.6% 222.9%
32 Total 6,075$ 2,013$ 301.7% 38.9% 31,807$ 11,747$ 270.8% 38.2% 232.6%
33 6973 CODESOURCE LLCRV/Bus/Trucks & Other -$ -$ 0.0% 0.0% 2,905$ -$ 0.0% 70.4% 0.0%
CODESOURCE LLC Total -$ -$ 0.0% 0.0% 2,905$ -$ 0.0% 70.4% 0.0%
6973 Total -$ -$ 0.0% 0.0% 2,905$ -$ 0.0% 70.4% 0.0%
33 Total -$ -$ 0.0% 0.0% 2,905$ -$ 0.0% 70.4% 0.0%
98 50530 HUGHES ENTERPRISES OF NJ INCRV/Bus/Trucks & Other -$ 2,118$ 0.0% 0.0% -$ 2,118$ 0.0% 0.0% 0.0%
HUGHES ENTERPRISES OF NJ INC Total -$ 2,118$ 0.0% 0.0% -$ 2,118$ 0.0% 0.0% 0.0%
50530 Total -$ 2,118$ 0.0% 0.0% -$ 2,118$ 0.0% 0.0% 0.0%
98 Total -$ 2,118$ 0.0% 0.0% -$ 2,118$ 0.0% 0.0% 0.0%
45 Total 12,368$ 10,312$ 119.9% 46.3% 63,550$ 54,265$ 117.1% 46.0% 93.8%
Grand Total 12,368$ 10,312$ 119.9% 46.3% 63,550$ 54,265$ 117.1% 46.0% 93.8%
New Product Opportunities
• Acx Plus products like, Acx High Adhesion and Acx High Resistance can be used
for tough applications as well as our PE foam tapes such as 62939 which hold a
thicker quality.
• Tesa 60953(51,52) Anti Slip safety Solution can be used to prevent damage for the
driver of the vehicle.
Recommended Applications
• Poly-Ethylene Foams Vs. 3m VHB
Applications
– Our PE Foams Beat #m’s VHB
applications because our
application can endure cold
shock
• 1) Exterior Paint-
– Fine line tape and Masking tape,
painting 4244, 7386, 4309
• Flooring adhesive-
– Double Sided Tapes 64620,
64621
• Roof bonding
– -ACX Plus 707x-
• Overlap Seam Bonding
– PE Foams 62936
• Panel Bonding
• Visor Fabric Bonding
– - any tape 4934 6931
• Wall Panel Attachment
– -none
• Nameplate Attachment
– PE foams 62939
• Ceiling Insulation Attachment
– - double sided tapes4952,4968
• Reflector attachment
– (none)
• Warning labels
– -none
• Engine foil
– --50565
• Wire Harnessing
– -54900,50118,51026 pv9
• Labeling
– -6931Pv2, 6937 pv6
• Interior mounting
– 62875,62872
• Hole covering
– -54657,54339
• Surface protection
– -50530 pv3, 4848pv1
• Paper masking
– -4318 pv2,4407(4244pv2, 7133_fl)Over Mask
4378,4379)
Competitive situation
3m Company
• Truck Assembly
– 1) Roof Bonding
– Bonding metal roof skins to truck body frame with 3M
VHB Acrylic Foam Tapes, 3M Scotch-Weld Structural
Adhesives and 3M Polyurethane and Hybrid Adhesive
Sealants.
– 2) Overlap Seam Bonding
– Bonding overlap seams of metal skins of truck bodies
with 3M VHB Acrylic Foam Tapes.
– 3) Panel Bonding
– 3M VHB Acrylic Foam Tapes and 3M Polyurethane and
Hybrid Adhesive Sealants.
– 4) Direct Glazing
– Bonding of windows and windscreens with 3M
Polyurethane and Hybrid Adhesive Sealants.
– 5) Mirror Glass Bonding
– Bonding exterior mirror glass to the mirror housing
bezel with 3M Double Coated Foam Tapes.
– 6) Visor Fabric Bonding
– Bonding fabric to sun visor in truck cabs with 3M
Scotch-Weld Water-based Adhesives.
• Truck Attachment
– 1) Wall Panel Attachment
– Attach interior wall & ceiling panels to
inside metal truck cabs with 3M Dual Lock
Re-closable Fasteners.
– 2) Nameplate Attachment
– Bonding of nameplates to truck body with
3M Double Coated and Transfer Tapes.
– 3) Ceiling Insulation Attachment
– Attaching foam insulation to ceiling of
truck cab prior to headliner installation
with 3M ATG Transfer Tapes.
– 4) Instrument Graphic Attachment
– Attaching screen printed polycarbonate
instrument cluster with 3M Laminating
Adhesive Transfer Tapes 200MP.
– 5) Reflector Attachment
– Attaching reflectors to the trailer sides
with 3M Double Coated Foam Tapes.
(9086,9087,9088,9088fl)
Competitive Situation
• 3m. Warning Labels
– 1) Warning Label
– Attaching warning label on trailer
with 3M Label Material 7931.
– 2) Wire harness Label
– Tracking labels on wiring
harnesses used in truck cabs
utilize 3M Label Material 7872.
– 3) Warning Label
– Attaching warning label on truck
bodies with 3M Label Material
7931.
• 3m Goals
– Start to come up with solutions to EPA
standards( some already launched in
other industries)
Product Quality
• Dual Lock Fastener’s incorporate
adhesive and Velcro
• Very Well ++
Marketing Strategies
Innovation
• Color coated tapes for easy work
site recognition
• Doubling ways to mend to
compete for quality
– 3m dual lock reclosable
fasteners
– VHB tapes
Competitive Situation
Intertape Polymer Group
• New products such as IPG’s AM
(AquaMask) compete against our tape for the
truck industry. The rubber-based adhesive
provides secure adhesion to both painted
and bare metals and plastics, yet removes
cleanly without adhesive residue, paint
“flaking” from backside, or surface staining.
Applications targeted are painting for
marine, bus truck and RV, as well as car.
– Product solutions include the Orange
MaskTM which is used for masking
fiberglass, New Double sided tapes AFT
450W and G which are acrylic foam
tapes for permanent applications, and
other PE Foam Applications
– Intertape will be closing a pressure
sensitive tape mfg. plant in Richmond.
• Intertape Polymer Group Goals
– Revenue(786,737)
Product Quality
• Aqua Mask and Orange Mask(TBD)
• (+) Compared to other competition
quality is not as important as price
Marketing Strategies
Building brand and Image
– Strategically partner with transportation
carriers that participate in EPA approved
incentive programs that reward fuel
efficiency improvements and reductions in
greenhouse gas emissions
• Manufacturing Processes *
– · Partnering with the Pressure Sensitive
Tape Council to develop and implement
Green Policy
Capture and reuse solvent vapors
produced in the manufacturing process
Competitive Situation
Shurtape
• Significantly less products than the
other competitors. Shurtape is not
currently competing in permanent
bonding applications for customers
such a foam and double sided tapes.
• Masking tapes have overall Low
adhesion temperatures
• Shurtape has temporary solutions for
automotive but however no
permanent solutions for the truck
industry in range of specification
applicable products.
• Shurtape Goals
Product Quality
(-) -Some tape products have an
expiration date when you have to
use them by in order to get full
usage out of them.
Marketing Strategies (Low Baller)
– Products come to the customer
with a cheaper price with much
lower quality overall
– Rolls Come In Longer yard
lengths( More for less
Philosophy)
– Pushing very low Level to be
able to sell Directly to plant or
Consumers
Competitive Situation
Indirect Competitors
• Our indirect competitor strategies are going to make products to stop the use of
tape our opportunity is to continue to make offerings that compete with
traditional nut and bolt applications
• The manufacture and distribution of products that compete for permanent
bonding applications in the Truck industry that are not tape specific include:
– Bolts, Rivet, and Fasteners Replacements in truck industry provide
opportunity to use Double sided tapes for more permanent uses. Such as
Bumper applications
– Adhesive painting Applications can allow Tesa to be used for labeling
Distribution Situation
Distribution
• Top Tier Distributers Worldwide (2012)
– 1. Denso 37.5 thermal, powertrain
control
– 2. Robert Bosch 34.0 fuel injection,
chassis systems
– 3. Magna Int. MGa.TO 25.6
interiors, exteriors, gearboxes
– 4. Continental (CONG.DE) 25.0
tires, brakes, telematics
– 5. Delphi DPHIQ.PK 22.3
powertrain, electronics
– 6. Aisin Seiki (7259.T) 21.7 body
systems, brake & chassis
– 7. Johnson Controls(JCI.N) 18.5
seating, interior electronics
– 8. Faurecia (EPED.PA) 17.4 exhaust
system, cockpits, doors
– 9. Lear (LEA.N) 16.0 seats,
instrument/door trim
– 10. ZF Friedrichshafen 15.1
transmissions, steering, axles
Projected in N.A
• In 2-5 years it is expected that Delphi, Magna
Johnson Controls, Faurecia, and Lear will
move higher in the pole of Top distributers as
design for hybrid vehicles change the
interface of trucks
Reason To Distribute Our Adhesives
• Our PSA Tapes and other products are the
most efficient technology to give the
distributor and OEM’s notoriety
• Our ability to negotiate prices via a Supplier
contract will give an opportunity to treat our
business seriously and give effective cost
controls
• Color labels will make user-ability more
practical in warehouse/plant situations and
would be more practical than other tape
brands
• Our ability to Adjust sizes to a particular end-
user’s interest will allow distributors to gain
higher percentages in successful Distributing
Supply Chain Maps
Parts/Tier1 OEM Dealer
Converter
Consumer
Distributor
• 3 supply Chain Opportunities provide better load time
• Giving more options in logistics ensure success and
less Outstanding accounts
• Selling Direct in U.S and Distribution in Mexico and
Canada
Macro-Environment Situation
• Demographic
– Center on Budget and Policy Priorities 2011, Many states have cut school funding this year
and Schools have started and may continue to start cutting budgets for school busses
• Economic/Business Conditions
– Overseas Trade manufacturers continue to look to emerging economies for growth to help
facilitate overseas business
– Safety Issues Public concerns over truck safety can lead to additional requirements for safety
features from truck manufacturers and restrictions on truck travel in congested urban areas.
Efforts can either increase costs or be seen as a competitive advantage
• Technological
– Hybrid Electric Vehicles ,Growing concerns over climate change and dependence on foreign oil
prompted the U.S government to fund programs that develop alternative power sources for
vehicles, which can be marketed as fuel savers.
• Political and Legal
– Stricter Emissions Compliance can increase production costs
– (3/8/2012) Obama Offer’s $1 Billion Plan To Speed Alternative Fuel Vehicles-Obama Made a
Speech At Daimler Trucks NA In Mount Holly offering company and family tax breaks to
purchasers of biofuel, electric, or natural gas ,vehicles to help build fuel stations nearby and
make it easier for automakers to sell.
– The White House also announced the launch of “EV Everywhere”, A challenge program
designed by the Department Of Energy to make electric vehicles as affordable and convenient
as gasoline- powered vehicle for the average family within a decade.
Strengths Weaknesses
• The Quality of our Unique Selling
Proposition is higher than our
competitors .
• Brand Loyalty
– Dealing personally with
customers gives us great
relations with customers giving
them the attention to detail that
is needed
• Control of distribution Arrangements
– Continental regional strategy
ensure optimal management and
responsibility
• Access to the latest technology and
most efficient
– Though we are a small company
In NA the quality and innovation
of our products speak for
• Price
– In an economy where most
businesses are recovering the
majority of OEM's are focused on
using low price driven products .
Opportunity and Issue Analysis
• External Opportunities
• New hybrid vehicles will need new
solutions
• Come up with solutions to help
against EPA standards for OEM’s
– Lighter weight of products in cars
for fuel efficiency
– Concentrate on Permanent
Bonding solutions (steering
wheel, dashboard covering
applications, seat covers, belts)
• External Threats
– New Innovative trends in the
industry that replace our tapes
Opportunity solutions
Key Issues
• Decisions to be made
– In Order to maximize on potential
opportunities We need to come
up with solutions to the EPA rule
against all trucks to either reduce
weight or add to the efficiency of
gas consumption.
– Most Companies are now starting
to make hybrid vehicles allocated
to fuel efficiency New designs and
innovations will allow us to come
up with new solutions for the
industry .
– Though rigorous, Permanent
bonding solutions sold directly to
OEM's can be the way to continue
to secure revenue with customers.
If not through permanent bonding
we must find new ways to have
returning customers not just based
upon product quality alone.
• Customer Opportunity
Decisions to be made
Contact Direct or Intimate with
Specific Models for testing
Product, Price, Promotion, and Placement
• Product
– To OEMs who are looking to
reduce weight and over
engineering, Tesa has many
different solutions to make it
easier for you to come up with
simple cost effective solutions.
Putting Quality First is the most
efficient way to keep cost down.
• It is important that we differentiate
our quality and cost effectiveness
towards our customers above our
competitors Some ways to do so
are…
– Announcing Global Recognition
and Awards
– Working with R&D to test the
quality of our product offerings
versus our competitors
– Having new information on
competitor products for our sales
teams
Product, Price, Promotion, and Placement
• Price-Higher Quality Tapes
• Cost of production and distribution will
have a effect on the profit margin.
However our key is to gain long term
contracts with customers.
• It is Important that we do not overprice
or underprice our tapes Pricing is based
upon application and yard length.
– Underprice- can lead to the
customer thinking it is not of good
quality
– Overprice- can make the customer
feeling like they are being “taken”
• Buyers will typically order direct in
advance
– Percentage off of sales to pay
within a certain amount of days
can be used during low sales
periods, This will increase brand
awareness but not necessarily
long term buyers
• Perceived
– Value Pricing Strategy
• Performance
• Image
• Quality
• Customer Support
• Delivery
Product, Price, Promotion, and Placement
• Promotion
– General Promotion Techniques-
Push and Pull
– Target Market Group:
Experienced OEMs, 20 Year
History
– Revenue:
• Place (Distribution)
– OEM's Would direct order
– In cases of low sales
Objectives
• Gain +7% of the market share by
2017(gain Footing). (708000)
• Gain +5% Target Permanent bonding
applications(Secure Business)
• Gain +5% of New fuel efficient
manufacturers of trucks(Increase
future business)
Marketing Strategy/Project Replace
• Media
– Advertising-Web Revisions
and advertising on social
media(LinkedIn)
• Strategy
– To create brand
awareness, solutions, and
innovations in the truck
industry
• Target top 5 Revenue OEM and
Aftermarket Customer for 2012
– (T/B Manu)AB Volvo, Man
SE Isuzu Motors Limited,
Paccar Inc., Daimler Hino
Motors Ltd.
– (Auto-Part/Supplies Manu)
Bosch, Continental AG,
Johnson Controls Inc.,
Therm Air Australia PTY
LTD, Denso Corporation
• Perform demonstrational testing with
products companies currently use
against our pre-tested brands for
durability/pricing
– Secondary Competitors Included (
___ )
– Ask for upcoming product
contracts
Execution Programs
• 1) Gain Access with OEM Plants
• 2) Note possible Solutions, and
specifications (ex. Paint Bleeding,
Sloppiness)
• 3)Establish Key Contacts at OEM
plants
• 4)Gain specification requirements at
head quarters
• 5)Implement Changes
ProForma P&L
0%
2%
4%
6%
8%
10%
12%
14%
Year1 Year2 Year3 Year4 Year5
Tesa Currently Occupies 5.7% of the Market
2012-17
Recommended Marketing Strategy
Gain Access
• Accumulate potential problems to fix at Plant
• Present Powerpoint
• Build Relationships
Reach
• Identify user specifics and value through process*
• Give specialty product info.
Challenge
• Gain Requirements from HQ’s
• Design Solutions
Approve &
Contact
• Pass Specific Approvals
• Stay in Contact to increase Relationship Value (Think Tesa First)
Recommended Marketing Strategy
• Focusing on quality against competitiors and for end users.Our PSA Tapes targeted
for permanent applications and through supportive channels to increase efficiency.
– Target End user and tier awareness on all products.
– Offer testing with invitations to Sparta Plant
– Become the leader in Permanent Bonding applications
– Continue to Improve advertising reach for lower cost
– Expand Marketing plan for specialty Trucks in 2013
Recommended Marketing Strategy
Strategy Marketing Srategy Grid
Target Truck
Brand Positioning Permanent Bonding Applications
Business Objectives We want to gain +7% market share in 5
years
Marketing Objectives New Product testing and Permanent
Applications
Product offering Productive Solutions
Recommended Marketing Strategy
Pricing Value Based
Distribution We Drive The Process Directly to Oems
and Tiers while also Giving our logistic
partners options
Brand Communication Tesa Is interested in Continuous
improvement in line with customer goals
Sales force Local Sales Force with Customer Support
Help
Customer care We Support Strategic/ Major Accounts
Directly
Medium and Small accounts get support
from our partners
(Tesa Incentives Program ) Rewarding Long
term customers…Perks to Doing business
ex. )
Timeline
Focus Action Target Completion Date
Assortment Length Changes • Aligning Assortments For
T&B
• Launching Assortments
January 2013
Double Sided Specs • Contact Head Quarters
• Meet Specifications
January 2013
Permanent Bonding • Updated website and
advertising
• Sales Force & Customer
Support
February 2013
Tesa Incentives Program • Discussion Workshop
• Launch
March 2013
Timeline
Focus Action Target Completion Date
Double Sided Specifications • Volvo and Paccar
Headquarter Tests
April 2013
Meet Specifications Contact HeadQuarter April 2013
ACXplus & Other Double
Sided Tapes
Instruction Video Pamplets
for customers and Launch
May 2013
Controls
• Contingency Plan
– Potential Problem Analysis
• Meetings to keep Team up to date on current needs
• Monitored Customer Visits By MCGR (4730)
• Monthly Excel Sheet Entry On Progress Posted to an Online Retrievable
database(ttna.net)
Summary
• Commercial Trucks is a mature market with increasing technical barriers into entry.
Temporary applications such as masking are less technical and easily competed
against. More permanent Solutions however are very technical and would require
more research and development in to each model but would secure sales margins
yearly with customer as OEM's are less likely to change permanent structural
applications. Masking, PE Foams, and other double sided tapes would be some of
our main applications against competitors.
• Current challenges will include permanent applications such as metal to metal
bonding that allow Tesa to prove its quality. As well as solutions to masking
applications which may have increased pressure to lower price over quality.
Current goals include Direct advertising to give customer awareness Of our
applications as well a significant Increase in market share. With the right amount
of research and development Tesa can be the company OEM's come to first for
solutions.

More Related Content

What's hot

Ford Motors Case Analysis
Ford Motors Case AnalysisFord Motors Case Analysis
Ford Motors Case AnalysisWilliam Duncan
 
Ford
FordFord
Report on ford motor company (POM)
Report on ford motor company (POM)Report on ford motor company (POM)
Report on ford motor company (POM)
Harsh_BITS
 
Strategic Management of US Ford Motors Corporation
Strategic Management of US Ford Motors CorporationStrategic Management of US Ford Motors Corporation
Strategic Management of US Ford Motors Corporation
Aga Dcruz
 
Ford Motor Company
Ford Motor CompanyFord Motor Company
Ford Motor Company
Cletus Monteiro
 
Ford Mondeo Case Study Analisys
Ford Mondeo  Case Study AnalisysFord Mondeo  Case Study Analisys
Ford Mondeo Case Study Analisys
tasmeen
 
VRIO Honda and general motors
VRIO Honda and general motorsVRIO Honda and general motors
VRIO Honda and general motors
Parameswar Rao
 
Ford SWOT Analysis 2018
Ford SWOT Analysis 2018Ford SWOT Analysis 2018
Ford SWOT Analysis 2018
Ovidijus Jurevicius
 
Ford's Financial Analysis Report
Ford's Financial Analysis ReportFord's Financial Analysis Report
Ford's Financial Analysis ReportRichard Burcham
 
Ford motors(modified)
Ford motors(modified)Ford motors(modified)
Ford motors(modified)
viggy vanshi
 
China retail +introduction
China retail +introductionChina retail +introduction
China retail +introductioneric7676
 
Ford motor final presentation
Ford motor final presentationFord motor final presentation
Ford motor final presentation
adithya_msridhar
 
BMW Group - Arber Hoxhallari
BMW Group - Arber HoxhallariBMW Group - Arber Hoxhallari
BMW Group - Arber Hoxhallari
Arber Hoxhallari
 
Mazda Eas Presentation
Mazda Eas PresentationMazda Eas Presentation
Mazda Eas Presentation
CardinaleWay Mazda
 
Ford motor analysis
Ford motor analysisFord motor analysis
Ford motor analysis
NeetikaRao1
 
Presentation on ford motor company (pom)
Presentation on ford motor company (pom)Presentation on ford motor company (pom)
Presentation on ford motor company (pom)
Harsh_BITS
 

What's hot (20)

Ford Motors Case Analysis
Ford Motors Case AnalysisFord Motors Case Analysis
Ford Motors Case Analysis
 
Ford
FordFord
Ford
 
Report on ford motor company (POM)
Report on ford motor company (POM)Report on ford motor company (POM)
Report on ford motor company (POM)
 
Strategic Management of US Ford Motors Corporation
Strategic Management of US Ford Motors CorporationStrategic Management of US Ford Motors Corporation
Strategic Management of US Ford Motors Corporation
 
Ford Motor Company
Ford Motor CompanyFord Motor Company
Ford Motor Company
 
Ford
Ford Ford
Ford
 
Ford Mondeo Case Study Analisys
Ford Mondeo  Case Study AnalisysFord Mondeo  Case Study Analisys
Ford Mondeo Case Study Analisys
 
Ford Motor Company
Ford Motor CompanyFord Motor Company
Ford Motor Company
 
VRIO Honda and general motors
VRIO Honda and general motorsVRIO Honda and general motors
VRIO Honda and general motors
 
Ford SWOT Analysis 2018
Ford SWOT Analysis 2018Ford SWOT Analysis 2018
Ford SWOT Analysis 2018
 
Ford's Financial Analysis Report
Ford's Financial Analysis ReportFord's Financial Analysis Report
Ford's Financial Analysis Report
 
Ford motors(modified)
Ford motors(modified)Ford motors(modified)
Ford motors(modified)
 
China retail +introduction
China retail +introductionChina retail +introduction
China retail +introduction
 
Ford motor final presentation
Ford motor final presentationFord motor final presentation
Ford motor final presentation
 
BMW Group - Arber Hoxhallari
BMW Group - Arber HoxhallariBMW Group - Arber Hoxhallari
BMW Group - Arber Hoxhallari
 
Mazda Eas Presentation
Mazda Eas PresentationMazda Eas Presentation
Mazda Eas Presentation
 
Ford motors ppt
Ford motors pptFord motors ppt
Ford motors ppt
 
Ford motor analysis
Ford motor analysisFord motor analysis
Ford motor analysis
 
Renault Presentation
Renault PresentationRenault Presentation
Renault Presentation
 
Presentation on ford motor company (pom)
Presentation on ford motor company (pom)Presentation on ford motor company (pom)
Presentation on ford motor company (pom)
 

Similar to HeavyTB-Tesa

Tesla strategic management final
Tesla strategic management finalTesla strategic management final
Tesla strategic management final
Nadine Khattab
 
PolkWP_CC1324F_StrategicQuestionsAutoBusinessPlanners-201212
PolkWP_CC1324F_StrategicQuestionsAutoBusinessPlanners-201212PolkWP_CC1324F_StrategicQuestionsAutoBusinessPlanners-201212
PolkWP_CC1324F_StrategicQuestionsAutoBusinessPlanners-201212Lonnie Miller
 
VOLVO TRUCKS : PENETRATING THE US MARKET
VOLVO TRUCKS : PENETRATING THE US MARKETVOLVO TRUCKS : PENETRATING THE US MARKET
VOLVO TRUCKS : PENETRATING THE US MARKET
Aamir chouhan
 
ArvinMeritor Corporate Overview
ArvinMeritor Corporate OverviewArvinMeritor Corporate Overview
ArvinMeritor Corporate OverviewOttoypj
 
Tesla analysis 2014
Tesla analysis 2014Tesla analysis 2014
Tesla analysis 2014
Meherunnesha (Nishat)
 
Outlook on Fuel Cell Market and Technologies
Outlook on Fuel Cell Market and TechnologiesOutlook on Fuel Cell Market and Technologies
Outlook on Fuel Cell Market and Technologies
IBD CleanTech, Inc
 
2015 Key Data - 4th Energy Wave Fuel Cell and Hydrogen Annual Review, 2016
2015 Key Data - 4th Energy Wave Fuel Cell and Hydrogen Annual Review, 20162015 Key Data - 4th Energy Wave Fuel Cell and Hydrogen Annual Review, 2016
2015 Key Data - 4th Energy Wave Fuel Cell and Hydrogen Annual Review, 2016
Kerry-Ann Adamson
 
PPT ON TATA MOTORS CASE 8
PPT ON TATA MOTORS CASE 8PPT ON TATA MOTORS CASE 8
PPT ON TATA MOTORS CASE 8Syed Nabeel Ali
 
Fiscal Third Quarter 2013 Investor Presentation
Fiscal Third Quarter 2013 Investor PresentationFiscal Third Quarter 2013 Investor Presentation
Fiscal Third Quarter 2013 Investor Presentation
Thor_Industries
 
Fiscal Third Quarter 2013 Investor Presentation
Fiscal Third Quarter 2013 Investor PresentationFiscal Third Quarter 2013 Investor Presentation
Fiscal Third Quarter 2013 Investor Presentation
Thor_Industries
 
Challenges and opportunities in UK Auto
Challenges and opportunities in UK AutoChallenges and opportunities in UK Auto
Challenges and opportunities in UK AutoPaul Cadman
 
TATA_MOTORS_CASEggggggggggfrtuonbbxdryiiookkvgfffguijbbvcddf.pptx
TATA_MOTORS_CASEggggggggggfrtuonbbxdryiiookkvgfffguijbbvcddf.pptxTATA_MOTORS_CASEggggggggggfrtuonbbxdryiiookkvgfffguijbbvcddf.pptx
TATA_MOTORS_CASEggggggggggfrtuonbbxdryiiookkvgfffguijbbvcddf.pptx
darshan24217
 
Economic analysis of automobile industry
Economic analysis of automobile industryEconomic analysis of automobile industry
Economic analysis of automobile industry
Nimisha Agarwal
 
Tata Motos Limited
Tata Motos LimitedTata Motos Limited
Tata Motos Limited
Saurabh Kumar
 
Lucintel globalcompositemarketanalysis-acma2012-educationalsession
Lucintel globalcompositemarketanalysis-acma2012-educationalsessionLucintel globalcompositemarketanalysis-acma2012-educationalsession
Lucintel globalcompositemarketanalysis-acma2012-educationalsession
tehamoud
 
THE CHINESE NEW ENERGY VEHICLE MARKET
THE CHINESE NEW ENERGY VEHICLE MARKET THE CHINESE NEW ENERGY VEHICLE MARKET
THE CHINESE NEW ENERGY VEHICLE MARKET
Weixing Zhou
 
CNG, RNG, and Hydrogen Tanks Market Trends Size & Share - Recent Developments...
CNG, RNG, and Hydrogen Tanks Market Trends Size & Share - Recent Developments...CNG, RNG, and Hydrogen Tanks Market Trends Size & Share - Recent Developments...
CNG, RNG, and Hydrogen Tanks Market Trends Size & Share - Recent Developments...
Kailas S
 
Strategic management toyota case study
Strategic management  toyota case studyStrategic management  toyota case study
Strategic management toyota case studyArio Ardianto
 

Similar to HeavyTB-Tesa (20)

Tesla strategic management final
Tesla strategic management finalTesla strategic management final
Tesla strategic management final
 
PolkWP_CC1324F_StrategicQuestionsAutoBusinessPlanners-201212
PolkWP_CC1324F_StrategicQuestionsAutoBusinessPlanners-201212PolkWP_CC1324F_StrategicQuestionsAutoBusinessPlanners-201212
PolkWP_CC1324F_StrategicQuestionsAutoBusinessPlanners-201212
 
VOLVO TRUCKS : PENETRATING THE US MARKET
VOLVO TRUCKS : PENETRATING THE US MARKETVOLVO TRUCKS : PENETRATING THE US MARKET
VOLVO TRUCKS : PENETRATING THE US MARKET
 
ArvinMeritor Corporate Overview
ArvinMeritor Corporate OverviewArvinMeritor Corporate Overview
ArvinMeritor Corporate Overview
 
Tesla analysis 2014
Tesla analysis 2014Tesla analysis 2014
Tesla analysis 2014
 
Outlook on Fuel Cell Market and Technologies
Outlook on Fuel Cell Market and TechnologiesOutlook on Fuel Cell Market and Technologies
Outlook on Fuel Cell Market and Technologies
 
Toyota
Toyota Toyota
Toyota
 
2015 Key Data - 4th Energy Wave Fuel Cell and Hydrogen Annual Review, 2016
2015 Key Data - 4th Energy Wave Fuel Cell and Hydrogen Annual Review, 20162015 Key Data - 4th Energy Wave Fuel Cell and Hydrogen Annual Review, 2016
2015 Key Data - 4th Energy Wave Fuel Cell and Hydrogen Annual Review, 2016
 
PPT ON TATA MOTORS CASE 8
PPT ON TATA MOTORS CASE 8PPT ON TATA MOTORS CASE 8
PPT ON TATA MOTORS CASE 8
 
Fiscal Third Quarter 2013 Investor Presentation
Fiscal Third Quarter 2013 Investor PresentationFiscal Third Quarter 2013 Investor Presentation
Fiscal Third Quarter 2013 Investor Presentation
 
Fiscal Third Quarter 2013 Investor Presentation
Fiscal Third Quarter 2013 Investor PresentationFiscal Third Quarter 2013 Investor Presentation
Fiscal Third Quarter 2013 Investor Presentation
 
Challenges and opportunities in UK Auto
Challenges and opportunities in UK AutoChallenges and opportunities in UK Auto
Challenges and opportunities in UK Auto
 
TATA_MOTORS_CASEggggggggggfrtuonbbxdryiiookkvgfffguijbbvcddf.pptx
TATA_MOTORS_CASEggggggggggfrtuonbbxdryiiookkvgfffguijbbvcddf.pptxTATA_MOTORS_CASEggggggggggfrtuonbbxdryiiookkvgfffguijbbvcddf.pptx
TATA_MOTORS_CASEggggggggggfrtuonbbxdryiiookkvgfffguijbbvcddf.pptx
 
Economic analysis of automobile industry
Economic analysis of automobile industryEconomic analysis of automobile industry
Economic analysis of automobile industry
 
Tata Motos Limited
Tata Motos LimitedTata Motos Limited
Tata Motos Limited
 
Honda
HondaHonda
Honda
 
Lucintel globalcompositemarketanalysis-acma2012-educationalsession
Lucintel globalcompositemarketanalysis-acma2012-educationalsessionLucintel globalcompositemarketanalysis-acma2012-educationalsession
Lucintel globalcompositemarketanalysis-acma2012-educationalsession
 
THE CHINESE NEW ENERGY VEHICLE MARKET
THE CHINESE NEW ENERGY VEHICLE MARKET THE CHINESE NEW ENERGY VEHICLE MARKET
THE CHINESE NEW ENERGY VEHICLE MARKET
 
CNG, RNG, and Hydrogen Tanks Market Trends Size & Share - Recent Developments...
CNG, RNG, and Hydrogen Tanks Market Trends Size & Share - Recent Developments...CNG, RNG, and Hydrogen Tanks Market Trends Size & Share - Recent Developments...
CNG, RNG, and Hydrogen Tanks Market Trends Size & Share - Recent Developments...
 
Strategic management toyota case study
Strategic management  toyota case studyStrategic management  toyota case study
Strategic management toyota case study
 

HeavyTB-Tesa

  • 1. Commercial Truck Market Plan 2012 Tesa Tape North America Stephen Henkis
  • 2. Table Of Contents 1.Executive Summary 2.Current Situation 3. Top OEM Profiles 4.Competitive Situation 5.Distribution Situation 6. Supply Chain Maps 7. Macro-Environment Situation 8. Opportunity/Issue Analysis 9.Strengths/Weaknesses 10.Issues 11.Objectives 12.Maketing Strategy 13.Execution Programs 14.ProForma P&L 15. Controls 16. Summary 17.Sources
  • 3. 1. Executive Summary Goal: To maintain current business and focus on solutions and problem-solving concepts for applications in the North American truck industry, with Emphasis on ACX Plus, PE foam & D/S opportunities. Commercial Market: The North American Commercial Heavy Truck Market produced 383,009 units in 2011 up 13.5% since 2010. There are 140 Businesses Globally with Sales Over 30 Million who manufacture trucks and buses. There are 28 businesses in North America that manufacture Semi-trucks with over a billion in Revenue. Some of the Top companies include but are not limited to PACCAR( Peterbilt and Kenworth); Navistar International; Daimler Trucks North America (Freightliner); Volvo Trucks North America; and the commercial Truck Division of Ford. The industry is highly concentrated: the Top Companies account for 95% of the revenue. The Industry includes companies that manufacture and assemble complete vehicles and companies that supply vehicle chassis to assembly plants.
  • 4. 1.Executive Summary Commercial Market(continued): Economic pressure from EPA regulations will continue to have a direct effect on truck purchases with a gradual decrease after the release date.(See Graph). North American Companies are starting to increase focus to new developing areas to balance the costs of new manufacturing laws that will take effect soon. Competition: Major Competitors in the Truck industry include 3m Co., IPG, STM Industries INC., Morgan Adhesives, Nitto America’s INC., Celia Corporation, M&C Specialties Co. and Scapa Tapes
  • 5. 2) Current Situation • There are cTruck Manufacturers. B&T annual growth between years 2007-12 has risen 2.6%. The output of US heavy duty truck production is forecast to grow at an annual compounded rate of 5% between 2012 and 2016. • The Department of Commerce Industry Annual Assessment showed in 4th Quarter 2011 good strength in sales with class 8 trucks doing much better than lighter (4-7) due to weakness in construction. • The Heavy Truck (6-8)industry will continue to manufacture trucks but at a gradual rate due to 62% of GDP Growth coming from rebuilding of inventories. Commerce or GDp in April • The 2011 Annual Fleet Study completed by CK Commercial Research showed a 47 percent increase in the number of fleets planning new class 8 and medium duty power unit purchases versus planned orders in 2010. The strongest demand was from class 8 units.
  • 6. 2(Current Situation • Purchasing new fuel efficient trucks models is a top priority for truck manufacturers due to high and volatile fuel costs as well as EPA Emission standards enacted by the Obama administration to be in effect by 2014. Currently The Majority Top Companies Models have Been appoved by the EPA Emission Board except Navistar. • Hybrid commercial trucks are not efficient enough yet due to heavier loads. This will stop many Truck manufacturers from shifting to new technology and Rely mostly on current distributors and suppliers. Only Choosing to change based upon lower price. • Longer Tank fleets are in full economic recovery during 2011 and top tank fleet uses were in chemical production with big gains in organic chemicals, pharmaceuticals, manmade fibers, pesticides, adhesives, and industrial gases. • Flatbed lengths come in 53', 48', 45', 40', 24'. The most common is the 48ft and the 53ft'. Some Refrigerated Trailers use a 37 Ksi Foam (vanguard Reefer trailers) A AC foam to keep the cool temperature in for refrigerated trailers. This May be a opportunity to compete in a quality driven market with refrigerated trucks.
  • 7. 2(Current Situation • U.S Durable goods manufacturers’ shipments of motor vehicles and parts, rose 13.8 percent YTD. in May 2012 Compared to the same period in 2011. • U.S Steel mill product prices fell 3.2 percent in June 2012 Compared to the same month in 2011. • EPA is making changes to its heavy-duty diesel regulations that will exempt emergency vehicles, such as dedicated ambulances and fire trucks, to not have to follow EPA Regulations. This rule was effective on August 7, 2012. • For many years the largest economies in the world were the United States, Europe and Japan, which have come to be known as the ‘Triad’ economies. These three economies have been mature for many years and growth is likely to be modest in the longer term. Investors and businesses have been focusing on the ‘new growth’ economies of the so-called ‘BRIC’ countries – Brazil, Russia, India and China–
  • 8. 0% 20% 40% 60% 80% 100% 2007 2008 2009 2010 2011 CANADA MEXICO US Heavy Truck Production in NAFTA 44.40% 10.30% 6.90% 3.30% 8.30% 10.80% 11.10% 4.70% Global Commercial vehicle Sales by Country/Region, 2011 China India Brazil Russia N. America Europe Japan S.Korea bg
  • 9. Target Segment Profile Summary Primary Decision Maker OEM and OEM Suppliers Role In Buying Center Negotiate Size and Price/ Modify Price to Increase Revenue Organization Size U.S Market share: AB Volvo(23.6%), Paccar (21.0%), Daimler AG (19.8%), Navistar(12.3%) Organization Locations CA,OH,IN,OR,WA,OK,MN,MI,FL,SC,NY,PA,CO,TX,NC Locations List Aftermarket East Coast And Near Water Most Important Needs Masking High Heat Resistance Masking (460ºF) • Corrosive, and chemical resistant • Conformability • Variety of backings • Clean edge • No curl during oven cure • No residue • No shrinkage Surface Protection • Ability to stick to High gloss dashboards Most Important Product Features (EPA) Stop Use Of Heavy tools,(Power drills) Faster/Simpler production line. (Logo &designPass Oven test Tapes that Can handle High speeds and Heavy weight tests Double Sided tape to bond metal Panels Rating of Top Competitors 3m++, Tesa ++, Shurtape+ Competitor Shares 3m(19.5%),Shurtape(2%) Tesa(5%) Distribution Channel Direct/Indirect Sales Force Receptivity Very supportive, Testing for information awareness Touch Points (Non-interruptive Advertising) More Integrated Advertising through Free Social Media(LinkedIn & Blogs) Commercials, Newspaper
  • 10. 23.60% 21.00% 19.80% 12.30% United States Truck Market Share 2011 AB VOLVO PACCAR DAIMLER AG NAVISTAR 32.70% 14.60% 19.40% 13.70% 10.70% 7.70% Freightliner Kenworth International Peterbilt Volvo Mack 0.00% 10.00% 20.00% 30.00% 40.00% March 2012 Class 8 Sales Class 8 Sales Legend • AB Volvo • Mack • Volvo • Paccar • Peterbilt • Kenworth • Daimler • Freightliner • Navistar • International
  • 11. Table: US Class 4 to Class 8 Truck sales, 2007-2011* 2007 2008 2009 2010 2011 Class 4 50,991 36,374 19,858 12,081 10,459 Class 5 44,922 40,300 23,942 30,976 42,483 Class 6 53,789 39,397 22,001 29,143 40,677 Class 7 70,426 48,880 39,087 38,350 41,212 Class 8 150,965 133,473 94,798 107,152 171,358 Total 371.093 298,424 199,686 217,702 306,189
  • 12. Market Situation U.S Purchase Breakdown • U.S Class 8 Trucks 33,001lbs + up 59.9% 48.1% U.S Class 7 Trucks 26,001 to 33,000lbs. 22.4% U.S Class 6 Trucks 19,501 lbs. to 26,000lbs. 17%
  • 13. Sales Production Charts • EPA Regulations Since 1987 Show direct effect on purchasing for Class 8 trucks . During Serious Events effecting the United States economy Epa Regulations has helped to increase purchasing up until the effective date. • This in turn does help overall purchases of Commercial Trucks but only to decrease later after the release date as shown above. • Epa Effecive dates too close to recession times such as The September 11 attacks, which were responsible for the 01 recession, or in 2008 where the recession was caused by people buying houses they couldn’t afford which led to the fall of the house market, leads to not having a high amount of sales and leads to extremely low sales after EPA Regulation Effective Dates.
  • 14. USA and Canada Market Locations Legend • AB Volvo • Volvo Trucks • Mack • Paccar Peterbilt Kenworth • Daimler Freightliner • Navistar International Locations
  • 15. Mexico Plant Locations Legend • Daimler Freightliner • Navistar International
  • 16. 3) Top OEM Profiles • AB VOLVO – Volvo Trucks and Mack • PACCAR – Peterbilt and Kenworth • DAIMLER – Freightliner • NAVISTAR – International
  • 17. AB Volvo Founded: 1915 Headquarters: Torslanda, Sweden CEO: Dennis Slagle 2011 Revenues: 310,367 Million Employees:15,427 (North America) Brands: Volvo Trucks, Mack Na Mfg. Locations: 6 (U.S) 1(Canada) Strategy: Volvo’s Reorganization of the companies structure to place increased focus on its sales and marketing of its units. The group is continuously focused on developing new high technology products for hybrid electric vehicles. Volvo I-shift and Mack mDrive gearboxes to be produced in the U.S engine plant in third quarter of 2012 Volvo
  • 18. AB Volvo • Volvo’s North American truck range includes all the Mack models and two heavy duty tractor series designed specifically for North America. Mack offers natural gas-powered versions of the Pinnacle, TerraPro and Granite models. • Volvo’s truck deliveries in North America, just like most Companies, follow a pattern of a steep decline in 2007 and a further decline during the 2008/09 recession before increasing again in 2010 and 2011. The Group increased its market share in North America in 2011 with the combined Volvo and Mack brands recording Just above 20% of the US heavy-duty market. • AB Volvo has Implemented improvements by having CEO focus on sales and marketing deparments.
  • 19. Paccar Founded:1905 Headquarters: Bellevue Washington(1969) CEO: Mark C. Pigott 2011 Revenues:15.3 Billion Employees:23,400 (All sites) Brands: Kenworth, Peterbilt, Daf, Leland NA Mfg. Locations: U.S.(3) Canada(1) Mexico(1) Strategy: Paccar promotes itself as a technology leader through the development and launch of hybrid- electric and hybrid-hydraulic trucks .Paccar is also focused on Developing Countries and Emerging markets in Asia, India, Brazil, and Russia (60% revenue is generated outside U.S) • A Major part of the company’s approach to developing its products and delivering its services has been the adoption of the ‘Six Sigma’ lean manufacturing programme which the company estimates had saved it more than US$1.5bn since 1997 when it first launched it. Paccar has implemented more than 7,600 Six Sigma projects and has also assisted several key suppliers to adopt the system. Paccar
  • 20. Paccar • Paccar is a leader in the design and manufacture of medium to heavy duty trucks. – The company has 73 consecutive years of net income – Commercial trucks and related replacement parts make up 90% of Revenue – Kenworth and Peterbilt have Options to have Day Cabs, and Sleeper Cabs .Peterbilt going even further to offer Extended cabs and Hybrid Models. • North American Sales – Paccar peaked in North America in 2006 and Europe in 2007, Paccar’s new truck deliveries fell dramatically to 48.5% of 2008 volume in 2009 before recovering to only 62.6% of 2008 volume in 2010. However, 2011 volume exceeded 2008 volume by nearly 10% to total 138,000 units in North America.
  • 21. Daimler Ag Founded: 1998 Headquarters: Auburn Hills, Michigan CEO: Dieter Zetsche 2011 Revenue:106,540 Brands: Freightliner, Western Star, Sterling, Thomas Built Employees:77,295 Strategy: Increase production in brazil, china, India and Russia as well as other emerging economies. Daimler Key Ratios
  • 22. Daimler Ag • Daimler Trucks North America manufactures and markets medium and heavy trucks under the Freightliner and Western Star brands as well as Mercedes-Benz Unimog special-duty trucks and Sprinter vans. – Daimler Truck Sales Climbed 47% In NA In 2011 – Daimler’s North American truck sales declined in 2008 and 2009 but increased 24.3% in 2010 and a further 87.7% in 2011 to return to 2007 volume again.
  • 23. Navistar Founded: 1902 Headquarters: Lisle, IL CEO: Daniel Ustian 2011 Revenues: 2,576.6 (U.S.) Employees: 19,000 Brands: International, MaxxForce, Monaco Coach, IC, and Work Horse Mfg. Locations: Strategy: Brand Strength. Portfolio expansion. Military. The percentage of revenue generated by the military declined 14% between 2009 and 2010, due in part to the switch in government spending priorities -- less for traditional combat vehicles and more for high-tech ISR (intelligence, surveillance, and reconnaissance) equipment. Navistar Key Ratios
  • 24. Navistar • Navistar has improved its cost structure and efficiency in each of its operational areas including the distribution systems in its parts business. It has also increased its manufacturing flexibility so that each manufacturing facility is capable of producing nearly every truck model. this reduces logistics costs, and also enables trucks to be manufactured close to customers. Navistar Truck Deliveries In the U.S. And Canada 2007 2008 2009 2010 2011 Military 1,700 8,700 7,900 4,600 3,700 Class 6 & 7 88,500 59,600 39,800 46,400 64,600 Class 8 (SD) 61,400 50,100 40,500 34,600 39400 Class 8 142,900 102,500 77,700 92,600 139,700 Total 294,500 220,900 159,600 175,000 247,400
  • 25. 0% 5% 10% 15% 20% 25% 30% 35% 40% 2007 2008 2009 2010 2011 Daimler Navistar Paccar Volvo US Class 8 Truck Market Shares 0% 10% 20% 30% 40% 50% 2007 2008 2009 2010 2011 Daimler Navistar Paccar Ford US Class 6&7 Market Shares
  • 26. Global Top 50 Manufacturers Company Sales Employees Gross Profit Margin Location Hyundai Motor Company 98,858.27M 57,857 Seoul, South Korea Chrysler Group LLC 54,981.00M 55,687 Auburn Hills, MI AB Volvo 45,003.22M 102,248 23.89%Torslanda, Sweden Mitsubishi Heavy Industries, Ltd. 34,993.66M 68,887 15.71%Tokyo, Japan Kia Motors Corporation 23,916.62M 32,636 Seoul, South Korea MAN SE 21,329.59M 52,542 21.56%Munich, Germany Isuzu Motors Limited 17,367.92M 24,656 15.23%Tokyo, Japan PACCAR Inc 16,355.20M 23,400 18.06%Bellevue, WA Hino Motors, Ltd. 16,307.46M 25,820 13.38%Hino, Tokyo, Japan Navistar International Corporatiom 13,958.00M 20,800 14.59%Lisle, IL Scania AB 12,714.47M 37,496 27.21%Södertälje, Sweden Beiqi Foton Motor Company Limited 8,113.54M 37,575 9.66%Beijing, China Oshkosh Corporation 7,584.70M 13,100 11.55%Oshkosh, WI Mitsubishi Fuso Truck & Bus Corporation 7,091.70M 12,000 Kawasaki, Kanagawa, Japan Mahindra & Mahindra Limited 6,366.30M 17,847 Mumbai, India Nissan Shatai Co., Ltd. 5,641.24M 4,310 Hiratsuka, Kanagawa, Japan Great Wall Motor Company Limited 4,772.19M 45,737 24.91%Baoding, Hebei, China Daimler Trucks North America LLC 3,823.40M 20,000 Portland, OR EvoBus GmbH 3,288.00M 8,000 Kirchheim Unter Teck, Baden-Württemberg, Germany Volvo Group Belgium NV 2,726.97M 2,962 Gent, Oost-Vlaanderen, Belgium UD Trucks Corporation 2,601.41M 3,377 Ageo, Saitama, Japan Ashok Leyland Limited 2,589.64M 15,734 Chennai, India Randon S.A. Implementos e Participaçoes 2,226.58M 4,321 22.36% Caxias Do Sul, Rio Grande do Sul, Brazil Bénéteau S.A. 1,333.64M 7,032 46.41% Saint-Gilles-Croix-Vie, France Zhengzhou Yutong Bus Co., Ltd. 1,312.47M 7,116 Zhengzhou, Henan, China
  • 27. Global Top 50 Manufacturers (cont.) Company Sales Employees Gross Profit Margin Location Marcopolo S.A. 1,171.92M 11,898 Caxias Do Sul, Rio Grande do Sul, Brazil Kenworth Mexicana, S.A. de C.V. 1,066.44M 1,992 Mexicali, B.C., Mexico New Flyer Industries Inc. 926.42M 2,100 11.01% Winnipeg, MB, Canada Pierce Manufacturing Inc. 916.00M 1,900 Appleton, WI Federal Signal Corporation 795.60M 2,900 24.87%Oak Brook, IL Rosenbauer International AG 789.40M 2,123 Leonding, Oberösterreich, Austria Mack Trucks, Inc. 736.00M 4,500 Greensboro, NC Scania (Great Britain) Limited 730.06M 1,439 Milton Keynes, United Kingdom Forest River, Inc. 716.60M 6,000 Elkhart, IN Iveco Czech Republic, a. s. 646.38M 1,989 Vysoke Myto, Czech Republic Volvo Trucks North America 563.90M 3,700 Greensboro, NC The Scott Fetzer Company 556.40M 4,609 Westlake, OH VOLVO POLSKA SP Z O O 550.08M 2,600 Wroclaw, Poland IVECO ARGENTINA S.A. 508.60M 951 Ciudad De Buenos Aires, Argentina Motor Coach Industries Limited 501.04M 2,400 Winnipeg, MB, Canada SOLARIS BUS & COACH S A 460.44M 2,200 Owinska, Poland New Flyer Industries Canada ULC 438.40M 2,100 Winnipeg, MB, Canada Spartan Motors, Inc. 426.01M 1,635 14.52%Charlotte, MI Iveco Limited 421.16M 158 Watford, Hertfordshire, United Kingdom Utility Trailer Manufacturing Company 412.70M 2,500 City Of Industry, CA Miller Industries, Inc. 412.66M 760 13.73%Ooltewah, TN Beijing General Coach Factory 411.87M 3,500 Beijing, China Daewoo Bus Corporation 354.16M 962 Buchon, Kyo, South Korea Sichuan Tengzhong Heavy Industrial Machinery Co., Ltd. 354.15M 1,930 Chengdu, Sichuan, China Sypris Solutions, Inc. 335.63M 1,360 12.08%Louisville, KY
  • 28. Top NA Tier Manufacturers • Robert Bosch – Starter, Control, and Injection systems • Johnson Controls – Optima Batteries – Varta Batteries – LTH Batteries – Heliar Batteries • Denso International America, Inc. • Magna International – Complete Seat systems – Cab-in-white stampings and assemblies made from aluminum and steel including design and development support – Composite products (hood, roof and exterior trim) and interior trim – Fuel & Battery Systems: Innovative fuel & battery systems • Cummins Inc. • Lear Corporation • Visteon Corporation • Tenneco • BorgWarner INC. • Federal Mogul Corporation
  • 29. Top Tier 1 Customers by Revenue Corporate Name Company Name Total North American Aftermarket Automotive Sales Total Global Automotive Aftermarket Sales Total Global Automotive Sales Bridgestone Corp. Bridgestone Americas Inc. $ 15.6 Billion (e) Not Available $ 36.70 Billion (e) Goodyear Tire & Rubber Co. Goodyear Tire & Rubber Co. $ 9.9 Billion (e) Not Available $ 22.80 Billion (e) The Michelin Group Michelin North America $ 7.2 Billion (e) Not Available $ 27.20 Billion (e) ExxonMobil ExxonMobil $ 6 Billion (e) $ 16.6 Billion (e) $ 19.50 Billion (e) Royal Dutch Shell plc Shell Oil Co. $ 4.59 Billion (e) $ 12.51 Billion (e) $ 15.31 Billion (e) Continental Corp. Continental Tire North America $ 3 Billion (e) Not Available $ 40.00 Billion (e) Cooper Tire & Rubber Co. Cooper Tire & Rubber Co. $ 2.8 Billion (e) Not Available $ 3.90 Billion (e) BP America BP $ 2.71 Billion (e) $ 9.63 Billion (e) $ 11.74 Billion (e) PPG Industries PPG Industries $ 2.38 Billion (e) $ 3.66 Billion (e) $ 5.08 Billion (e) Affinia Group Inc. Affinia Group Inc. $ 1.7 Billion (e) $ 2.4 Billion (e) $ 2.50 Billion (e) UCI-FRAM Group UCI-FRAM Group $ 1.68 Billion $ 1.81 Billion $ 2.00 Billion Federal-Mogul Corp. Federal-Mogul Corp. $ 1.6 Billion $ 2.3 Billion $ 6.90 Billion East Penn Manufacturing Co. East Penn Manufacturing Co. $ 1.25 Billion (e) Not Available Not Available Tenneco Inc. Tenneco Inc. $ 1.2 Billion $ 700 Million $ 7.20 Billion Exide Technologies Exide Technologies $ 900 Million $ 1.6 Billion $ 1.90 Billion The Sherwin-Williams Co. The Sherwin-Williams Co. $ 819.05 Million (e) $ 920.28 Million (e) $ 1.19 Billion (e) 3M 3M Automotive Aftermarket Division $ 793.25 Million (e) $ 2.07 Billion (e) $ 2.76 Billion (e) Standard Motor Products Inc. Standard Motor Products Inc. (SMP) $ 776 Million $ 794 Million $ 875.00 Million Tomkins Ltd. Gates Corp. $ 540 Million $ 1.01 Billion $ 2.00 Billion Dorman Products Inc. Dorman Products Inc. $ 529 Million $ 529 Million $ 529.00 Million Pirelli Tyre Pirelli Tire North America (PTNA) $ 500 Million (e) Not Available $ 7.40 Billion (e) Warren Distribution Inc. Warren Distribution Inc. $ 459 Million $ 459 Million $ 459.00 Million Remy International Inc. Remy International Inc. $ 458 Million (e) $ 556 Million (e) $ 1.20 Billion (e) NGK Spark Plug Co. Ltd. NGK Spark Plugs (U.S.A.) Inc. $ 450 Million Not Available $ 1.70 Billion Motorcar Parts of America Inc. MPA $ 400 Million $ 400 Million $ 400.00 Million SKF SKF VSM North AmericaSKF Automotive Division VSM Business Unit N.A. $ 350 Million $ 1 Billion $ 2.60 Billion
  • 30. Current Product Situation • Sales – We have gained small entry in the truck market and our requested products by sales as of June 2012 include: • Tesa 4174 High temperature Fine line Tape for design masking Backing PVC Film, natural rubber adhesive • Tesa 4244 Fine line tape for design masking Backing PVC, natural Rubber Adhesive • Tesa 54339 Precision Die Cuts for permanent Hole Covering applications, backing PET Film, acrylic adhesive • Tesa 4848 Surface Protection Film, PE film Backing, Acrylic adhesive, • Tesa 51136 Surface Protection and masking Tape, Acrylic Adhesive, PE Film Backing • Tesa 50530 Temporary protection tape for freshly painted surfaces Polyolefin film backing, EVA Adhesive
  • 31. Current Product Situation • Benefits – Manufacturers will buy our products in order to save money with quality products that could end up costing later down the road. A thorough testing for each customer and personal relations with customer contacts allow us to promise to give our customers the right to change the dimensions of our offerings according to their specific needs. Personal relationships with our customers allow us to continue having the right products and builds trust with every customer.
  • 32. Current Product Situation ttNABU Masking Automotive Data BU APG ITEM CUSTOMER NAMEFocus market Sales CM SALES LYCM Sales Dev to LYCM M1% CM SALES YTD SALES LYTD Sales Dev. to LYTD M1% YTD M1$ dev to LYTD 45 20 4174 FERGUSON ENTERPRISES -PORTLANDRV/Bus/Trucks & Other 1,013$ 955$ 106.0% 68.8% 4,950$ 3,694$ 134.0% 68.1% 130.4% FERGUSON ENTERPRISES -PORTLAND Total 1,013$ 955$ 106.0% 68.8% 4,950$ 3,694$ 134.0% 68.1% 130.4% PRECISION INDUSTRIES INC -TULSRV/Bus/Trucks & Other 1,133$ 2,095$ 54.1% 61.3% 4,404$ 7,742$ 56.9% 60.1% 57.1% PRECISION INDUSTRIES INC -TULS Total 1,133$ 2,095$ 54.1% 61.3% 4,404$ 7,742$ 56.9% 60.1% 57.1% 4174 Total 2,146$ 3,051$ 70.4% 64.8% 9,354$ 11,436$ 81.8% 64.3% 83.3% 4244 REPLENEX INCRV/Bus/Trucks & Other 4,147$ 3,131$ 132.5% 47.5% 19,485$ 17,602$ 110.7% 46.4% 108.3% REPLENEX INC Total 4,147$ 3,131$ 132.5% 47.5% 19,485$ 17,602$ 110.7% 46.4% 108.3% 4244 Total 4,147$ 3,131$ 132.5% 47.5% 19,485$ 17,602$ 110.7% 46.4% 108.3% 20 Total 6,294$ 6,181$ 101.8% 53.4% 28,839$ 29,038$ 99.3% 52.2% 96.7% 31 54339 NAVISTAR INC - BLUE DIAMOND TRRV/Bus/Trucks & Other -$ -$ 0.0% 0.0% -$ 11,363$ 0.0% 0.0% 0.0% NAVISTAR INC - BLUE DIAMOND TR Total -$ -$ 0.0% 0.0% -$ 11,363$ 0.0% 0.0% 0.0% 54339 Total -$ -$ 0.0% 0.0% -$ 11,363$ 0.0% 0.0% 0.0% 31 Total -$ -$ 0.0% 0.0% -$ 11,363$ 0.0% 0.0% 0.0% 32 4848 AB'S GLOVES & ABRASIVESRV/Bus/Trucks & Other 1,247$ 173$ 721.1% 49.0% 8,522$ 3,045$ 279.9% 48.1% 254.2% AB'S GLOVES & ABRASIVES Total 1,247$ 173$ 721.1% 49.0% 8,522$ 3,045$ 279.9% 48.1% 254.2% PRECISION INDUSTRIES INC -TULSRV/Bus/Trucks & Other -$ -$ 0.0% 0.0% -$ -$ 0.0% 0.0% 0.0% PRECISION INDUSTRIES INC -TULS Total -$ -$ 0.0% 0.0% -$ -$ 0.0% 0.0% 0.0% 4848 Total 1,247$ 173$ 721.1% 49.0% 8,522$ 3,045$ 279.9% 48.1% 254.2% 51136 BRON TAPES - SALT LAKE CITYRV/Bus/Trucks & Other 339$ -$ 0.0% 37.6% 2,829$ 2,958$ 95.7% 36.5% 86.0% BRON TAPES - SALT LAKE CITY Total 339$ -$ 0.0% 37.6% 2,829$ 2,958$ 95.7% 36.5% 86.0% BRON TAPES - SAN DIEGORV/Bus/Trucks & Other 438$ -$ 0.0% 49.3% 438$ -$ 0.0% 49.3% 0.0% BRON TAPES - SAN DIEGO Total 438$ -$ 0.0% 49.3% 438$ -$ 0.0% 49.3% 0.0% LOWRY MANUFACTURING - RICHMONDRV/Bus/Trucks & Other 4,051$ 1,840$ 220.1% 34.8% 20,017$ 5,745$ 348.4% 34.0% 282.2% LOWRY MANUFACTURING - RICHMOND Total 4,051$ 1,840$ 220.1% 34.8% 20,017$ 5,745$ 348.4% 34.0% 282.2% 51136 Total 4,827$ 1,840$ 262.3% 36.3% 23,284$ 8,702$ 267.6% 34.6% 222.9% 32 Total 6,075$ 2,013$ 301.7% 38.9% 31,807$ 11,747$ 270.8% 38.2% 232.6% 33 6973 CODESOURCE LLCRV/Bus/Trucks & Other -$ -$ 0.0% 0.0% 2,905$ -$ 0.0% 70.4% 0.0% CODESOURCE LLC Total -$ -$ 0.0% 0.0% 2,905$ -$ 0.0% 70.4% 0.0% 6973 Total -$ -$ 0.0% 0.0% 2,905$ -$ 0.0% 70.4% 0.0% 33 Total -$ -$ 0.0% 0.0% 2,905$ -$ 0.0% 70.4% 0.0% 98 50530 HUGHES ENTERPRISES OF NJ INCRV/Bus/Trucks & Other -$ 2,118$ 0.0% 0.0% -$ 2,118$ 0.0% 0.0% 0.0% HUGHES ENTERPRISES OF NJ INC Total -$ 2,118$ 0.0% 0.0% -$ 2,118$ 0.0% 0.0% 0.0% 50530 Total -$ 2,118$ 0.0% 0.0% -$ 2,118$ 0.0% 0.0% 0.0% 98 Total -$ 2,118$ 0.0% 0.0% -$ 2,118$ 0.0% 0.0% 0.0% 45 Total 12,368$ 10,312$ 119.9% 46.3% 63,550$ 54,265$ 117.1% 46.0% 93.8% Grand Total 12,368$ 10,312$ 119.9% 46.3% 63,550$ 54,265$ 117.1% 46.0% 93.8%
  • 33. New Product Opportunities • Acx Plus products like, Acx High Adhesion and Acx High Resistance can be used for tough applications as well as our PE foam tapes such as 62939 which hold a thicker quality. • Tesa 60953(51,52) Anti Slip safety Solution can be used to prevent damage for the driver of the vehicle.
  • 34. Recommended Applications • Poly-Ethylene Foams Vs. 3m VHB Applications – Our PE Foams Beat #m’s VHB applications because our application can endure cold shock • 1) Exterior Paint- – Fine line tape and Masking tape, painting 4244, 7386, 4309 • Flooring adhesive- – Double Sided Tapes 64620, 64621 • Roof bonding – -ACX Plus 707x- • Overlap Seam Bonding – PE Foams 62936 • Panel Bonding • Visor Fabric Bonding – - any tape 4934 6931 • Wall Panel Attachment – -none • Nameplate Attachment – PE foams 62939 • Ceiling Insulation Attachment – - double sided tapes4952,4968 • Reflector attachment – (none) • Warning labels – -none • Engine foil – --50565 • Wire Harnessing – -54900,50118,51026 pv9 • Labeling – -6931Pv2, 6937 pv6 • Interior mounting – 62875,62872 • Hole covering – -54657,54339 • Surface protection – -50530 pv3, 4848pv1 • Paper masking – -4318 pv2,4407(4244pv2, 7133_fl)Over Mask 4378,4379)
  • 35. Competitive situation 3m Company • Truck Assembly – 1) Roof Bonding – Bonding metal roof skins to truck body frame with 3M VHB Acrylic Foam Tapes, 3M Scotch-Weld Structural Adhesives and 3M Polyurethane and Hybrid Adhesive Sealants. – 2) Overlap Seam Bonding – Bonding overlap seams of metal skins of truck bodies with 3M VHB Acrylic Foam Tapes. – 3) Panel Bonding – 3M VHB Acrylic Foam Tapes and 3M Polyurethane and Hybrid Adhesive Sealants. – 4) Direct Glazing – Bonding of windows and windscreens with 3M Polyurethane and Hybrid Adhesive Sealants. – 5) Mirror Glass Bonding – Bonding exterior mirror glass to the mirror housing bezel with 3M Double Coated Foam Tapes. – 6) Visor Fabric Bonding – Bonding fabric to sun visor in truck cabs with 3M Scotch-Weld Water-based Adhesives. • Truck Attachment – 1) Wall Panel Attachment – Attach interior wall & ceiling panels to inside metal truck cabs with 3M Dual Lock Re-closable Fasteners. – 2) Nameplate Attachment – Bonding of nameplates to truck body with 3M Double Coated and Transfer Tapes. – 3) Ceiling Insulation Attachment – Attaching foam insulation to ceiling of truck cab prior to headliner installation with 3M ATG Transfer Tapes. – 4) Instrument Graphic Attachment – Attaching screen printed polycarbonate instrument cluster with 3M Laminating Adhesive Transfer Tapes 200MP. – 5) Reflector Attachment – Attaching reflectors to the trailer sides with 3M Double Coated Foam Tapes. (9086,9087,9088,9088fl)
  • 36. Competitive Situation • 3m. Warning Labels – 1) Warning Label – Attaching warning label on trailer with 3M Label Material 7931. – 2) Wire harness Label – Tracking labels on wiring harnesses used in truck cabs utilize 3M Label Material 7872. – 3) Warning Label – Attaching warning label on truck bodies with 3M Label Material 7931. • 3m Goals – Start to come up with solutions to EPA standards( some already launched in other industries) Product Quality • Dual Lock Fastener’s incorporate adhesive and Velcro • Very Well ++ Marketing Strategies Innovation • Color coated tapes for easy work site recognition • Doubling ways to mend to compete for quality – 3m dual lock reclosable fasteners – VHB tapes
  • 37. Competitive Situation Intertape Polymer Group • New products such as IPG’s AM (AquaMask) compete against our tape for the truck industry. The rubber-based adhesive provides secure adhesion to both painted and bare metals and plastics, yet removes cleanly without adhesive residue, paint “flaking” from backside, or surface staining. Applications targeted are painting for marine, bus truck and RV, as well as car. – Product solutions include the Orange MaskTM which is used for masking fiberglass, New Double sided tapes AFT 450W and G which are acrylic foam tapes for permanent applications, and other PE Foam Applications – Intertape will be closing a pressure sensitive tape mfg. plant in Richmond. • Intertape Polymer Group Goals – Revenue(786,737) Product Quality • Aqua Mask and Orange Mask(TBD) • (+) Compared to other competition quality is not as important as price Marketing Strategies Building brand and Image – Strategically partner with transportation carriers that participate in EPA approved incentive programs that reward fuel efficiency improvements and reductions in greenhouse gas emissions • Manufacturing Processes * – · Partnering with the Pressure Sensitive Tape Council to develop and implement Green Policy Capture and reuse solvent vapors produced in the manufacturing process
  • 38. Competitive Situation Shurtape • Significantly less products than the other competitors. Shurtape is not currently competing in permanent bonding applications for customers such a foam and double sided tapes. • Masking tapes have overall Low adhesion temperatures • Shurtape has temporary solutions for automotive but however no permanent solutions for the truck industry in range of specification applicable products. • Shurtape Goals Product Quality (-) -Some tape products have an expiration date when you have to use them by in order to get full usage out of them. Marketing Strategies (Low Baller) – Products come to the customer with a cheaper price with much lower quality overall – Rolls Come In Longer yard lengths( More for less Philosophy) – Pushing very low Level to be able to sell Directly to plant or Consumers
  • 39. Competitive Situation Indirect Competitors • Our indirect competitor strategies are going to make products to stop the use of tape our opportunity is to continue to make offerings that compete with traditional nut and bolt applications • The manufacture and distribution of products that compete for permanent bonding applications in the Truck industry that are not tape specific include: – Bolts, Rivet, and Fasteners Replacements in truck industry provide opportunity to use Double sided tapes for more permanent uses. Such as Bumper applications – Adhesive painting Applications can allow Tesa to be used for labeling
  • 40. Distribution Situation Distribution • Top Tier Distributers Worldwide (2012) – 1. Denso 37.5 thermal, powertrain control – 2. Robert Bosch 34.0 fuel injection, chassis systems – 3. Magna Int. MGa.TO 25.6 interiors, exteriors, gearboxes – 4. Continental (CONG.DE) 25.0 tires, brakes, telematics – 5. Delphi DPHIQ.PK 22.3 powertrain, electronics – 6. Aisin Seiki (7259.T) 21.7 body systems, brake & chassis – 7. Johnson Controls(JCI.N) 18.5 seating, interior electronics – 8. Faurecia (EPED.PA) 17.4 exhaust system, cockpits, doors – 9. Lear (LEA.N) 16.0 seats, instrument/door trim – 10. ZF Friedrichshafen 15.1 transmissions, steering, axles Projected in N.A • In 2-5 years it is expected that Delphi, Magna Johnson Controls, Faurecia, and Lear will move higher in the pole of Top distributers as design for hybrid vehicles change the interface of trucks Reason To Distribute Our Adhesives • Our PSA Tapes and other products are the most efficient technology to give the distributor and OEM’s notoriety • Our ability to negotiate prices via a Supplier contract will give an opportunity to treat our business seriously and give effective cost controls • Color labels will make user-ability more practical in warehouse/plant situations and would be more practical than other tape brands • Our ability to Adjust sizes to a particular end- user’s interest will allow distributors to gain higher percentages in successful Distributing
  • 41. Supply Chain Maps Parts/Tier1 OEM Dealer Converter Consumer Distributor • 3 supply Chain Opportunities provide better load time • Giving more options in logistics ensure success and less Outstanding accounts • Selling Direct in U.S and Distribution in Mexico and Canada
  • 42. Macro-Environment Situation • Demographic – Center on Budget and Policy Priorities 2011, Many states have cut school funding this year and Schools have started and may continue to start cutting budgets for school busses • Economic/Business Conditions – Overseas Trade manufacturers continue to look to emerging economies for growth to help facilitate overseas business – Safety Issues Public concerns over truck safety can lead to additional requirements for safety features from truck manufacturers and restrictions on truck travel in congested urban areas. Efforts can either increase costs or be seen as a competitive advantage • Technological – Hybrid Electric Vehicles ,Growing concerns over climate change and dependence on foreign oil prompted the U.S government to fund programs that develop alternative power sources for vehicles, which can be marketed as fuel savers. • Political and Legal – Stricter Emissions Compliance can increase production costs – (3/8/2012) Obama Offer’s $1 Billion Plan To Speed Alternative Fuel Vehicles-Obama Made a Speech At Daimler Trucks NA In Mount Holly offering company and family tax breaks to purchasers of biofuel, electric, or natural gas ,vehicles to help build fuel stations nearby and make it easier for automakers to sell. – The White House also announced the launch of “EV Everywhere”, A challenge program designed by the Department Of Energy to make electric vehicles as affordable and convenient as gasoline- powered vehicle for the average family within a decade.
  • 43. Strengths Weaknesses • The Quality of our Unique Selling Proposition is higher than our competitors . • Brand Loyalty – Dealing personally with customers gives us great relations with customers giving them the attention to detail that is needed • Control of distribution Arrangements – Continental regional strategy ensure optimal management and responsibility • Access to the latest technology and most efficient – Though we are a small company In NA the quality and innovation of our products speak for • Price – In an economy where most businesses are recovering the majority of OEM's are focused on using low price driven products .
  • 44. Opportunity and Issue Analysis • External Opportunities • New hybrid vehicles will need new solutions • Come up with solutions to help against EPA standards for OEM’s – Lighter weight of products in cars for fuel efficiency – Concentrate on Permanent Bonding solutions (steering wheel, dashboard covering applications, seat covers, belts) • External Threats – New Innovative trends in the industry that replace our tapes
  • 45. Opportunity solutions Key Issues • Decisions to be made – In Order to maximize on potential opportunities We need to come up with solutions to the EPA rule against all trucks to either reduce weight or add to the efficiency of gas consumption. – Most Companies are now starting to make hybrid vehicles allocated to fuel efficiency New designs and innovations will allow us to come up with new solutions for the industry . – Though rigorous, Permanent bonding solutions sold directly to OEM's can be the way to continue to secure revenue with customers. If not through permanent bonding we must find new ways to have returning customers not just based upon product quality alone. • Customer Opportunity Decisions to be made Contact Direct or Intimate with Specific Models for testing
  • 46. Product, Price, Promotion, and Placement • Product – To OEMs who are looking to reduce weight and over engineering, Tesa has many different solutions to make it easier for you to come up with simple cost effective solutions. Putting Quality First is the most efficient way to keep cost down. • It is important that we differentiate our quality and cost effectiveness towards our customers above our competitors Some ways to do so are… – Announcing Global Recognition and Awards – Working with R&D to test the quality of our product offerings versus our competitors – Having new information on competitor products for our sales teams
  • 47. Product, Price, Promotion, and Placement • Price-Higher Quality Tapes • Cost of production and distribution will have a effect on the profit margin. However our key is to gain long term contracts with customers. • It is Important that we do not overprice or underprice our tapes Pricing is based upon application and yard length. – Underprice- can lead to the customer thinking it is not of good quality – Overprice- can make the customer feeling like they are being “taken” • Buyers will typically order direct in advance – Percentage off of sales to pay within a certain amount of days can be used during low sales periods, This will increase brand awareness but not necessarily long term buyers • Perceived – Value Pricing Strategy • Performance • Image • Quality • Customer Support • Delivery
  • 48. Product, Price, Promotion, and Placement • Promotion – General Promotion Techniques- Push and Pull – Target Market Group: Experienced OEMs, 20 Year History – Revenue: • Place (Distribution) – OEM's Would direct order – In cases of low sales
  • 49. Objectives • Gain +7% of the market share by 2017(gain Footing). (708000) • Gain +5% Target Permanent bonding applications(Secure Business) • Gain +5% of New fuel efficient manufacturers of trucks(Increase future business)
  • 50. Marketing Strategy/Project Replace • Media – Advertising-Web Revisions and advertising on social media(LinkedIn) • Strategy – To create brand awareness, solutions, and innovations in the truck industry • Target top 5 Revenue OEM and Aftermarket Customer for 2012 – (T/B Manu)AB Volvo, Man SE Isuzu Motors Limited, Paccar Inc., Daimler Hino Motors Ltd. – (Auto-Part/Supplies Manu) Bosch, Continental AG, Johnson Controls Inc., Therm Air Australia PTY LTD, Denso Corporation • Perform demonstrational testing with products companies currently use against our pre-tested brands for durability/pricing – Secondary Competitors Included ( ___ ) – Ask for upcoming product contracts
  • 51. Execution Programs • 1) Gain Access with OEM Plants • 2) Note possible Solutions, and specifications (ex. Paint Bleeding, Sloppiness) • 3)Establish Key Contacts at OEM plants • 4)Gain specification requirements at head quarters • 5)Implement Changes
  • 52. ProForma P&L 0% 2% 4% 6% 8% 10% 12% 14% Year1 Year2 Year3 Year4 Year5 Tesa Currently Occupies 5.7% of the Market 2012-17
  • 53. Recommended Marketing Strategy Gain Access • Accumulate potential problems to fix at Plant • Present Powerpoint • Build Relationships Reach • Identify user specifics and value through process* • Give specialty product info. Challenge • Gain Requirements from HQ’s • Design Solutions Approve & Contact • Pass Specific Approvals • Stay in Contact to increase Relationship Value (Think Tesa First)
  • 54. Recommended Marketing Strategy • Focusing on quality against competitiors and for end users.Our PSA Tapes targeted for permanent applications and through supportive channels to increase efficiency. – Target End user and tier awareness on all products. – Offer testing with invitations to Sparta Plant – Become the leader in Permanent Bonding applications – Continue to Improve advertising reach for lower cost – Expand Marketing plan for specialty Trucks in 2013
  • 55. Recommended Marketing Strategy Strategy Marketing Srategy Grid Target Truck Brand Positioning Permanent Bonding Applications Business Objectives We want to gain +7% market share in 5 years Marketing Objectives New Product testing and Permanent Applications Product offering Productive Solutions
  • 56. Recommended Marketing Strategy Pricing Value Based Distribution We Drive The Process Directly to Oems and Tiers while also Giving our logistic partners options Brand Communication Tesa Is interested in Continuous improvement in line with customer goals Sales force Local Sales Force with Customer Support Help Customer care We Support Strategic/ Major Accounts Directly Medium and Small accounts get support from our partners (Tesa Incentives Program ) Rewarding Long term customers…Perks to Doing business ex. )
  • 57. Timeline Focus Action Target Completion Date Assortment Length Changes • Aligning Assortments For T&B • Launching Assortments January 2013 Double Sided Specs • Contact Head Quarters • Meet Specifications January 2013 Permanent Bonding • Updated website and advertising • Sales Force & Customer Support February 2013 Tesa Incentives Program • Discussion Workshop • Launch March 2013
  • 58. Timeline Focus Action Target Completion Date Double Sided Specifications • Volvo and Paccar Headquarter Tests April 2013 Meet Specifications Contact HeadQuarter April 2013 ACXplus & Other Double Sided Tapes Instruction Video Pamplets for customers and Launch May 2013
  • 59. Controls • Contingency Plan – Potential Problem Analysis • Meetings to keep Team up to date on current needs • Monitored Customer Visits By MCGR (4730) • Monthly Excel Sheet Entry On Progress Posted to an Online Retrievable database(ttna.net)
  • 60. Summary • Commercial Trucks is a mature market with increasing technical barriers into entry. Temporary applications such as masking are less technical and easily competed against. More permanent Solutions however are very technical and would require more research and development in to each model but would secure sales margins yearly with customer as OEM's are less likely to change permanent structural applications. Masking, PE Foams, and other double sided tapes would be some of our main applications against competitors. • Current challenges will include permanent applications such as metal to metal bonding that allow Tesa to prove its quality. As well as solutions to masking applications which may have increased pressure to lower price over quality. Current goals include Direct advertising to give customer awareness Of our applications as well a significant Increase in market share. With the right amount of research and development Tesa can be the company OEM's come to first for solutions.

Editor's Notes

  1. Curtain sider trailers Freightliner Market 52 Weeks times 5days a Week =260 times about 66 trucks a day= 17160 trucks made in a year times about $ of tape per truck External antenna used with rivets e.t.c Mirrors ~4 Top lights and emblems Back light are usually small about 4inches wide and circular held in with rivets etc Warning signs labels Internal Cab Visors Surface Protection Dash floor and doors Roof lining double sided tapes Holes in floor and walls. Internal trailer Walls Floor Foam For refrigerated trailer Trailer Adhesive in the bars on the inside of the truck Adhesive alongside only specialty trailers such as refrigerated or flatbeds (51.5) 36ft -53 ft Holes and Rivets for floor, side walls, Surface protection for the doors and for specialty products and dash….Currently uses taped off sheets of plastic with masking tape to stop think from being hit while working Hole covering solutions to the firewall and under the cab area trailer
  2. 200-300,000 spent on buses with masking tape at international and they make close to the average number of buses made per day 75-80 ( average Navistar, Inc. 300.90 million in sales Supreme Industries, Inc. Prevost Car Freightliner Ltd The Heil Co. Emergency One Inc Daimler Buses North America Ltd Rosenbauer America, LLC Blue Bird Corporation McNeilus Companies, Inc. Central States Fire Apparatus, LLC General Automotive Corporation T I C Investment Corp American LaFrance, LLC Gillig LLC International Industries, Inc. The Sutphen Corporation Daimler Buses North America Inc. Collins Industries, Inc. North American Bus Industries, Inc. E-ONE, Inc. Smeal Fire Apparatus Co. Metrotrans Corporation Groupe Honco Inc Gillig LLC Hayward, CA Triple E Canada Ltd Utilimaster Corporation Kubota Industrial Equipment Corporation Utilimaster Corporation Siemens Duewag Corporation Motor Coach Industries, Inc Dejana Truck & Utility Equipment Company, Inc. Collins Bus Corporation Trail King Industries, Inc. Vsv Group Inc, (a Delaware Corporation) M.A.N. Truck & Bus Corporation Tornado Combustion Technologies Allianz Madvac Inc Sst Truck Company LLC GVW Group LLC FORETRAVEL, INC. Hino Motors Canada, Ltd Krystal Infinity LLC Designline Corporation Workhorse Custom Chassis LLC Eldorado National (california), Inc. Walker Transport Autocar, LLC National Coach Corporation Florida Bus Unlimited, Inc. Crimson Fire, Inc. Oshkosh Specialty Vehicles, Inc. Valley Truck Parts, Inc. Designline Usa, LLC Daimler Buses North Carolina LLC Allianz Sweeper Company THE LOUIS BERKMAN COMPANY Sb Manufacturing, Inc. Prevost Car (us) Inc. New Flyer of America Inc. PREVOST CAR (US) INC. Bivouac Industries, Inc Ferrara Fire Apparatus, Inc., Eldorado National (kansas), Inc. Marmon Motor Company Inc Art's-Way Manufacturing Co., Inc. Super Vacuum Manufacturing Co., Inc. Overland Industries Inc Viking-Cives, Ltd Komfort Industries Inc Fort Garry Fire Trucks Ltd Coachworks Holdings Inc LDV, Inc. Vulcan Equipment Company Inc Vulcan International Inc TYMCO, Inc. Proterra Inc Tymco International, Inc. Oakridge Holdings, Inc. Mitsubishi Fuso Truck of America, Inc. Chance Rides Manufacturing, Inc. General Coach America Inc. Arkansas Bus Exchange Corp Vogue Coach Company Inc Blue Grizzly Truck and Equipment Limited Trackless Vehicles Limited Everest Equipment Co Eagle Coach Corporation SnowBear Limited Dodgen Industries, Inc. The Giles County Rescue Squad Beck Sales, Inc Hi-Tech Emergency Vehicle Service, Inc. Gerling and Associates, Inc. SOUTHWEST PRODUCTS CORPORATION Placer Fire Equipment Inc Dependable Truck And Tank Limited US Bus Corp. LMC Corporation Metalfab Ltd Henke Manufacturing Corporation Kovatch Corp. United Specialties, Inc. Liberty Coach, Inc. North Chicago, IL Vohl Inc Mobile Medical International Corporation 2457610 Canada Inc Petrofield Industries Inc Stettler, AB, Canada Tennant Company Direct Chassis, LLC Myers Coach Lines Inc JDR CORPORATION 8.00 million in sales
  3. All Other Competitive industries are referenced under the SIC Codes of 26720207 and 26720201.
  4. The medium- and heavy-duty truck market, replaying the scenario common in every month of 2011, soared in December, powered by a huge spike in Class 8 sales. December’s 46.3% jump was the fifth-biggest monthly gain of 2011, WardsAuto data shows. For the year, sales of big trucks in the U.S. rose 40.6%, to 306,189 units, from 2010’s 217,702. All but Class 4 posted gains in 2011. Class 8 grew the most for the month and the year, up a whopping 78.3% in December, and 59.9% for 2011. Every Class 8 manufacturer posted an increase last month, including Volvo Truck, whose namesake brand was up 170.1% from like-2010. The Volvo brand also was the segment’s leading gainer in 2011, up 108.8%. International posted the most modest increase of all Class 8 brands in 2011, up 33.4%. Daimler retained its title as Class 8 volume leader, selling 54,367, mostly Freightliner, units last year. Total medium-duty sales rose 12.2% in December, and 22.0% in 2011. Among gainers, Class 7’s growth was the smallest, with sales up 7.5% for the year. Segment volume slipped 2.6% below year-ago in December, as a 153.2% increase in Hino sales failed to offset declines at International and Ford. PACCAR’s Peterbilt notched the biggest rise in Class 7 for 2011, 48.1%, while an exiting General Motors lost 99.8% of its 2010 volume. International remained Class 7’s volume leader, although Ford and PACCAR chipped away at its market share. Class 6 sales grew more than 30% both for the month and year overall, with most brands in December posting triple-digit percentage gains, including Daimler’s Freightliner, up 182.4%. Freightliner also grew the most for the year, with segment sales up 125.2%. Parent Daimler gained 11.3 points of market share for the year, taken mostly from Class-6 volume-leader International. GM, abandoning another medium-duty segment, saw its Class 6 deliveries plunge 96.2%. Class 5 grew 17.1% in December, with a 322.6% increase at Daimler’s Mitsubishi Fuso outpacing mild declines at Isuzu and Chrysler. For 2011, Class 5 sales rose 37.1%, with Ford widening its segment lead to a 64.3% share from 2010’s 59.1%. But International grew the most year-on-year in volume, up 153.4% to 3,831 units. Class 4 was the only group to lose ground in 2011, with sales off 13.4% due to 97%-plus drops at GM and Hino, both exiting the sector, and declines at International and Ford. Isuzu again held Class 4’s top spot, selling more than 5,000 domestically built and imported trucks in 2011. In December, Class 4 sales rose 2.6%, with triple-digit percentage increases posted by several manufacturers. Class 8 inventories rose at the end of December, up roughly 10,000 units vs. like-2010. However, days’ supply slipped to 41 from 49 year-ago. Medium-duty inventory also spiked at the end of the year, with 77 days’ supply on 35,081 trucks on Dec. 31, up from like-2010’s 57 days and 23,283. In other big-truck news, Daimler says it will add 1,100 new jobs at its Cleveland, NC, plant by the end of 2012, as it goes to a second shift. Employment at the Freightliner Class 8 truck plant will grow 72% above current levels, with an additional 1,072 shop workers and 29 engineering and support staff forecast. Most jobs will be filled by workers laid off in 2009, Daimler says. Daily production rates at the plant are expected to double by October, and Daimler says it has at times had a 6-month backlog of orders of its Cascadia model to fill at its largest U.S. plant. The truck maker also will be adding 100 jobs this year at its nearby Gastonia, NC, logistics plant.
  5. The U.S. market share pie chart for the first three months of 2012 shows Freightliner with a 32.7 percent slice of Class 8, topping International’s 19.4 percent. Kenworth’s share for the year so far is 14.6 percent, followed by Peterbilt at 13.7. Volvo 10.7 holds percent and Mack 7.7 percent of Class 8 sales.
  6. See the Drastic Rise In South America- Most Firms are investing in South America and Europe because of the potential. Class 8 Trucks tend to stay above the classes 5-7. The September 11 attacks were responsible for the 01 recession, the 2008 recession was caused by people buying houses they couldn’t afford and wasn’t ready for the market to go down since they had little to no money down.
  7. Eastern Side Daimler Locations- Cleveland NC, Gastonia NC, HighPoint NC, Mt Holly NC, Portland Oregon, Gaffney Sc, santiago Tianguistenco Mexico, Coahuila Mexico.
  8. Bus Rapid Transit (BRT ) is a public transport concept specially developed for cities to meet growing transportation needs, to increase the efficiency of public transport and, in parallel, reduce fuel consumption and exhaust emissions. BRT comprises dedicated lanes for buses with a high service frequency and passenger capacity. BRT can be compared to public transport by rail regarding travelling time, service frequency, punctuality and capacity. The investment cost is as low as 5% of the amount required for an equivalent subway system. In addition, the process of developing and implementing a functional BRT system is significantly shorter. In addition, BRT is complemented with a system for real-time traffic monitoring and passenger information. The system also supplies traffic management with critical data about the vehicle including fuel consumption, distance and speed.
  9. Brazil plant started manufacturing in 2010 to be completed in 2013, Russia Also has a new plant underway.
  10. 4244 4309 4174 7496 pe foam 62934 934 936 sf 4848 51132 internal surface protection 4288 , anti skid public safety bumper rail internal external ,flooring 4965 inside of door panels get marked up pretty easily
  11. Well+ , Some tape products Have an expiration date when you have to use them by in order to get full usage out of them. (ex.
  12. This hidden approach to the demand chain guarantees that Tesa gets paid on time and can sell it products for more while having appropriate response time for special orders.
  13. Stm industries Inc. hickory NC, Morgan adhesives company, IPG us holding Inc., Nitto America’s Inc.., Celia corporation, M&C specialties Co., Scapa tapes incorporated north America, Oliver-tolas Healthcare packaging, Sic26720207,26720201
  14. *ex.Easy to apply, or instructions for users if there is room for error…. Having a representative call to check on product survey’s for products being purchased by customer and also inviting to customer related get together’s.