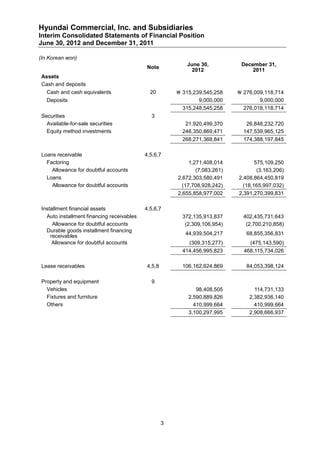
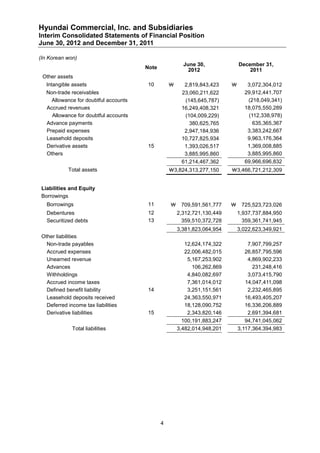
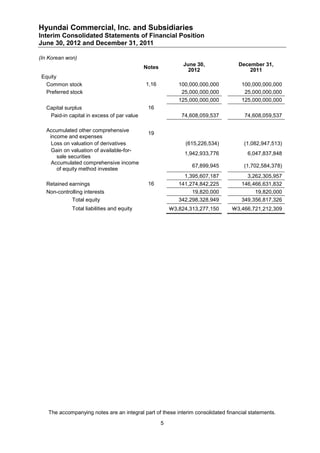
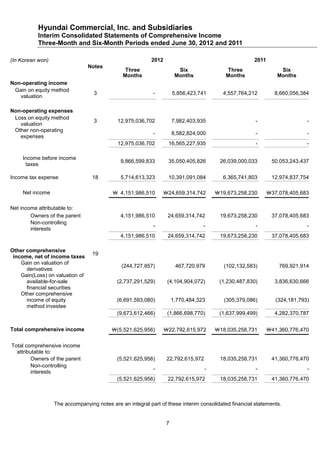
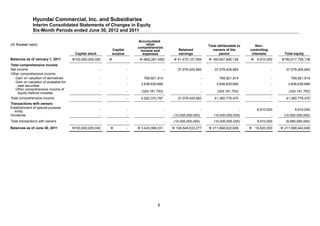
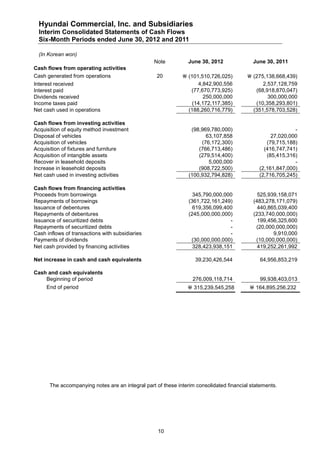
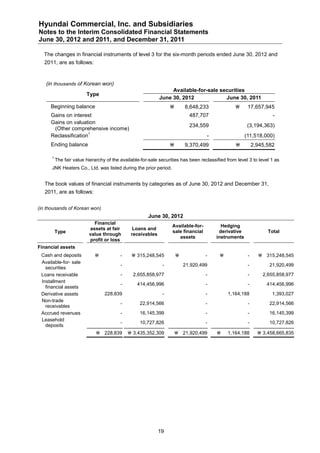
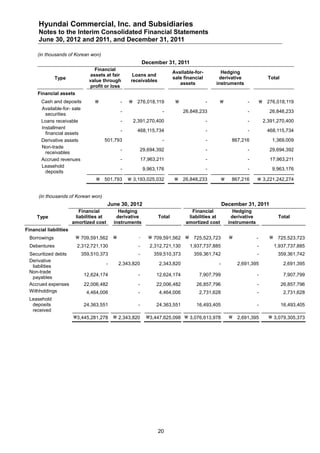
- Hyundai Commercial, Inc. and Subsidiaries released interim consolidated financial statements for the periods ended June 30, 2012 and 2011.
- For the six month period ended June 30, 2012, the company reported total operating revenue of ₩168.1 billion and net income of ₩24.7 billion.
- The statement of financial position as of June 30, 2012 showed total assets of ₩3,824.3 billion and total liabilities of ₩3,482 billion.
1. Hyundai Commercial, Inc. and
Subsidiaries
Interim Consolidated Financial Statements
June 30, 2012 and 2011
2. Hyundai Commercial, Inc. and Subsidiaries
Index
June 30, 2012 and 2011
Report on Review of Interim Financial Statements ..........................................................................1-2
Interim Consolidated Financial Statements
Interim Consolidated Statements of Financial Position .........................................................................3-5
Interim Consolidated Statements of Comprehensive Income................................................................6-7
Interim Consolidated Statements of Changes in Equity ....................................................................... 8-9
Interim Consolidated Statements of Cash Flows ....................................................................................10
Notes to the Interim Consolidated Financial Statements...................................................................11-34
3. Report on Review of Interim Financial Statements
To the Shareholders and Board of Directors of
Hyundai Commercial, Inc.
Reviewed Financial Statements
We have reviewed the accompanying interim consolidated financial statements of Hyundai
Commercial, Inc. (the Company) and its subsidiaries. These financial statements consist of
consolidated statement of financial position of the Company and its subsidiaries as of June 30,
2012, and the related consolidated statements of comprehensive income for the three-month
and the six-month periods ended June 30, 2012 and 2011, and statements of changes in
equity and cash flows for the six-month periods ended June 30, 2012 and 2011, and a
summary of significant accounting policies and other explanatory notes, expressed in Korean
won.
Management's Responsibility for the Financial Statements
Management is responsible for the preparation and fair presentation of these consolidated
financial statements in accordance with the International Financial Reporting Standards as
adopted by the Republic of Korea (Korean IFRS) 1034, Interim Financial Reporting, and for
such internal control as management determines is necessary to enable the preparation of
consolidated financial statements that are free from material misstatement, whether due to
fraud or error.
Auditor's Responsibility
Our responsibility is to issue a report on these interim consolidated financial statements based
on our reviews.
We conducted our reviews in accordance with the quarterly and semi-annual review
standards established by the Securities and Futures Commission of the Republic of Korea. A
review of interim financial information consists of making inquiries, primarily of persons
responsible for financial and accounting matters, and applying analytical and other review
procedures. A review is substantially less in scope than an audit conducted in accordance with
auditing standards generally accepted in the Republic of Korea and consequently does not
enable us to obtain assurance that we would become aware of all significant matters that
might be identified in an audit. Accordingly, we do not express an audit opinion.
1
4. Conclusion
Based on our reviews, nothing has come to our attention that causes us to believe the
accompanying interim consolidated financial statements do not present fairly, in all material
respects, in accordance with the Korean IFRS 1034, Interim Financial Reporting.
Emphasis of matter
We audited the consolidated statement of financial position as of December 31, 2011, and the
related statements of comprehensive income, changes in equity and cash flows for the year
ended December 31, 2011, in accordance with auditing standards generally accepted in the
Republic of Korea and expressed an unqualified opinion on those statements dated March 14,
2012. The statement of financial position as of December 31, 2011, presented herein for
comparative purposes, is consistent, in all material respects, with the above audited statement
of financial position as of December 31, 2011.
Review standards and their application in practice vary among countries. The procedures and
practices used in the Republic of Korea to review such consolidated financial statements may
differ from those generally accepted and applied in other countries. Accordingly, this report is
for use by those who are informed about Korean review standards and their application in
practice.
Seoul, Korea
August 24, 2012
This report is effective as of August 24, 2012, the review report date. Certain subsequent
events or circumstances, which may occur between the review report date and the time of
reading this report, could have a material impact on the accompanying interim consolidated
financial statements and notes thereto. Accordingly, the readers of the review report should
understand that there is a possibility that the above review report may have to be revised to
reflect the impact of such subsequent events or circumstances, if any.
2
5. Hyundai Commercial, Inc. and Subsidiaries
Interim Consolidated Statements of Financial Position
June 30, 2012 and December 31, 2011
(In Korean won)
June 30, December 31,
Note
2012 2011
Assets
Cash and deposits
Cash and cash equivalents 20 315,239,545,258 276,009,118,714
Deposits 9,000,000 9,000,000
315,248,545,258 276,018,118,714
Securities 3
Available-for-sale securities 21,920,499,370 26,848,232,720
Equity method investments 246,350,869,471 147,539,965,125
268,271,368,841 174,388,197,845
Loans receivable 4,5,6,7
Factoring 1,271,408,014 575,109,250
Allowance for doubtful accounts (7,083,261) (3,163,206)
Loans 2,672,303,580,491 2,408,864,450,819
Allowance for doubtful accounts (17,708,928,242) (18,165,997,032)
2,655,858,977,002 2,391,270,399,831
Installment financial assets 4,5,6,7
Auto installment financing receivables 372,135,913,837 402,435,731,643
Allowance for doubtful accounts (2,309,106,954) (2,700,210,858)
Durable goods installment financing
receivables 44,939,504,217 68,855,356,831
Allowance for doubtful accounts (309,315,277) (475,143,590)
414,456,995,823 468,115,734,026
Lease receivables 4,5,8 106,162,624,869 84,053,398,124
Property and equipment 9
Vehicles 98,408,505 114,731,133
Fixtures and furniture 2,590,889,826 2,382,936,140
Others 410,999,664 410,999,664
3,100,297,995 2,908,666,937
3
6. Hyundai Commercial, Inc. and Subsidiaries
Interim Consolidated Statements of Financial Position
June 30, 2012 and December 31, 2011
(In Korean won)
June 30, December 31,
Note 2012 2011
Other assets
Intangible assets 10 ₩ 2,819,843,423 ₩ 3,072,304,012
Non-trade receivables 23,060,211,622 29,912,441,707
Allowance for doubtful accounts (145,645,787) (218,049,341)
Accrued revenues 16,249,408,321 18,075,550,289
Allowance for doubtful accounts (104,009,229) (112,338,978)
Advance payments 380,625,765 635,365,367
Prepaid expenses 2,947,184,936 3,383,242,667
Leasehold deposits 10,727,825,934 9,963,176,364
Derivative assets 15 1,393,026,517 1,369,008,885
Others 3,885,995,860 3,885,995,860
61,214,467,362 69,966,696,832
Total assets ₩3,824,313,277,150 ₩3,466,721,212,309
Liabilities and Equity
Borrowings
Borrowings 11 ₩ 709,591,561,777 ₩ 725,523,723,026
Debentures 12 2,312,721,130,449 1,937,737,884,950
Securitized debts 13 359,510,372,728 359,361,741,945
3,381,823,064,954 3,022,623,349,921
Other liabilities
Non-trade payables 12,624,174,322 7,907,799,257
Accrued expenses 22,006,482,015 26,857,795,596
Unearned revenue 5,167,253,902 4,869,902,233
Advances 106,262,869 231,248,416
Withholdings 4,840,082,697 3,073,415,790
Accrued income taxes 7,361,014,012 14,047,411,098
Defined benefit liability 14 3,251,151,561 2,232,465,895
Leasehold deposits received 24,363,550,971 16,493,405,207
Deferred income tax liabilities 18,128,090,752 16,336,206,889
Derivative liabilities 15 2,343,820,146 2,691,394,681
100,191,883,247 94,741,045,062
Total liabilities 3,482,014,948,201 3,117,364,394,983
4
7. Hyundai Commercial, Inc. and Subsidiaries
Interim Consolidated Statements of Financial Position
June 30, 2012 and December 31, 2011
(In Korean won)
June 30, December 31,
Notes
2012 2011
Equity
Common stock 1,16 100,000,000,000 100,000,000,000
Preferred stock 25,000,000,000 25,000,000,000
125,000,000,000 125,000,000,000
Capital surplus 16
Paid-in capital in excess of par value 74,608,059,537 74,608,059,537
Accumulated other comprehensive
19
income and expenses
Loss on valuation of derivatives (615,226,534) (1,082,947,513)
Gain on valuation of available-for-
1,942,933,776 6,047,837,848
sale securities
Accumulated comprehensive income
67,899,945 (1,702,584,378)
of equity method investee
1,395,607,187 3,262,305,957
Retained earnings 16 141,274,842,225 146,466,631,832
Non-controlling interests 19,820,000 19,820,000
Total equity 342,298,328,949 349,356,817,326
Total liabilities and equity ₩3,824,313,277,150 ₩3,466,721,212,309
The accompanying notes are an integral part of these interim consolidated financial statements.
5
8. Hyundai Commercial, Inc. and Subsidiaries
Interim Consolidated Statements of Comprehensive Income
Three-Month and Six-Month Periods ended June 30, 2012 and 2011
(In Korean won) 2012 2011
Notes Three Six Three Six
Months Months Months Months
Operating revenue
Interest income ₩2,800,734,685 ₩5,572,386,120 ₩1,279,969,441 ₩ 2,387,169,557
Income on loans 68,177,970,017 133,313,505,392 59,945,849,276 113,805,600,081
Income on installment financial
10,977,195,309 23,040,822,533 15,401,001,549 31,475,076,372
receivables
Income on leases 1,896,785,538 3,574,663,299 1,092,108,442 2,335,488,860
Gain on disposal of loans 966,463,198 1,729,577,040 653,969,795 1,117,030,921
Gain on foreign exchange
- - 3,348,000,000 5,534,000,000
translations
Dividend income - 250,000,000 - 300,000,000
Other operating income 1,053,204,157 628,670,379 1,241,670,031 754,483,806
Total operating revenue 85,872,352,904 168,109,624,763 82,962,568,534 157,708,849,597
Operating expenses
Interest expenses 41,035,492,920 80,550,883,516 36,938,859,569 70,920,446,952
Bad debts expense 5 3,889,005,153 8,697,812,014 5,817,998,892 10,960,116,735
Loss on disposal of loans 464,015,511 1,079,502,006 148,596,245 286,474,469
Loss on foreign currency
880,000,000 27,500,000 825,500,346 1,962
transactions
General and administrative
17 15,581,238,326 29,866,953,086 13,278,632,714 27,065,419,592
expenses
Other operating expenses 1,180,964,459 1,854,810,141 1,123,744,947 1,549,202,834
Total operating
63,030,716,369 122,350,414,743 61,481,332,713 116,315,662,544
expenses
Operating income 22,841,636,535 45,759,210,020 21,481,235,821 41,393,187,053
6
9. Hyundai Commercial, Inc. and Subsidiaries
Interim Consolidated Statements of Comprehensive Income
Three-Month and Six-Month Periods ended June 30, 2012 and 2011
(In Korean won) 2012 2011
Notes
Three Six Three Six
Months Months Months Months
Non-operating income
Gain on equity method
3 - 5,856,423,741 4,557,764,212 8,660,056,384
valuation
Non-operating expenses
Loss on equity method
3 12,975,036,702 7,982,403,935 - -
valuation
Other non-operating
- 8,582,824,000 - -
expenses
12,975,036,702 16,565,227,935 - -
Income before income
9,866,599,833 35,050,405,826 26,039,000,033 50,053,243,437
taxes
Income tax expense 18 5,714,613,323 10,391,091,084 6,365,741,803 12,974,837,754
Net income ₩ 4,151,986,510 ₩24,659,314,742 ₩19,673,258,230 ₩37,078,405,683
Net income attributable to:
Owners of the parent 4,151,986,510 24,659,314,742 19,673,258,230 37,078,405,683
Non-controlling
- - - -
interests
4,151,986,510 24,659,314,742 19,673,258,230 37,078,405,683
Other comprehensive
19
income, net of income taxes
Gain on valuation of
(244,727,857) 467,720,979 (102,132,583) 769,921,914
derivatives
Gain(Loss) on valuation of
available-for-sale (2,737,291,529) (4,104,904,072) (1,230,487,830) 3,836,630,666
financial securities
Other comprehensive
income of equity (6,691,593,080) 1,770,484,323 (305,379,086) (324,181,793)
method investee
(9,673,612,466) (1,866,698,770) (1,637,999,499) 4,282,370,787
Total comprehensive income ₩(5,521,625,956) ₩22,792,615,972 ₩18,035,258,731 ₩41,360,776,470
Total comprehensive income
attributable to:
Owners of the parent (5,521,625,956) 22,792,615,972 18,035,258,731 41,360,776,470
Non-controlling
- - - -
interests
(5,521,625,956) 22,792,615,972 18,035,258,731 41,360,776,470
The accompanying notes are an integral part of these interim consolidated financial statements.
7
10. Hyundai Commercial, Inc. and Subsidiaries
Interim Consolidated Statements of Changes in Equity
Six-Month Periods ended June 30, 2012 and 2011
Accumulated
(In Korean won) other Total attributable to Non-
comprehensive
Capital income and Retained owners of the controlling
Capital stock surplus expenses earnings parent interests Total equity
Balances as of January 1, 2011 100,000,000,000 - (862,281,456) 81,470,127,594 180,607,846,138 9,910,000 180,617,756,138
Total comprehensive income
Net income - - - 37,078,405,683 37,078,405,683 - 37,078,405,683
Other comprehensive income
Gain on valuation of derivatives - - 769,921,914 - 769,921,914 - 769,921,914
Gain on valuation of available-for-
- - 3,836,630,666 - 3,836,630,666 - 3,836,630,666
sale securities
Other comprehensive income of
- - (324,181,793) - (324,181,793) - (324,181,793)
equity method investee
Total comprehensive income - - 4,282,370,787 37,078,405,683 41,360,776,470 - 41,360,776,470
Transactions with owners
Establishment of special purpose
- - - - - 9,910,000 9,910,000
entity
Dividends - - - (10,000,000,000) (10,000,000,000) - (10,000,000,000)
Total transactions with owners - - - (10,000,000,000) (10,000,000,000) 9,910,000 (9,990,090,000)
Balances as of June 30, 2011 100,000,000,000 - 3,420,089,331 108,548,533,277 211,968,622,608 19,820,000 211,988,442,608
8
11. Hyundai Commercial, Inc. and Subsidiaries
Interim Consolidated Statements of Changes in Equity
Six-Month Periods ended June 30, 2012 and 2011
Accumulated
(In Korean won) other Total attributable Non-
comprehensive
income and Retained to owners of the controlling
Capital stock Capital surplus expenses earnings parent interests Total equity
Balances as of January 1, 2012 125,000,000,000 74,608,059,537 3,262,305,957 146,466,631,832 349,336,997,326 19,820,000 349,356,817,326
Total comprehensive income
Net income - - - 24,659,314,742 24,659,314,742 - 24,659,314,742
Other comprehensive income
Gain on valuation of derivatives - - 467,720,979 - 467,720,979 - 467,720,979
Loss on valuation of available-for-
- - (4,104,904,072) - (4,104,904,072) - (4,104,904,072)
sale securities
Other comprehensive income of
- - 1,770,484,323 148,895,651 1,919,379,974 - 1,919,379,974
equity method investee
Total comprehensive income - - (1,866,698,770) 24,808,210,393 22,941,511,623 - 22,941,511,623
Transactions with owners
Dividends - - - (30,000,000,000) (30,000,000,000) - (30,000,000,000)
Total transactions with owners - - - (30,000,000,000) (30,000,000,000) - (30,000,000,000)
Balances as of June 30, 2012 125,000,000,000 74,608,059,537 1,395,607,187 141,274,842,225 342,278,508,949 19,820,000 342,298,328,949
The accompanying notes are an integral part of these interim consolidated financial statements.
9
12. Hyundai Commercial, Inc. and Subsidiaries
Interim Consolidated Statements of Cash Flows
Six-Month Periods ended June 30, 2012 and 2011
(In Korean won)
Note June 30, 2012 June 30, 2011
Cash flows from operating activities
Cash generated from operations 20 (101,510,726,025) (275,138,668,439)
Interest received 4,842,900,556 2,537,128,759
Interest paid (77,670,773,925) (68,918,870,047)
Dividends received 250,000,000 300,000,000
Income taxes paid (14,172,117,385) (10,358,293,801)
Net cash used in operations (188,260,716,779) (351,578,703,528)
Cash flows from investing activities
Acquisition of equity method investment (98,969,780,000) -
Disposal of vehicles 63,107,858 27,020,000
Acquisition of vehicles (76,172,300) (79,715,188)
Acquisition of fixtures and furniture (766,713,486) (416,747,741)
Acquisition of intangible assets (279,514,400) (85,415,316)
Recover in leasehold deposits 5,000,000 -
Increase in leasehold deposits (908,722,500) (2,161,847,000)
Net cash used in investing activities (100,932,794,828) (2,716,705,245)
Cash flows from financing activities
Proceeds from borrowings 345,790,000,000 525,939,158,071
Repayments of borrowings (361,722,161,249) (483,278,171,079)
Issuance of debentures 619,356,099,400 440,865,039,400
Repayments of debentures (245,000,000,000) (233,740,000,000)
Issuance of securitized debts - 199,456,325,600
Repayments of securitized debts - (20,000,000,000)
Cash inflows of transactions with subsidiaries - 9,910,000
Payments of dividends (30,000,000,000) (10,000,000,000)
Net cash provided by financing activities 328,423,938,151 419,252,261,992
Net increase in cash and cash equivalents 39,230,426,544 64,956,853,219
Cash and cash equivalents
Beginning of period 276,009,118,714 99,938,403,013
End of period 315,239,545,258 164,895,256,232
The accompanying notes are an integral part of these interim consolidated financial statements.
10
13. Hyundai Commercial, Inc. and Subsidiaries
Notes to the Interim Consolidated Financial Statements
June 30, 2012 and 2011, and December 31, 2011
1. General Information
Hyundai Commercial, Inc. (the Company) was established on March 27, 2007, by taking over all
the assets, liabilities, rights and obligations related with the loans of the industrial product division
of Hyundai Capital Services, Inc. and its installment financing and lease financing division. It is
engaged in installment financing, and leasing of facilities. The Company’s operations are
headquartered in Yeouido, Seoul. Its shareholders are as follows:
Shareholders Ownership
Hyundai Motor Company 50.00%
Myung-yi Chung 33.33%
Tae-young Chung 16.67%
Total 100.00%
The consolidated financial statements have been prepared and presented which included the
accounts of Hyundai Commercial, Inc., as the parent company according to the Korean IFRS
1027, and Commercial Auto First trust and SPC and another subsidiary(collectively the “Group”),
while Hyundai Card Co., Ltd. and Hyundai Life Insurance Co., Ltd. are accounted for under the
equity method.
Subsidiaries as of June 30, 2012 and December 31, 2011, are as follows. The Company has the
substantial power over the subsidiaries established as special purpose entities for asset
securitization even though its ownership interests over the subsidiaries do not exceed 50%.
June 30, 2012 December 31, 2011
Special Commercial Auto First Trust and SPC Commercial Auto First Trust and SPC
Purpose
Commercial Auto Second Trust and SPC Commercial Auto Second Trust and SPC
Entities
2. Summary of Significant Accounting Policies
2.1 Basis of Preparation
The Group’s interim consolidated financial statements for the six-month period ended June 30,
2012, have been prepared in accordance Korean IFRS 1034, ‘Interim Financial Reporting’. These
interim consolidated financial statements have been prepared in accordance with the Korean
IFRS standards and interpretations issued and effective or issued and early adopted as of June
30, 2012.
New standards, amendments and interpretations issued but not effective for the financial year
beginning January 1, 2012, and not early adopted by the Group are as follows:
11
14. Hyundai Commercial, Inc. and Subsidiaries
Notes to the Interim Consolidated Financial Statements
June 30, 2012 and 2011, and December 31, 2011
- Amendments to Korean-IFRS 1019, Employee Benefits
According to the amendments to Korean-IFRS 1019, Employee Benefits, the corridor method is
no longer permitted. Therefore, actuarial gains and losses on the defined benefit obligation are
recognized immediately under other comprehensive income. The amendment requires to
recognize immediately all past service costs. And the amendment replaces the interest cost on
the defined benefit obligation, and the expected return on plan assets with a net interest cost
based on the net defined benefit asset or liability and the discount rate measured at the
beginning of the year. This amendment will be effective for the Group as of January 1, 2013. The
Group is assessing the impact of application of the amended Korean-IFRS 1019 on its
consolidated financial statements.
- Enactment of Korean-IFRS 1113, Fair value measurement
Korean-IFRS 1113, Fair value measurement, aims to improve consistency and reduce complexity
by providing a precise definition of fair value and a single source of fair value measurement and
disclosure requirements for use across Korean-IFRS. Korean-IFRS 1101 does not extend the use
of fair value accounting but provides guidance on how it should be applied where its use is
already required or permitted by other standards within Korean-IFRS. This amendment will be
effective for the Group as of January 1, 2013, and the Group expects that it would not have a
significant impact on the Group.
- Enactment of Korean-IFRS 1001, Presentation of Financial Statements
According to the amendments to Korean-IFRS 1001, 'Presentation of Financial Statements',
items of other comprehensive income present as two groups depending on whether it will be
reclassified subsequently to profit or loss or not. An entity shall apply those amendments for
annual periods beginning on or after July 1, 2012, and earlier application is permitted. The Group
expects that it would not have a significant impact on the Group.
2.2 Accounting Policies
The following is a summary of significant accounting policies followed by the Group in the
preparation of its interim consolidated financial statements. These policies have been consistently
applied to all the periods presented, unless otherwise stated.
Interim period income tax expense is calculated by applying estimated average annual effective
tax rate to the interim period’s pre-tax income.
12
15. Hyundai Commercial, Inc. and Subsidiaries
Notes to the Interim Consolidated Financial Statements
June 30, 2012 and 2011, and December 31, 2011
3. Securities
Securities as of June 30, 2012 and December 31, 2011, are as follows:
(in thousands of Korean won)
Type June 30, 2012 December 31, 2011
Available-for-sale securities
Marketable equity
securities 12,550,000 18,200,000
Equity securities
Unlisted equity
securities
3,257,412 3,083,604
Sub-total 15,807,412 21,283,604
Debt securities 6,113,087 5,564,629
Sub-total 21,920,499 26,848,233
Equity method investments 246,350,869 147,539,965
268,271,369 174,388,198
Available-for-sale securities
Available-for-sale securities as of June 30, 2012 and December 31, 2011, are as follows:
(in thousands of Korean won)
Book value
Number of Ownership Acquisition June 30, December
shares (%) cost 2012 31, 2011
Marketable equity securities
JNK Heaters Co.,
Ltd.
1,000,000 12.5 10,126,881 12,550,000 18,200,000
Unlisted equity securities
1
Leehan Corp. 136,000 12.3 3,199,762 3,256,792 3,082,984
Isung Eng,. Corp. 62 620 620 620
Debt securities
2
Leehan Corp. - - 5,469,801 6,113,087 5,564,629
18,797,064 21,920,499 26,848,233
1
The fair value of the securities for Leehan Corp. was valued as the valuation price provided by an external
appraiser, Korea Asset Pricing. The external appraisers valuated the fair value as the average of valuation
prices using the discounted cash flow model and the imputed market value model.
2
Those debt securities are the convertible bond issued by Leehan Corp. during the period, and the fair
value of the convertible bond for Leehan Corp. was valued as the valuation price provided by an external
appraiser, Korea Asset Pricing. The differences between the fair value of convertible bond and the book
value of normal bond by effective interest rate recognized in the gain or loss on valuation of debt securities
and the fluctuation of conversion right and advanced redemption right recognized in the gain or loss on
embedded derivatives.
13
16. Hyundai Commercial, Inc. and Subsidiaries
Notes to the Interim Consolidated Financial Statements
June 30, 2012 and 2011, and December 31, 2011
Equity method investments
Equity method investments as of June 30, 2012 and December 31, 2011, are as follows:
(in thousands of Korean won)
June 30, 2012
Number of Ownership Acquisition Net asset
Book value
shares (%) cost value
Hyundai Card Co.,
Ltd.
1 8,889,622 5.54 113,820,162 116,666,848 153,593,598
Hyundai Life
Insurance Co., 7,613,060 38.73 98,969,780 56,043,454 92,757,271
2
Ltd.
Total 212,789,942 172,710,302 246,350,869
1
The Company’s shareholdings in Hyundai Card Co., Ltd. are less than 20%. However, the Company is
able to participate in the management and significantly influence the financial and operating processes.
Thus, the equity method is applied.
2
The Group acquired the equity securities of Hyundai Life Insurance Co., Ltd. during the current period.
(in thousands of Korean won)
December 31, 2011
Number of Ownership Acquisition Net asset
Book value
shares (%) cost value
Hyundai Card Co.,
Ltd.
1 8,889,622 5.54 113,820,162 110,613,215 147,539,965
Valuations of equity method investment for the six-month periods ended June 30, 2012 and 2011,
are as follows:
(in thousands of Korean won)
June 30, 2012
Changes in
accumulated Changes in
Beginning Gain on Ending
Acquisition other retained
Balance valuation Balance
comprehensive earnings
income
Hyundai
Card Co., 147,539,965 - 5,856,424 197,209 - 153,593,598
Ltd.
Hyundai Life
Insurance - 98,969,780 (7,982,404) 1,620,999 148,896 92,757,271
Co,. Ltd.
Total 147,539,965 98,969,780 (2,125,980) 1,818,208 148,896 246,350,869
(in thousands of Korean won)
June 30, 2011
Changes in
accumulated Changes in
Beginning Gain on Ending
Acquisition other retained
Balance valuation Balance
comprehensive earnings
1
income( )
Hyundai
Card Co., 133,160,973 - 8,660,056 (415,618) (1,097) 141,404,314
Ltd.
1
( ) Changes in accumulated other comprehensive income is the amount before income taxes.
14
17. Hyundai Commercial, Inc. and Subsidiaries
Notes to the Interim Consolidated Financial Statements
June 30, 2012 and 2011, and December 31, 2011
The assets and liabilities as of June 30, 2012 and December 31, 2011, and revenue and income for
the six-month periods ended June 30, 2012 and 2011, follow :
(in thousands of Korean won)
June 30, 2012
Year end Operating
Assets Liabilities Net income
revenue
Hyundai Card
December 31 11,083,975,683 8,978,009,491 1,234,977,718 105,713,461
Co., Ltd.
Hyundai Life
Insurance June 30 3,530,425,026 3,385,737,691 257,338,314 (3,991,872)
Co,. Ltd.
As Hyundai Life Insurance Co,. Ltd.’s fiscal year is from April 1, 2012 to March 31, 2013, the
asset and liability amounts are as of June 30, 2012, and its operating revenue and net income
amounts are from January 1, 2012 to June 30, 2012. The deemed acquisition date is February
29, 2012, and the investee recognized its net income of 13,891,570 thousand after deemed
acquisition date.
(in thousands of Korean won)
December 31, 2011 June 30, 2011
Year end Operating
Assets Liabilities Net income
revenue
Hyundai Card
December 31 10,851,933,716 8,855,250,685 2,407,597,301 238,647,582
Co., Ltd.
4. Financial Receivables
Financial receivables as of June 30, 2012 and December 31, 2011, are as follows:
(in thousands of Korean won)
June 30, 2012
Deferred loan
origination fees Present Allowance
Principal and costs value for doubtful Book value
(Initial direct costs discounts accounts
for lease assets)
Loan receivables
Factoring
1,271,408 - - (7,083) 1,264,325
receivables
Loans 2,643,485,970 28,982,904 (165,294) (17,708,928) 2,654,594,652
2,644,757,378 28,982,904 (165,294) (17,716,011) 2,655,858,977
Installment financial assets
Auto 371,208,446 927,468 - (2,309,107) 369,826,807
Durable goods 45,286,917 (347,413) - (309,315) 44,630,189
416,495,363 580,055 - (2,618,422) 414,456,996
Lease receivables
15
18. Hyundai Commercial, Inc. and Subsidiaries
Notes to the Interim Consolidated Financial Statements
June 30, 2012 and 2011, and December 31, 2011
Finance lease
106,967,691 (12,930) - (792,136) 106,162,625
receivables
3,168,220,432 29,550,029 (165,294) (21,126,569) 3,176,478,598
(in thousands of Korean won)
December 31, 2011
Deferred loan
origination fees Present Allowance
Principal and costs value for doubtful Book value
(Initial direct costs discounts accounts
for lease assets)
Loan receivables
Factoring 575,109 - - (3,163) 571,946
Loans 2,390,384,894 18,629,791 (150,234) (18,165,997) 2,390,698,454
2,390,960,003 18,629,791 (150,234) (18,169,160) 2,391,270,400
Installment financial assets
Auto 402,751,465 (315,733) - (2,700,211) 399,735,521
Durable goods 69,532,615 (677,259) - (475,143) 68,380,213
472,284,080 (992,992) - (3,175,354) 468,115,734
Lease receivables
Finance lease
84,693,337 (19,542) - (620,397) 84,053,398
receivables
2,947,937,420 17,617,257 (150,234) (21,964,911) 2,943,439,532
5. Allowance for Doubtful Accounts
Changes in allowance for doubtful accounts for the six-month periods ended June 30, 2012 and
2011, are as follows:
(in thousands of Korean won)
June 30, 2012
Loan Installment Lease
Type Other assets Total
receivables financial assets receivables
Beginning balance 18,169,160 3,175,354 620,397 330,388 22,295,299
Amounts written off (1,837,601) (168,041) - - (2,005,642)
Recoveries of amounts
(6,976,948) (492,415) (29,269) - (7,498,632)
previously written off
Unwinding of discount (100,809) (11,804) - - (112,613)
Additional(reversed)
8,462,209 115,328 201,008 (80,733) 8,697,812
allowance
Ending balance 17,716,011 2,618,422 792,136 249,655 21,376,224
(in thousands of Korean won)
June 30, 2011
Loan Installment Lease
Type Other assets Total
receivables financial assets receivables
Beginning balance 12,795,689 3,609,027 214,613 372,974 16,992,303
Amounts written off (1,491,516) (108,512) - - (1,600,028)
Recoveries of amounts
(3,811,733) (790,425) (6,798) - (4,608,956)
previously written off
16
19. Hyundai Commercial, Inc. and Subsidiaries
Notes to the Interim Consolidated Financial Statements
June 30, 2012 and 2011, and December 31, 2011
Unwinding of discount (52,619) (6,935) (108) - (59,662)
Additional allowance 9,493,981 1,218,413 233,221 14,502 10,960,117
Ending balance 16,933,802 3,921,568 440,928 387,476 21,683,774
6. Financial Instruments
The fair values of financial instruments as of June 30, 2012 and December 31, 2011, are as follows:
(in thousands of Korean won)
June 30, 2012 December 31, 2011
Type Book Fair Book Fair
value value value value
Financial assets
Cash and deposits 315,248,545 315,248,545 276,018,119 276,018,119
Available-for-sale
21,920,499 21,920,499 26,848,233 26,848,233
securities
Loans receivable 2,655,858,977 2,658,605,196 2,391,270,400 2,398,975,565
Installment financial
414,456,996 417,786,700 468,115,734 473,294,235
assets
Derivative assets 1,393,027 1,393,027 1,369,009 1,369,009
Non-trade
22,914,566 22,914,566 29,694,392 29,694,392
receivables
Accrued revenues 16,145,399 16,145,399 17,963,211 17,963,211
Leasehold deposits 10,727,826 10,705,059 9,963,176 9,861,028
3,458,665,835 3,464,718,991 3,221,242,274 3,234,023,792
Financial liabilities
Borrowings 709,591,562 715,773,727 725,523,723 730,010,502
Debentures 2,312,721,130 2,367,471,040 1,937,737,885 1,983,599,328
Securitized debts 359,510,373 367,830,150 359,361,742 367,266,231
Derivative liabilities 2,343,820 2,343,820 2,691,395 2,691,395
Non-trade payables 12,624,174 12,624,174 7,907,799 7,907,799
Accrued expenses 22,006,482 22,006,482 26,857,796 26,857,796
1
Withholdings 4,464,006 4,464,006 2,731,628 2,731,628
Leasehold deposits
24,363,551 24,740,460 16,493,405 16,677,090
received
3,447,625,098 3,517,253,859 3,079,305,373 3,137,741,769
1
Excluding taxes.
17
20. Hyundai Commercial, Inc. and Subsidiaries
Notes to the Interim Consolidated Financial Statements
June 30, 2012 and 2011, and December 31, 2011
The fair value hierarchy of financial assets and liabilities carried at fair value as of June 30, 2012
and December 31, 2011, are as follows:
(in thousands of Korean won)
June 30, 2012
1
Book Fair Fair value hierarchy
Type
value value level 1 level 2 level 3
Financial assets at fair
value
Available-for-sale
21,920,499 21,920,499 12,550,000 - 9,370,499
securities
Derivative assets 1,393,027 1,393,027 - 1,393,027 -
23,313,526 23,313,526 12,550,000 1,393,027 9,370,499
Financial liabilities at
fair value
Derivative liabilities 2,343,820 2,343,820 - 2,343,820 -
1
The levels of fair value hierarchy have been defined as follows:
Level 1: Quoted prices in active markets for identical assets or liabilities. Listed stocks and derivatives
Level 2: Inputs for the asset or liability included within valuation techniques that are observable market
data. Most bonds issued in Korean won and foreign currency, general unlisted derivatives like swap,
forward, option
Level 3: Inputs for the asset or the liability that are not based on observable market data. Unlisted stocks,
complicated structured bonds, complicated unlisted derivatives and others.
(in thousands of Korean won)
December 31, 2011
1
Book Fair Fair value hierarchy
Type
value value level 1 level 2 level 3
Financial assets at fair
value
Available-for-sale
26,848,233 26,848,233 18,200,000 - 8,648,233
securities
Derivative assets 1,369,009 1,369,009 - 1,369,009 -
28,217,242 28,217,242 18,200,000 1,369,009 8,648,233
Financial liabilities at
fair value
Derivative liabilities 2,691,395 2,691,395 - 2,691,395 -
18
21. Hyundai Commercial, Inc. and Subsidiaries
Notes to the Interim Consolidated Financial Statements
June 30, 2012 and 2011, and December 31, 2011
The changes in financial instruments of level 3 for the six-month periods ended June 30, 2012 and
2011, are as follows:
(in thousands of Korean won)
Available-for-sale securities
Type
June 30, 2012 June 30, 2011
Beginning balance 8,648,233 17,657,945
Gains on interest 487,707 -
Gains on valuation
234,559 (3,194,363)
(Other comprehensive income)
1
Reclassification - (11,518,000)
Ending balance 9,370,499 2,945,582
1
The fair value hierarchy of the available-for-sale securities has been reclassified from level 3 to level 1 as
JNK Heaters Co., Ltd. was listed during the prior period.
The book values of financial instruments by categories as of June 30, 2012 and December 31,
2011, are as follows:
(in thousands of Korean won)
June 30, 2012
Financial
Available-for- Hedging
assets at fair Loans and
Type sale financial derivative Total
value through receivables
assets instruments
profit or loss
Financial assets
Cash and deposits - 315,248,545 - - 315,248,545
Available-for- sale
- - 21,920,499 - 21,920,499
securities
Loans receivable - 2,655,858,977 - - 2,655,858,977
Installment
- 414,456,996 - - 414,456,996
financial assets
Derivative assets 228,839 - - 1,164,188 1,393,027
Non-trade
- 22,914,566 - - 22,914,566
receivables
Accrued revenues - 16,145,399 - - 16,145,399
Leasehold
- 10,727,826 - - 10,727,826
deposits
228,839 3,435,352,309 21,920,499 1,164,188 3,458,665,835
19
22. Hyundai Commercial, Inc. and Subsidiaries
Notes to the Interim Consolidated Financial Statements
June 30, 2012 and 2011, and December 31, 2011
(in thousands of Korean won)
December 31, 2011
Financial
Available-for- Hedging
assets at fair Loans and
Type sale financial derivative Total
value through receivables
assets instruments
profit or loss
Financial assets
Cash and deposits - 276,018,119 - - 276,018,119
Available-for- sale
- - 26,848,233 - 26,848,233
securities
Loans receivable - 2,391,270,400 - - 2,391,270,400
Installment
- 468,115,734 - - 468,115,734
financial assets
Derivative assets 501,793 - - 867,216 1,369,009
Non-trade
- 29,694,392 - - 29,694,392
receivables
Accrued revenues - 17,963,211 - - 17,963,211
Leasehold
- 9,963,176 - - 9,963,176
deposits
501,793 3,193,025,032 26,848,233 867,216 3,221,242,274
(in thousands of Korean won)
June 30, 2012 December 31, 2011
Financial Hedging Financial Hedging
Type liabilities at derivative Total liabilities at derivative Total
amortized cost instruments amortized cost instruments
Financial liabilities
Borrowings 709,591,562 - 709,591,562 725,523,723 - 725,523,723
Debentures 2,312,721,130 - 2,312,721,130 1,937,737,885 - 1,937,737,885
Securitized debts 359,510,373 - 359,510,373 359,361,742 - 359,361,742
Derivative
- 2,343,820 2,343,820 - 2,691,395 2,691,395
liabilities
Non-trade
12,624,174 - 12,624,174 7,907,799 - 7,907,799
payables
Accrued expenses 22,006,482 - 22,006,482 26,857,796 - 26,857,796
Withholdings 4,464,006 - 4,464,006 2,731,628 - 2,731,628
Leasehold
deposits 24,363,551 - 24,363,551 16,493,405 - 16,493,405
received
3,445,281,278 2,343,820 3,447,625,098 3,076,613,978 2,691,395 3,079,305,373
20
23. Hyundai Commercial, Inc. and Subsidiaries
Notes to the Interim Consolidated Financial Statements
June 30, 2012 and 2011, and December 31, 2011
7. Derecognition of financial assets
The Group issued securitized debts based on loans and installment financial assets. Related
securitized debts have right of recourse about basic assets.
Details of transferred financial assets not derecognized as of June 30, 2012 and December 31, 2011,
are as follows:
(in thousands of Korean won)
Type June 30, 2012 December 31, 2011
Book value of assets
Loan receivable 555,419,654 466,479,102
Installment financial assets 62,167,008 97,302,634
Sub total 617,586,662 563,781,736
Book value of related liabilities 359,510,373 359,361,742
Liabilities having right of resource on transferred assets :
Fair value of assets 618,660,422 566,361,232
Fair value of related liabilities (367,830,150) (367,266,231)
Net position 250,830,272 199,095,001
8. Finance Lease Receivables
Details of total lease investments and present value of minimum lease receipts as of June 30,
2012 and December 31, 2011, are as follows:
(in thousands of Korean won)
June 30, 2012 December 31, 2011
Present value of Present value of
Type Total lease Total lease
minimum lease minimum lease
investments investments
receipts receipts
Less than 1 year 46,254,326 40,175,517 38,319,151 33,136,156
1 to 5 years 71,138,888 66,779,244 55,204,893 51,537,639
117,393,214 106,954,761 93,524,044 84,673,795
Details of unearned interest income as of June 30, 2012 and December 31, 2011, are as follows:
(in thousands of Korean won)
Type June 30, 2012 December 31, 2011
Total lease investments 117,393,214 93,524,044
Net lease investments
Minimum lease receipts
106,954,761 84,673,795
(present value)
Unguaranteed residual value
- -
(present value)
21
24. Hyundai Commercial, Inc. and Subsidiaries
Notes to the Interim Consolidated Financial Statements
June 30, 2012 and 2011, and December 31, 2011
106,954,761 84,673,795
Unearned interest income 10,438,453 8,850,249
9. Property and Equipment
Property and equipment as of June 30, 2012 and December 31, 2011, consist of:
(in thousands of Korean won)
June 30, 2012 December 31, 2011
Type Acquisition Accumulated Acquisition Accumulated
Book value Book value
cost depreciation cost depreciation
Vehicles 235,097 (136,688) 98,409 238,639 (123,908) 114,731
Fixture and
7,678,421 (5,087,532) 2,590,889 7,065,590 (4,682,654) 2,382,936
furniture
Others 411,000 - 411,000 411,000 - 411,000
8,324,518 (5,224,220) 3,100,298 7,715,229 (4,806,562) 2,908,667
Changes in property and equipment for the six-month periods ended June 30, 2012 and 2011, are
as follows:
(in thousands of Korean won)
June 30, 2012
Type Beginning balance Acquisition Disposal Depreciation Ending balance
Vehicles 114,731 76,172 (61,447) (31,047) 98,409
Fixture and
2,382,936 766,713 (87,386) (471,374) 2,590,889
furniture
Others 411,000 - - - 411,000
2,908,667 842,885 (148,833) (502,421) 3,100,298
(in thousands of Korean won)
June 30, 2011
Type Beginning balance Acquisition Disposal Depreciation Ending balance
Vehicles 119,066 79,715 (22,673) (31,547) 144,561
Fixture and
1,986,277 416,748 (48,895) (640,518) 1,713,612
furniture
Others 411,000 - - - 411,000
2,516,343 496,463 (71,568) (672,065) 2,269,173
22
25. Hyundai Commercial, Inc. and Subsidiaries
Notes to the Interim Consolidated Financial Statements
June 30, 2012 and 2011, and December 31, 2011
10. Intangible Assets
Intangible assets as of June 30, 2012 and December 31, 2011, consist of:
(in thousands of Korean won)
June 30, 2012 December 31, 2011
Type Acquisition Accumulated Book Acquisition Accumulated Book
cost depreciation value cost depreciation value
Software 5,866,268 (4,642,484) 1,223,784 5,637,719 (4,331,112) 1,306,607
Other intangible
2,230,097 (634,038) 1,596,059 2,179,131 (413,434) 1,765,697
assets
8,096,365 (5,276,522) 2,819,843 7,816,850 (4,744,546) 3,072,304
Changes in intangible assets for the six-month periods ended June 30, 2012 and 2011, are as
follows:
(in thousands of Korean won)
June 30, 2012
Type Beginning balance Increase Amortization Ending balance
Software 1,306,607 228,549 (311,372) 1,223,784
Other intangible assets 1,765,697 50,965 (220,603) 1,596,059
3,072,304 279,514 (531,975) 2,819,843
(in thousands of Korean won)
June 30, 2011
1
Type Beginning balance Increase Amortization Ending balance
Software 1,632,196 53,625 (558,445) 1,127,376
Other intangible assets 849,207 956,340 (152,598) 1,652,949
2,481,403 1,009,965 (711,043) 2,780,325
1
Inclusive of transfer from advance payments.
11. Borrowings
Borrowings as of June 30, 2012 and December 31, 2011, consist of:
(in thousands of Korean won)
Annual
Types Lender June 30, 2012 December 31, 2011
interest rate (%)
Borrowings in won
SK Securities
Commercial paper 3.65 ~ 4.27 100,000,000 140,000,000
and 3 others
Woori Bank and
General loans 3.71 ~ 6.19 609,591,562 585,523,723
9 others
709,591,562 725,523,723
23
26. Hyundai Commercial, Inc. and Subsidiaries
Notes to the Interim Consolidated Financial Statements
June 30, 2012 and 2011, and December 31, 2011
12. Debentures
Debentures issued by the Group and outstanding as of June 30, 2012 and December 31, 2011,
are as follows:
(in thousands of Korean won)
Annual June 30, 2012 December 31, 2011
Type interest
rates (%) Par value Issue price Par value Issue price
Current portion of debenture
Debenture 3.78 ~ 6.45 740,000,000 740,000,000 635,000,000 635,000,000
Less: Discount on
- (270,012) - (253,677)
debentures
740,000,000 739,729,988 635,000,000 634,746,323
Non-current portion of debenture
Debenture 3.64 ~ 8.00 1,574,741,000 1,574,741,000 1,304,713,500 1,304,713,500
Less: Discount on
- (1,749,858) - (1,721,938)
debentures
1,574,741,000 1,572,991,142 1,304,713,500 1,302,991,562
2,314,741,000 2,312,721,130 1,939,713,500 1,937,737,885
13. Securitized debts
The amounts of securitized debts which are secured by loans and installment financial assets in
accordance with Asset Backed Securitization Act, as of June 30, 2012 and December 31, 2011,
are as follows:
(in thousands of Korean won)
Annual June 30, 2012 December 31, 2011
Type interest
rates (%) Par value Issue price Par value Issue price
Current portion of securitized debts
Debenture 4.12 ~ 4.26 50,000,000 50,000,000 50,000,000 50,000,000
Less: Discount on
- (18,499) - (62,214)
securitized debts
50,000,000 49,981,501 50,000,000 49,937,786
Non-current portion of securitized debts
Debenture 4.76 ~ 5.43 310,000,000 310,000,000 310,000,000 310,000,000
Less: Discount on
- (471,128) - (576,044)
securitized debts
310,000,000 309,528,872 310,000,000 309,423,956
360,000,000 359,510,373 360,000,000 359,361,742
24
27. Hyundai Commercial, Inc. and Subsidiaries
Notes to the Interim Consolidated Financial Statements
June 30, 2012 and 2011, and December 31, 2011
14. Defined Benefit Liability
Details of the amounts recognized in the income statements for the six-month periods ended
June 30, 2012 and 2011:
(in thousands of Korean won)
Type June 30, 2012 June 30, 2011
Current service cost 978,819 806,977
Interest cost 151,472 125,198
Expected return on plan assets (100,897) (75,764)
Past service cost 245,559 146,177
1,274,953 1,002,588
The amounts of defined benefit plans recognized in the statements of financial position as of June
30, 2012 and December 31, 2011, are as follows:
(in thousands of Korean won)
Type June 30, 2012 December 31, 2011
Present value of funded obligations 8,595,421 7,596,812
Fair value of plan assets (5,344,269) (5,364,346)
Defined benefit liability 3,251,152 2,232,466
15. Derivative Financial Instruments and Hedge Accounting
The Group has the convertible bond issued by Leehan Corp., and recognized the difference
between the acquisition cost of convertible bond and the fair value of normal bond as derivative
assets. The amount recognized as derivative assets as of June 30, 2012, is 228,839 thousand
(December 31, 2011 : 501,793 thousand), while the net losses from derivative asset for the six-
month period ended June 30, 2012, is 272,954 thousand. (June 30, 2011 : Nil)
Derivatives designated as cash flow hedges as of June 30, 2012 and December 31, 2011, are as
follows:
(in thousands of Korean won)
June 30, 2012 December 31, 2011
Accumulated Accumulated
other other
Type comprehen- comprehen-
Assets Liabilities Assets Liabilities
sive income sive income
and and
expenses expenses
Interest rate swaps 36,073 223,006 (141,599) - 241,837 (899,733)
Currency swaps 1,128,115 2,120,814 (473,628) 867,216 2,449,558 (183,215)
1,164,188 2,343,820 (615,227) 867,216 2,691,395 (1,082,948)
25
28. Hyundai Commercial, Inc. and Subsidiaries
Notes to the Interim Consolidated Financial Statements
June 30, 2012 and 2011, and December 31, 2011
The amount recognized as other comprehensive income, representing the effective portion related
to cash flow hedge, is 467,721 thousand as of June 30, 2012, and the reclassified amount from
other comprehensive income to profit or loss is 373,842 thousand. There is no ineffective portion
recognized related to cash flow hedge for the six-months periods ended June 30, 2012.
16. Equity
The Company is authorized to issue 80,000,000 shares (par value of per share : 5,000). As of
June 30, 2012 and December 31, 2011, the number of common stock and preferred stock, and
paid in capital are as follows :
(in thousands of Korean won, except number of shares)
Type June 30, December 31,
2012 2011
Number of shares 20,000,000 20,000,000
Common Capital stock 100,000,000 100,000,000
stock Additional paid-in capital -
100,000,000 100,000,000
Number of shares 5,000,000 5,000,000
Preferred Capital stock 25,000,000 25,000,000
stock Additional paid in capital 74,608,060 74,608,060
99,608,060 99,608,060
Total 199,608,060 199,608,060
The convertible preferred stocks have been issued at 20,000 per share(par value 5,000 per
share) are non-cumulative, non-participating, nominative, non-permanent preferred stock without
voting right, and will be converted into common stock after seven years from issue date.
Legal reserve and discretionary reserve as of June 30, 2012 and December 31, 2011, are as
follows:
(in millions of Korean won)
June 30, December 31,
Type 2012 2011
Legal reserve Revenue reserve 4,000,000 1,000,000
Reserve for electronic financial
Discretionary 100,000 100,000
transactions
reserve
Reserve for bad loans 3,357,192 -
Unappropriated retained earnings
(Expected reserve for bad loans
133,817,650 145,366,632
June 30, 2012: 9,918,236 thousand,
December 31, 2011: 3,357,192 thousand)
141,274,842 146,466,632
26
29. Hyundai Commercial, Inc. and Subsidiaries
Notes to the Interim Consolidated Financial Statements
June 30, 2012 and 2011, and December 31, 2011
If allowances for doubtful accounts do not meet the minimum amount calculated in accordance
with allowance reserve standards of Regulation on Supervision under Article 11 of the Specialized
Credit Financial Business Law Article 11, the Group appropriates a reserve for bad loans in an
amount more than the difference between the allowance and the requirement. The reserve for bad
loans is attributed to discretionary reserve for retained earnings. If the existing reserve for bad
loans exceeds the reserve for bad loans to be reserved, the excess amounts are to be reversed.
And if undisposed deficit exists, the reserve for bad loans is reserved after undisposed deficit is
disposed of.
Appropriated and expected reserves for bad loans as of June 30, 2012 and December 31,
2011, are as follows:
(in thousands of Korean won)
Type June 30, 2012 December 31, 2011
Appropriated reserve for bad loans 3,357,192 -
Expected reserve for bad loans 9,682,546 3,357,192
13,039,738 3,357,192
Transfer to reserve for bad loans and net income in consideration of effect of changes in
reserve for bad loan for the six-month periods ended June 30, 2012 and 2011, are as follows:
(in thousands of Korean won)
Type June 30, 2012 June 30, 2011
Net income 24,659,315 37,078,406
1
Transfer to reserve for bad loans (9,682,546) (408,955)
Net income in consideration of changes in reserve for
2 14,976,769 36,669,451
bad loans
Net income per share in consideration of changes in
3 749 1,833
reserve for bad loans (In won)
1
Transfer to reserve for bad loans are subtracted from balance of reserve for bad loans in 2011 to balance
in 2010.
2
Net income in consideration of changes in reserve for bad loans is not accordance with K-IFRS, and the
amount is the sum of the transfer to reserve for bad loans before income tax and net income.
3
Net income per share in consideration of changes is calculated by subtracting the transfer to reserve for
bad loans from the net income for common stock.
The 30 billion of dividends for fiscal year ended December 31, 2011, were paid in March 2012
(2011 : 10 billion).
(in thousands of Korean won)
Type December 31, 2011 December 31, 2010
Common stock 24,000,000 10,000,000
Preferred stock 6,000,000 -
Total 30,000,000 10,000,000
27
30. Hyundai Commercial, Inc. and Subsidiaries
Notes to the Interim Consolidated Financial Statements
June 30, 2012 and 2011, and December 31, 2011
17. General and Administrative Expenses
General and administrative expenses for the three-month and six-month periods ended June 30,
2012 and 2011, are as follows:
(in thousands of Korean won)
2012 2011
Three months Six months Three months Six months
Payroll 4,568,093 8,195,793 4,274,675 8,695,536
Severance benefits 781,519 1,274,914 561,708 1,002,588
Fringe benefits 1,312,506 2,727,606 1,154,555 2,362,867
Outsourcing service charges 992,298 1,979,729 756,554 1,509,578
Sales promotions 3,602,914 6,888,858 2,445,376 5,726,356
Commission 606,483 1,811,504 431,747 1,208,684
Outsourcing service commission 732,547 1,233,670 535,593 958,006
Depreciation 258,027 502,421 311,567 672,065
Amortization 255,995 531,975 339,339 711,043
Taxes and dues 443,323 938,001 548,729 879,271
Electronic expenses 357,298 749,399 412,527 638,012
Rent 372,536 628,469 208,812 429,658
Maintenance expenses on
278,182 547,957 248,076 460,591
building
Travel and transportation 187,139 375,963 168,305 311,253
Education 150,203 282,273 227,632 386,322
Communication 128,639 270,700 121,740 246,901
Other expenses 553,536 927,721 531,698 866,689
15,581,238 29,866,953 13,278,633 27,065,420
18. Income Tax
The Group recognized income tax based on estimation of weighted average annual tax rate annual
fiscal year. Expected weighted average annual tax rate for June 30, 2012, is 29.7% (June 30,
2011 : 27.5%).
28
31. Hyundai Commercial, Inc. and Subsidiaries
Notes to the Interim Consolidated Financial Statements
June 30, 2012 and 2011, and December 31, 2011
19. Other Comprehensive Income
Other comprehensive income for the six-month periods ended June 30, 2012 and 2011, consist of:
(in thousands of Korean won)
June 30, 2012
Changes
Beginning Reclassifi- Income Ending
Type Other
balance cation of tax effects balance
changes
profit or loss
Loss on valuation of
derivatives (1,082,948) 373,842 243,204 (149,325) (615,227)
Gain on valuation of
available-for-sale 6,047,838 - (5,415,441) 1,310,537 1,942,934
financial assets
Accumulated
comprehensive
expense of equity
(1,702,584) - 1,818,209 (47,725) 67,900
method investee
3,262,306 373,842 (3,354,028) 1,113,487 1,395,607
(in thousands of Korean won)
June 30, 2011
Changes
Beginning Reclassifi- Income Ending
Type cation of Other
balance tax effects balance
profit or changes
loss
Loss on valuation of
derivatives (1,662,559) 1,240,761 (191,820) (279,020) (892,638)
Gain on valuation of
available-for-sale 2,180,057 4,837,638 (1,001,007) 6,016,688
financial assets -
Accumulated
comprehensive
expense of equity
(1,379,779) (415,618) 91,436 (1,703,961)
-
method investee
(862,281) 1,240,761 4,230,200 (1,188,591) 3,420,089
20. Supplemental Cash Flow Information
Cash and cash equivalents in the statements of financial position as of June 30, 2012 and
December 31, 2011, consist of:
(in thousands of Korean won)
Type June 30, 2012 December 31, 2011
Cash 2,000 2,000
Ordinary deposits 17,622,199 6,005,235
Short-term financial instruments 297,615,346 270,001,884
315,239,545 276,009,119
29
32. Hyundai Commercial, Inc. and Subsidiaries
Notes to the Interim Consolidated Financial Statements
June 30, 2012 and 2011, and December 31, 2011
Cash generated from operations for the six-month periods ended June 30, 2012 and 2011, are as
follows:
(in thousands of Korean won)
June 30, 2012 June 30, 2011
Net income 24,659,315 37,078,406
Adjustments
Net interest expenses 74,978,498 68,533,277
Dividends (250,000) (300,000)
Income tax 10,391,091 12,974,838
Gain on loans receivable 21,687,165 15,172,240
Gain on installment financing 2,200,962 (250,805)
Gain on leased assets (10,039) (14,991)
Gain on foreign currency translation - (2,186,000)
Gain on disposal of property and equipment (1,661) (4,346)
Gain on valuation of derivatives (27,500) -
Gain on equity method valuation 2,125,980 (8,660,056)
Bad debts expense 8,697,812 10,960,117
Severance benefits 1,274,953 1,002,588
Depreciation 502,421 672,065
Amortization of intangible assets 531,975 711,043
Loss on foreign currency translation 27,500 -
Loss on disposal of property and equipment 87,386 48,895
Loss on reduction of investment assets - 610,000
Loss on valuation of derivatives 272,954 2,186,000
Others - 1,098
122,489,497 101,455,963
Changes in operating assets and liabilities
Decrease in available-for-sale securities - 3,250,000
(Increase) in loans receivable (262,534,798) (415,348,138)
Decrease in installment financing receivables 55,086,969 37,637,771
(Increase) in finance lease receivables (22,303,623) (22,769,853)
(Increase) in deferred loan origination fees and
(35,959,538) (23,675,361)
costs
(Decrease) in present value discounts (706,058) (1,025,485)
(Decrease) in allowance for bad debts (35,833) (604,585)
Decrease in non-trade receivables 6,852,230 2,592,380
Decrease(increase) in accrued revenues 1,793,683 (2,146,615)
Decrease(increase) in advance payments 254,740 (400,508)
Decrease in prepaid expenses 436,058 4,145,987
Increase in non-trade payables 4,716,375 703,537
(Decrease) in accrued expenses (6,470,211) (5,547,376)
Increase in unearned revenue 297,352 1,739,579
(Decrease) in advance receipts (124,986) (120,157)
Increase in withholdings 1,766,667 127,081
30